Recognition: no theorem link
Towards Measuring Interactive Visualization Abilities: Connecting With Existing Literacies and Assessments
Pith reviewed 2026-05-15 17:21 UTC · model grok-4.3
The pith
We lack formal methods to assess people's abilities to interact effectively with data visualizations.
A machine-rendered reading of the paper's core claim, the machinery that carries it, and where it could break.
Core claim
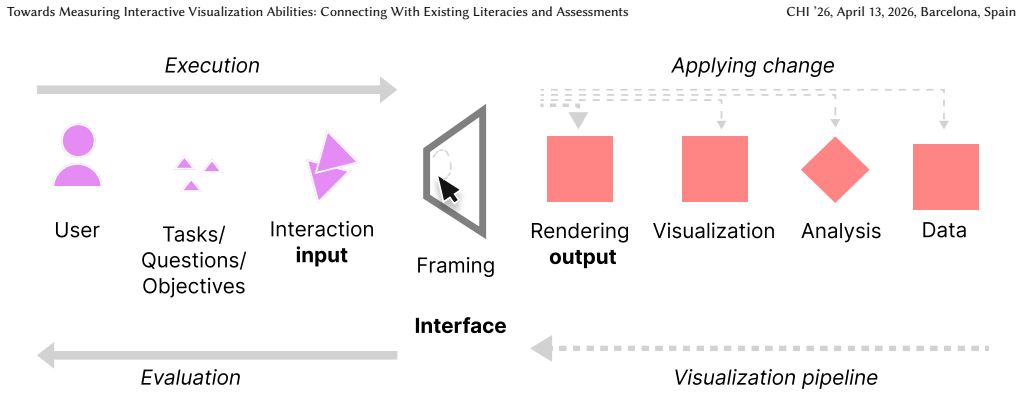
The paper states that despite advances in investigating multiple visualization abilities, we do not yet have formal methods to assess the ability of a person to interact with a data visualization effectively. It proposes and compares different approaches for assessing the abilities that people leverage to use visualizations in interactive sensemaking tasks by connecting to existing literacy concepts and assessments.
What carries the argument
Connecting existing static literacy concepts and assessments, such as visualization literacy tests, to interactive abilities used in data sensemaking tasks.
If this is right
- New assessment methods could be created by adapting static tests to include interaction components such as filtering or brushing.
- These methods would enable evaluation of user performance in real sensemaking scenarios involving dynamic data views.
- Comparing proposed approaches would identify which connections to existing literacies are most promising for test development.
- Improved assessment would support better training and design of interactive visualizations for everyday data use.
Where Pith is reading between the lines
- Interactive skills may prove distinct from static ones, suggesting separate training paths rather than simple extensions of current tests.
- Follow-up work could link these assessments to broader digital or computational literacy frameworks.
- Pilot studies validating the proposed approaches against real-world task outcomes would be a direct next step.
Load-bearing premise
That connecting existing static literacy concepts and assessments will yield valid and practical methods for measuring interactive visualization abilities in sensemaking tasks.
What would settle it
An empirical study finding that performance on interactive visualization tasks does not correlate with scores derived from any existing static literacy or related assessments.
Figures
read the original abstract
How do we assess people's abilities to interact with data visualizations? The current state-of-the-art visualization literacy tests -- such as VLAT and its derivatives -- only involve the use of static visualizations. Despite advances in investigating multiple visualization abilities, we do not yet have formal methods to assess the ability of a person to interact with a data visualization effectively. In this position paper, we discuss related literacy concepts and assessments to propose and compare different approaches for assessing the abilities that people leverage to use visualizations in interactive sensemaking tasks.
Editorial analysis
A structured set of objections, weighed in public.
Referee Report
Summary. This position paper argues that existing visualization literacy assessments such as VLAT and its derivatives are restricted to static visualizations, leaving no formal methods for evaluating the ability to interact effectively with data visualizations during sensemaking tasks. It connects this gap to related literacy concepts and assessments, then proposes and compares several conceptual approaches for developing such methods.
Significance. If the proposed connections to static literacy frameworks can be operationalized, the work could stimulate development of practical interactive assessment instruments that better match contemporary visualization use. As a position paper it appropriately avoids empirical claims while clearly framing a research direction; its value lies in surfacing the gap and sketching transfer strategies without overclaiming transferability.
minor comments (3)
- [Abstract] Abstract: explicitly note that the manuscript is a position paper to set appropriate expectations for readers seeking empirical instruments.
- [Introduction] Introduction: add a short paragraph roadmap after the problem statement to clarify how the subsequent sections on related literacies and proposed approaches are organized.
- [References] References: ensure every named assessment (VLAT, derivatives, and any static literacy instruments discussed) receives a complete, up-to-date citation.
Simulated Author's Rebuttal
We thank the referee for their constructive review and for recommending minor revision. We appreciate the recognition that the position paper appropriately frames the research gap in interactive visualization assessment without overclaiming empirical results.
Circularity Check
No significant circularity
full rationale
This position paper identifies the lack of formal interactive visualization assessment methods and outlines conceptual connections to existing static literacy frameworks such as VLAT without advancing empirical claims, quantitative predictions, fitted parameters, or mathematical derivations. No load-bearing step reduces by construction to self-citation, self-definition, or renaming of prior results within the paper; the central premise rests on an accurate observation of the current state of the art, and proposed approaches are presented as exploratory discussion rather than validated outputs. The derivation chain is therefore self-contained and non-circular.
Axiom & Free-Parameter Ledger
axioms (1)
- domain assumption Visualization abilities can be meaningfully assessed through connections to existing literacy frameworks.
Reference graph
Works this paper leans on
-
[1]
Robert A. Amar, James Eagan, and John T. Stasko. 2005. Low-Level Components of Analytic Activity in Information Visualization. InProceedings of the IEEE Conference on Information Visualization. IEEE Computer Society, Los Alamitos, CA, USA, 111–117. doi:10.1109/INFVIS.2005.1532136
-
[2]
Benjamin Bach. 2018. Ceci n’est pas la data: Towards a Notion of Interaction Lit- eracy for Data Visualization.. InProceedings of A VI Workshop on Visual Interfaces for Big Data Environments in Industrial Applications. ACM, New York, NY, USA, 1–3. https://ceur-ws.org/Vol-2108/invited1.pdf
work page 2018
-
[3]
Oswald Barral, Sébastien Lallé, Grigorii Guz, Alireza Iranpour, and Cristina Conati. 2020. Eye-Tracking to Predict User Cognitive Abilities and Performance for User-Adaptive Narrative Visualizations. InProceedings of the ACM Conference on Multimodal Interaction. ACM, New York, NY, USA, 163–173. doi:10.1145/ 3382507.3418884
-
[4]
Michel Beaudouin-Lafon. 2000. Instrumental interaction: an interaction model for designing post-WIMP user interfaces. InProceedings of the ACM Conference on Human Factors in Computing Systems. ACM, New York, NY, USA, 446–453. doi:10.1145/332040.332473
-
[5]
Benjamin B. Bederson and James D. Hollan. 1994. Pad++: A Zooming Graphical Interface for Exploring Alternate Interface Physics. InProceedings of the ACM Symposium on User Interface Software and Technology. ACM, New York, NY, USA, 17–26. doi:10.1145/192426.192435
-
[6]
Jeremy Boy, Ronald A. Rensink, Enrico Bertini, and Jean-Daniel Fekete. 2014. A Principled Way of Assessing Visualization Literacy.IEEE Transactions on Visualization and Computer Graphics20, 12 (2014), 1963–1972. doi:10.1109/TVCG. 2014.2346984
- [7]
-
[8]
Jon Callow. 2008. Show Me: Principles for Assessing Students’ Visual Literacy. The Reading Teacher61, 8 (2008), 616–626. doi:10.1598/RT.61.8.3
-
[9]
Card, Jock Mackinlay, and Ben Shneiderman
Stuart K. Card, Jock Mackinlay, and Ben Shneiderman. 1999.Readings in Infor- mation Visualization: Using Vision to Think. Morgan Kaufmann, San Francisco, CA, USA. https://books.google.dk/books?id=wdh2gqWfQmgC
work page 1999
-
[10]
Astrid Carolus, Yannik Augustin, André Markus, and Carolin Wienrich. 2023. Digital interaction literacy model – Conceptualizing competencies for literate interactions with voice-based AI systems.Computers and Education: Artificial Intelligence4 (2023), 100114. doi:10.1016/j.caeai.2022.100114
- [11]
-
[12]
Cristina Conati, Sébastien Lallé, Md. Abed Rahman, and Dereck Toker. 2020. Com- paring and Combining Interaction Data and Eye-tracking Data for the Real-time Prediction of User Cognitive Abilities in Visualization Tasks.ACM Transactions on Interactive Intelligent Systems10, 2 (2020), 12:1–12:41. doi:10.1145/3301400
-
[13]
Ying Cui, Fu Chen, Alina Lutsyk, Jacqueline P. Leighton, and Maria Cutumisu
-
[14]
Data literacy assessments: a systematic literature review.Assessment in Education: Principles, Policy & Practice30, 1 (2023), 76–96. doi:10.1080/0969594X. 2023.2182737
-
[15]
Evanthia Dimara, Harry Zhang, Melanie Tory, and Steven Franconeri. 2022. The Unmet Data Visualization Needs of Decision Makers Within Organizations.IEEE Transactions on Visualization and Computer Graphics28, 12 (2022), 4101–4112. doi:10.1109/TVCG.2021.3074023
-
[16]
Lily W. Ge, Yuan Cui, and Matthew Kay. 2023. CALVI: Critical Thinking As- sessment for Literacy in Visualizations. InProceedings of the ACM Conference on Human Factors in Computing Systems. ACM, New York, NY, USA, 815:1–815:18. doi:10.1145/3544548.3581406
-
[17]
Helia Hashemi, Jason Eisner, Corby Rosset, Benjamin Van Durme, and Chris Kedzie. 2024. LLM-Rubric: A Multidimensional, Calibrated Approach to Au- tomated Evaluation of Natural Language Texts. InProceedings of the Annual Meeting of the Association for Computational Linguistics. ACL, Bangkok, Thailand, 13806–13834. doi:10.18653/V1/2024.ACL-LONG.745
-
[18]
Weaver, Bongshin Lee, Dominique Brodbeck, and Paolo Buono
Sean Kandel, Jeffrey Heer, Catherine Plaisant, Jessie Kennedy, Frank van Ham, Nathalie Henry Riche, Chris E. Weaver, Bongshin Lee, Dominique Brodbeck, and Paolo Buono. 2011. Research directions in data wrangling: Visualizations and transformations for usable and credible data.Information Visualization10, 4 (2011), 271–288. doi:10.1177/1473871611415994
-
[19]
Sukwon Lee, Sung-Hee Kim, and Bum Chul Kwon. 2017. VLAT: Development of a Visualization Literacy Assessment Test.IEEE Transactions on Visualization and Computer Graphics23, 1 (2017), 551–560. doi:10.1109/TVCG.2016.2598920
-
[20]
Sukwon Lee, Bum Chul Kwon, Jiming Yang, Byung Cheol Lee, and Sung-Hee Kim
-
[21]
The Correlation between Users’ Cognitive Characteristics and Visualization Literacy.Applied Sciences9, 3, Article 488 (2019), 20 pages. doi:10.3390/app9030488
-
[22]
Gabriela Molina León, Benjamin Bach, Matheus Valentim, and Niklas Elmqvist. 2026.A Multiliteracy Model for Interactive Visualization Literacy: Definitions, Literacies, and Steps for Future Research. arXiv:2602.09631 doi:10.1145/3772318. 3793423
-
[23]
Gabriela Molina León, Michael Lischka, Wei Luo, and Andreas Breiter. 2022. Mobile and Multimodal? A Comparative Evaluation of Interactive Workplaces for Visual Data Exploration.Computer Graphics Forum41, 3 (2022), 417–428. https://doi.org/10.1111/cgf.14551
-
[24]
Nargess Nourbakhsh, Yang Wang, Fang Chen, and Rafael A. Calvo. 2012. Using galvanic skin response for cognitive load measurement in arithmetic and reading tasks. InProceedings of the Australian Computer-Human Interaction Conference. ACM, New York, NY, USA, 420–423. doi:10.1145/2414536.2414602
-
[25]
2025.Survey of Adult Skills 2023 Technical Report
OECD. 2025.Survey of Adult Skills 2023 Technical Report. Technical Report. OECD Skills Studies, Paris. doi:10.1787/80d9f692-en
-
[26]
Saugat Pandey and Alvitta Ottley. 2023. Mini-VLAT: A Short and Effective Measure of Visualization Literacy.Computer Graphics Forum42, 3 (2023), 1–11. doi:10.1111/cgf.14809 CHI ’26, April 13, 2026, Barcelona, Spain Molina León et al
-
[27]
Peter Pirolli and Stuart Card. 2005. The Sensemaking Process and Leverage Points for Analyst Technology as Identified Through Cog- nitive Task Analysis. InProceedings of the International Conference on Intelligence Analysis. MITRE Corporation, McLean, VA, USA, 2–4. https://andymatuschak.org/files/papers/Pirolli,%20Card%20-%202005%20- %20The%20sensemaking%...
work page 2005
-
[28]
Yu (David) Shi, Natalie Ruiz, Ronnie Taib, Eric H. C. Choi, and Fang Chen. 2007. Galvanic skin response (GSR) as an index of cognitive load. InExtended Abstracts of the ACM Conference on Human Factors in Computing Systems. ACM, New York, NY, USA, 2651–2656. doi:10.1145/1240866.1241057
-
[29]
Ben Shneiderman. 1983. Direct Manipulation: A Step Beyond Programming Languages.Computer16, 8 (1983), 57–69. doi:10.1109/MC.1983.1654471
-
[30]
Tamara L. Shreiner. 2019. Students’ Use of Data Visualizations in Historical Reasoning: A Think-Aloud Investigation with Elementary, Middle, and High School Students.The Journal of Social Studies Research43, 4 (2019), 389–404. doi:10.1016/j.jssr.2018.11.001
-
[31]
Ben Steichen, Cristina Conati, and Giuseppe Carenini. 2014. Inferring Visual- ization Task Properties, User Performance, and User Cognitive Abilities from Eye Gaze Data.ACM Transactions on Interactive Intelligent Systems4, 2 (2014), 11:1–11:29. doi:10.1145/2633043
-
[32]
The New London Group. 1996. A Pedagogy of Multiliteracies: Designing Social Futures.Harvard Educational Review66, 1 (1996), 60–92. doi:10.17763/haer.66.1. 17370n67v22j160u
-
[33]
John W. Tukey. 1977.Exploratory Data Analysis. Addison-Wesley, Boston, MA, USA
work page 1977
-
[34]
2024.TIMSS 2023 International Results in Mathematics and Science
Matthias von Davier, Ann Kennedy, Katherine Reynolds, Bethany Fishbein, Lale Khorramdel, Charlotte Aldrich, Allison Bookbinder, Ummugul Bezirhan, and Liqun Yin. 2024.TIMSS 2023 International Results in Mathematics and Science. Technical Report. Boston College, TIMSS & PIRLS International Study Center. doi:10.6017/lse.tpisc.timss.rs6460
-
[35]
Barner, and Matthew Louis Mauriello
Qile Wang, Moath Erqsous, Kenneth E. Barner, and Matthew Louis Mauriello
-
[36]
LATA: A Pilot Study on LLM-Assisted Thematic Analysis of Online Social Network Data Generation Experiences.Proceedings of the ACM on Human- Computer Interaction9, 2 (2025), 1–28. doi:10.1145/3711022
-
[37]
Yun Wang, Zhaojun Ding, Xuansheng Wu, Siyue Sun, Ninghao Liu, and Xiaoming Zhai. 2025. AutoSCORE: Enhancing Automated Scoring with Multi-Agent Large Language Models via Structured Component Recognition.CoRRabs/2509.21910 (2025), 9 pages. arXiv:2509.21910 doi:10.48550/ARXIV.2509.21910
-
[38]
Susan Wyche, Charles Steinfield, Tian Cai, Nightingale Simiyu, and Martha E. Othieno. 2016. Reflecting on Video: Exploring the Efficacy of Video for Teaching Device Literacy in Rural Kenya. InProceedings of the ACM Conference on Infor- mation and Communication Technologies and Development. ACM, New York, NY, USA, 8:1–8:10. doi:10.1145/2909609.2909667
-
[39]
Ji Soo Yi, Youn ah Kang, John Stasko, and J.A. Jacko. 2007. Toward a Deeper Understanding of the Role of Interaction in Information Visualization.IEEE Transactions on Visualization and Computer Graphics13, 6 (2007), 1224–1231. doi:10.1109/TVCG.2007.70515
discussion (0)
Sign in with ORCID, Apple, or X to comment. Anyone can read and Pith papers without signing in.