Grid-Supporting Equipment Supply Chains Constrain the Feasible Pace of Power System Expansion
Pith reviewed 2026-05-10 03:46 UTC · model grok-4.3
The pith
Grid-supporting equipment supply chains, proxied by material needs, limit feasible U.S. power system expansion to roughly 71 percent of high-growth targets by 2030.
A machine-rendered reading of the paper's core claim, the machinery that carries it, and where it could break.
Core claim
In the U.S. case study, GSE shortages reach 269.6--274.1 GVA (28.5%--28.6%) by 2030 under high-growth conditions. Copper becomes fully binding, with steel and nickel forming additional constraints. Trade disruption intensifies shortages, while grid-enhancing technologies provide limited relief. These results show that grid expansion depends on the timely manufacturability, replacement, and material support of GSE.
What carries the argument
Dynamic stock-flow modeling combined with bill-of-materials accounting and multi-regional supply-use analysis, using critical material requirements as a physically grounded proxy for GSE supply constraints.
If this is right
- Copper demand becomes the dominant binding limit on GSE availability by 2030.
- Steel and nickel shortages add secondary but measurable constraints under high-growth pathways.
- Disruptions to international trade amplify the overall GSE shortage beyond baseline projections.
- Deployment of grid-enhancing technologies yields only modest relief against the material-driven limits.
- Expansion plans that ignore GSE deliverability overstate achievable system growth.
Where Pith is reading between the lines
- Long-term grid planning models will need to add explicit supply-chain modules or risk producing infeasible schedules.
- Policy incentives for domestic manufacturing or material recycling could directly increase the feasible pace of decarbonization.
- Similar material-binding patterns may appear in other regions pursuing rapid electrification, suggesting a broader need for coordinated supply-chain forecasting.
Load-bearing premise
Manufacturing data are often fragmented or proprietary, so critical material requirements serve as a physically grounded proxy for grid-supporting equipment supply constraints.
What would settle it
A comprehensive survey or audit of actual GSE manufacturing capacity and material flows through 2030 that shows no binding copper or steel shortages while still meeting high-growth deployment targets would falsify the modeled constraint.
Figures


read the original abstract
Power system expansion depends on the equipment required to connect, convert, regulate, and condition electricity, yet grid-supporting equipment (GSE) is rarely modeled as an explicit constraint. We develop a framework integrating dynamic stock-flow modeling, bill-of-materials accounting, multi-regional supply-use analysis, and expansion optimization to quantify GSE deployment requirements and upstream material dependence. Because manufacturing data are often fragmented or proprietary, we use critical material requirements as a physically grounded proxy for GSE supply constraints. In a U.S. case study, GSE shortages reach 269.6--274.1 GVA (28.5%--28.6%) by 2030 under high-growth conditions. Copper becomes fully binding, with steel and nickel forming additional constraints. Trade disruption intensifies shortages, while grid-enhancing technologies provide limited relief. These results show that grid expansion depends on the timely manufacturability, replacement, and material support of GSE, motivating planning frameworks that explicitly incorporate deliverability, supply chain exposure, and resilience strategies.
Editorial analysis
A structured set of objections, weighed in public.
Referee Report
Summary. The paper claims that grid-supporting equipment (GSE) supply chains constrain power system expansion. It develops an integrated framework combining dynamic stock-flow modeling, bill-of-materials accounting, multi-regional supply-use analysis, and expansion optimization. Because manufacturing data are fragmented, critical material requirements are used as a physically grounded proxy for GSE supply constraints. In a U.S. case study under high-growth conditions, GSE shortages reach 269.6-274.1 GVA (28.5-28.6%) by 2030, with copper fully binding and steel and nickel as additional constraints. Trade disruptions intensify shortages while grid-enhancing technologies provide limited relief.
Significance. If the proxy and model hold, the results would be significant for energy systems research by showing that equipment manufacturability and material availability must be treated as explicit constraints in expansion planning, with implications for decarbonization timelines and resilience strategies. The multi-method integration is a strength that could serve as a template for other regions.
major comments (2)
- Abstract and Methods: The central modeling choice to proxy GSE supply constraints via critical material requirements (due to proprietary data) is load-bearing for the headline shortage figures. No validation is provided against historical GSE deployment rates versus material consumption, leaving open the possibility that non-material bottlenecks (factory throughput, labor, permitting) dominate and that shortages are mis-attributed to copper, steel, and nickel.
- Results: The specific claims of 269.6-274.1 GVA shortages (28.5-28.6%) and copper being 'fully binding' by 2030 require explicit stock-flow equations, material intensity values, and sensitivity tests on the proxy assumptions and growth scenarios. Without these, it is impossible to assess whether the percentages are robust or sensitive to the proxy.
minor comments (2)
- Abstract: Define 'GVA' (gigavolt-amperes) on first use for accessibility to readers outside power systems.
- Throughout: Provide full citations and, if possible, a data availability statement for all material intensity and supply-use tables to support reproducibility.
Simulated Author's Rebuttal
We thank the referee for the constructive comments. We address each major point below, providing clarifications on our proxy approach and data presentation while indicating targeted revisions to improve transparency.
read point-by-point responses
-
Referee: Abstract and Methods: The central modeling choice to proxy GSE supply constraints via critical material requirements (due to proprietary data) is load-bearing for the headline shortage figures. No validation is provided against historical GSE deployment rates versus material consumption, leaving open the possibility that non-material bottlenecks (factory throughput, labor, permitting) dominate and that shortages are mis-attributed to copper, steel, and nickel.
Authors: We agree the proxy is central and that historical validation would strengthen the analysis. Manufacturing data for GSE are fragmented and proprietary, as stated in the manuscript, which is why critical material requirements serve as a physically grounded proxy. We will add a new subsection in Methods justifying the proxy with supporting literature on material-to-equipment linkages (e.g., copper in transformers and cables). We will also add a Limitations paragraph explicitly discussing non-material bottlenecks such as factory throughput, labor, and permitting, noting that our figures represent material-constrained lower bounds. Sensitivity tests on material intensities will be included to probe attribution. revision: partial
-
Referee: Results: The specific claims of 269.6-274.1 GVA shortages (28.5-28.6%) and copper being 'fully binding' by 2030 require explicit stock-flow equations, material intensity values, and sensitivity tests on the proxy assumptions and growth scenarios. Without these, it is impossible to assess whether the percentages are robust or sensitive to the proxy.
Authors: The stock-flow equations, bill-of-materials accounting, and material intensity values are already detailed in Methods Section 3 and the Supplementary Information. To address accessibility, we will move the core stock-flow equations and a summary table of material intensities into the main text. We will add a new Results subsection with sensitivity tests varying proxy assumptions (material intensities ±15% from literature ranges) and growth scenarios, confirming the robustness of the 269.6-274.1 GVA shortage range and copper's binding status under high-growth conditions. revision: yes
Circularity Check
No significant circularity; model outputs are independent of fitted inputs
full rationale
The paper constructs a multi-component framework (dynamic stock-flow modeling + bill-of-materials accounting + multi-regional supply-use analysis + expansion optimization) whose GSE supply limits are set by an explicit modeling choice: critical-material intensities used as a proxy because manufacturing data are fragmented. The headline shortage figures (269.6–274.1 GVA) are computed outputs of this forward simulation under stated growth scenarios, not parameters fitted to those same shortage values or renamed predictions. No equation, section, or self-citation chain in the provided text reduces the central claim to a tautology or to a self-referential fit. The derivation therefore remains self-contained against external benchmarks and data sources.
Axiom & Free-Parameter Ledger
axioms (1)
- domain assumption Critical material requirements serve as a physically grounded proxy for GSE supply constraints
Reference graph
Works this paper leans on
-
[1]
geopolitically less predictable partner regions
These differences indicate that shortening equipment lifetimes primarily advances and352 enlarges unmet demand and does not change the overall shortage trajectory.353 This amplification is concentrated in replacement-sensitive non-transformer GSE. with pes-354 simistic lifetimes, shortages increase most clearly for PMSG converters and SPV inverters, with3...
-
[2]
Department of Energy
U.S. Department of Energy. Evaluating the reliability and security of the united states electric850 grid. Tech. Rep. U.S. Department of Energy (2025). URL:https://www.energy.gov/sites/851 default/files/2025-07/DOE%20Final%20EO%20Report%20%28FINAL%20JULY%207%29.pdf.852
2025
-
[3]
Burke, P .J., Stern, D.I., and Bruns, S.B. (2018). The impact of electricity on economic de-853 velopment: A macroeconomic perspective. International Review of Environmental and Re-854 source Economics12, 85–127. 855
2018
-
[4]
Powering intelligence 2026: Updated scenarios of u.s
EPRI. Powering intelligence 2026: Updated scenarios of u.s. data center electricity use and856 power strategies. Tech. Rep. 3002034697 EPRI Palo Alto, CA (2026).857
2026
-
[5]
(2024).858 Exploding ai power use: an opportunity to rethink grid planning and management
Lin, L., Wijayawardana, R., Rao, V., Nguyen, H., GNIBGA, E.W., and Chien, A.A. (2024).858 Exploding ai power use: an opportunity to rethink grid planning and management. In Pro-859 ceedings of the 15th ACM International Conference on Future and Sustainable Energy Sys-860 tems. pp. 434–441. 861
2024
-
[6]
Shehabi, A., Newkirk, A., Smith, S.J., Hubbard, A., Lei, N., Siddik, M.A.B., Holecek, B.,862 Koomey, J., Masanet, E., and Sartor, D. (2024). 2024 united states data center energy863 usage report. 864
2024
-
[7]
Electric grid supply chain review: large power transformers and866 high voltage direct current systems
Nguyen, R., Severson, M., Zhang, B., Vaagensmith, B., Rahman, M.M., Toba, A.L., Price, P .,865 Davis, R., and Williams, S. Electric grid supply chain review: large power transformers and866 high voltage direct current systems. Tech. Rep. USDOE Office of Policy (OP), Washington,867 DC (United States) (2022). 868
2022
-
[8]
Major drivers of long-term distribution trans-869 former demand
McKenna, K., Abraham, S.A., and Wang, W. Major drivers of long-term distribution trans-869 former demand. Tech. Rep. National Renewable Energy Laboratory (NREL), Golden, CO870 (United States) (2024). 871
2024
-
[9]
Blaabjerg, F ., Chen, Z., and Kjaer, S.B. (2004). Power electronics as efficient interface in872 dispersed power generation systems. IEEE transactions on power electronics19, 1184–873
2004
-
[10]
Eltawil, M.A., and Zhao, Z. (2010). Grid-connected photovoltaic power systems: Technical875 and potential problems—a review. Renewable and sustainable energy reviews14, 112–129.876
2010
-
[11]
Blaabjerg, F ., Liserre, M., and Ma, K. (2011). Power electronics converters for wind turbine877 systems. IEEE Transactions on industry applications48, 708–719.878
2011
-
[12]
Wang, G., Konstantinou, G., Townsend, C.D., Pou, J., Vazquez, S., Demetriades, G.D.,879 and Agelidis, V.G. (2016). A review of power electronics for grid connection of utility-scale880 battery energy storage systems. IEEE Transactions on Sustainable Energy7, 1778–1790.881
2016
-
[13]
Karpati, A., Zsigmond, G., V ¨or¨os, M., and Lendvay, M. (2012). Uninterruptible power sup-882 plies (ups) for data center. In 2012 IEEE 10th Jubilee International Symposium on Intelligent883 Systems and Informatics. IEEE pp. 351–355. 884
2012
-
[14]
Safayatullah, M., Elrais, M.T., Ghosh, S., Rezaii, R., and Batarseh, I. (2022). A compre-885 hensive review of power converter topologies and control methods for electric vehicle fast886 charging applications. IEEe Access10, 40753–40793. 887 28
2022
-
[15]
Pineda, S., and Morales, J.M. (2018). Chronological time-period clustering for optimal ca-888 pacity expansion planning with storage. IEEE Transactions on Power Systems33, 7162–889
2018
-
[16]
Guerra, K., Haro, P ., Guti ´errez, R., and G ´omez-Barea, A. (2022). Facing the high share891 of variable renewable energy in the power system: Flexibility and stability requirements.892 Applied Energy310, 118561. 893
2022
-
[17]
Zhang, X., Chau, T.K., Chow, Y .H., Fernando, T., and Iu, H.H.C. (2023). A novel sequence894 to sequence data modelling based cnn-lstm algorithm for three years ahead monthly peak895 load forecasting. IEEE Transactions on Power Systems39, 1932–1947.896
2023
-
[18]
Brown, M., Hotchkiss, E., Collins, G., Seyedrezaei, M., and Bazilian, M. (2025). No minerals,897 no megawatts: how material costs and availability shape the future of the us power sector.898 Resources Policy106, 105607. 899
2025
-
[19]
Wang, S., Hausfather, Z., Davis, S., Lloyd, J., Olson, E.B., Liebermann, L., N ´u˜nez-Mujica,900 G.D., and McBride, J. (2023). Future demand for electricity generation materials under dif-901 ferent climate mitigation scenarios. Joule7, 309–332. 902
2023
-
[20]
Y ao, B., Bernstein, A., and Dvorkin, Y . (2026). Generation expansion planning with upstream903 supply chain constraints on materials, manufacturing, and deployment. IEEE Transactions904 on Energy Markets, Policy and Regulation. 905
2026
-
[21]
Liang, Y ., Kleijn, R., and Van der Voet, E. (2023). Increase in demand for critical materials906 under iea net-zero emission by 2050 scenario. Applied Energy346, 121400.907
2023
-
[22]
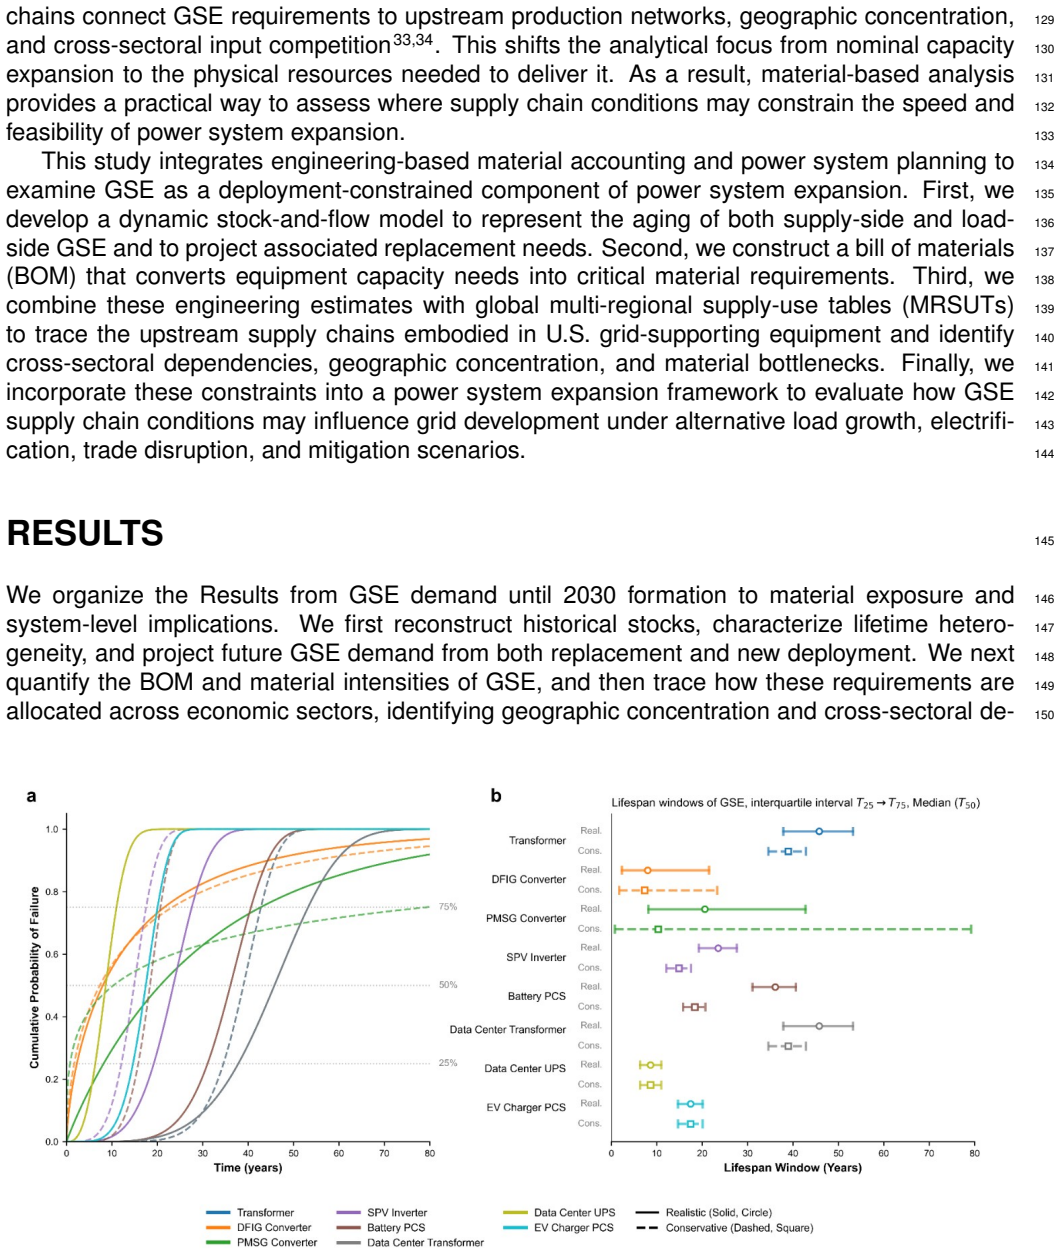
(2024).908 The impacts of material supply availability on a transitioning electric power sector
Qiu, Y ., Iyer, G., Graham, N., Binsted, M., Wise, M., Patel, P ., and Y arlagadda, B. (2024).908 The impacts of material supply availability on a transitioning electric power sector. Cell909 Reports Sustainability1. 910
2024
-
[23]
Hotchkiss, E., Urdaneta, M.P ., and Bazilian, M.D. (2024). Comparing methods for criticality911 and security in minerals for clean energy. The Extractive Industries and Society17, 101402.912
2024
-
[24]
Analysis of supply chain challenges in the us913 solar industry: Focus on build america, buy america act and inverter supply issues
Barlow, I., Stewart, E.M., and Culler, M.J. Analysis of supply chain challenges in the us913 solar industry: Focus on build america, buy america act and inverter supply issues. Tech.914 Rep. Idaho National Laboratory (INL), Idaho Falls, ID (United States) (2024).915
2024
-
[25]
Wind energy: Supply chain deep916 dive assessment
Baranowski, R., Cooperman, A., Gilman, P ., and Lantz, E. Wind energy: Supply chain deep916 dive assessment. Tech. Rep. USDOE Office of Policy (PO), Washington DC (United States)917 (2022). 918
2022
-
[26]
Material requirements for electric-919 ity grids
Nohl, L., Finck, R., Magnani, N., and Volkanovski, A. Material requirements for electric-919 ity grids. Science for Policy JRC143190 European Commission, Joint Research Centre920 (2025). URL:https://publications.jrc.ec.europa.eu/repository/handle/JRC143190921 jRC Publications Repository. 922
2025
-
[27]
Comments of undersigned organizations regarding section 232 tariffs925 on electrical transformers and components (docket no
National Electrical Manufacturers Association, National Electrical Contractors Association,923 National Association of Electrical Distributors, Leading Builders of America, and GridWise924 Alliance (2025). Comments of undersigned organizations regarding section 232 tariffs925 on electrical transformers and components (docket no. bis-2025-0023). Public Com...
2025
-
[28]
Nguyen, R., Severson, M., Zhang, B., Vaagensmith, B., Rahman, M.M., Toba, A.L., Price, P .,930 Davis, R., and Williams, S. Electric grid supply chain review: Large power transformers and931 high voltage direct current systems. Tech. Rep. USDOE Office of Policy (OP), Washington,932 DC (United States) (2022). URL:https://www.osti.gov/biblio/1871501. doi:10....
work page doi:10.2172/933 2022
-
[29]
Large power transformer resilience
United States Department of Energy. Large power transformer resilience. Tech.935 Rep. United States Department of Energy Washington, DC (2024). URL:https:936 //www.energy.gov/sites/default/files/2024-10/EXEC-2022-001242%20-%20Large%937 20Power%20Transformer%20Resilience%20Report%20signed%20by%20Secretary%938 20Granholm%20on%207-10-24.pdf. 939
2024
-
[30]
Ieee standard for information coding for distribution transformers and step-voltage940 regulators - redline
(2024). Ieee standard for information coding for distribution transformers and step-voltage940 regulators - redline. IEEE Std C57.12.35-2024 (Revision of IEEE Std C57.12.35-2013) -941 Redline pp. 1–39. 942
2024
-
[31]
Y ang, Z., Zhang, J., Wang, S., Wang, J., and Huang, X. (2016). Building ontology-based bill943 of material design and knowledge management in power gird. In 2016 12th International944 Conference on Natural Computation, Fuzzy Systems and Knowledge Discovery (ICNC-945 FSKD). IEEE pp. 1664–1669. 946
2016
-
[32]
Olivetti, E.A., Ceder, G., Gaustad, G.G., and Fu, X. (2017). Lithium-ion battery supply chain947 considerations: analysis of potential bottlenecks in critical metals. Joule1, 229–243.948
2017
-
[33]
Hache, E., Seck, G.S., Simoen, M., Bonnet, C., and Carcanague, S. (2019). Critical raw949 materials and transportation sector electrification: A detailed bottom-up analysis in world950 transport. Applied Energy240, 6–25. 951
2019
-
[34]
Ku, A.Y ., Alonso, E., Eggert, R., Graedel, T., Habib, K., Hool, A., Muta, T., Schrijvers, D.,952 Tercero, L., Vakhitova, T. et al. (2024). Grand challenges in anticipating and responding to953 critical materials supply risks. Joule8, 1208–1223. 954
2024
-
[35]
Stadler, K., Wood, R., Bulavskaya, T., S ¨odersten, C.J., Simas, M., Schmidt, S., Usubi-955 aga, A., Acosta-Fern ´andez, J., Kuenen, J., Bruckner, M., Giljum, S., Lutter, S., Merciai, S.,956 Schmidt, J.H., Theurl, M.C., Plutzar, C., Kastner, T., Eisenmenger, N., Erb, K.H., Koning,957 A., Deck, C.E.C.A.E., Rasul, K., Hertwich, E., and Tukker, A. (2025). Ex...
-
[36]
Energy Information Administration (2025)
U.S. Energy Information Administration (2025). Form EIA-860 detailed data with previ-960 ous form data (EIA-860A/860B). U.S. Department of Energy. URL:https://www.eia.gov/961 electricity/data/eia860/. 962
2025
-
[37]
Gagnon, P ., Pham, A., Cole, W., Hamilton, A., Awara, S., Barlas, A., Brown, M., Brown, P .,963 Carag, V., Cohen, S. et al. 2024 standard scenarios report: A u.s. electricity sector outlook.964 Tech. Rep. National Renewable Energy Laboratory (NREL), Golden, CO (United States)965 (2024). URL:https://www.osti.gov/biblio/2496240. doi:10.2172/2496240.966
-
[38]
The 2030967 national charging network: Estimating us light-duty demand for electric vehicle charging968 infrastructure
Wood, E., Borlaug, B., Moniot, M., Lee, D.Y .D., Ge, Y ., Y ang, F ., and Liu, Z. The 2030967 national charging network: Estimating us light-duty demand for electric vehicle charging968 infrastructure. Tech. Rep. National Renewable Energy Laboratory (NREL), Golden, CO969 (United States) (2023). 970 30
2023
-
[39]
Stadler, K., Wood, R., Bulavskaya, T., S ¨odersten, C.J., Simas, M., Schmidt, S., Usubiaga,971 A., Acosta-Fern´andez, J., Kuenen, J., Bruckner, M. et al. (2018). Exiobase 3: Developing a972 time series of detailed environmentally extended multi-regional input-output tables. Journal973 of Industrial Ecology22, 502–515. 974
2018
-
[40]
Stadler, K., Wood, R., Bulavskaya, T., S ¨odersten, C.J., Simas, M., Schmidt, S., Usubiaga,975 A., Acosta-Fern ´andez, J., Kuenen, J., Bruckner, M. et al. (2021). Exiobase 3. Zenodo.976 Retrieved March22, 2023. 977
2021
-
[41]
Bolhuis, M.A., Chen, M.J., and Kett, B.R. (2023). Fragmentation in global trade: Accounting978 for commodities. International Monetary Fund. 979
2023
-
[42]
Daminov, I., Prokhorov, A., Caire, R., and Alvarez-Herault, M.C. (2021). Assessment of980 dynamic transformer rating, considering current and temperature limitations. International981 Journal of Electrical Power & Energy Systems129, 106886.982
2021
-
[43]
Byles, D., and Mohagheghi, S. (2023). Sustainable power grid expansion: Life cycle as-983 sessment, modeling approaches, challenges, and opportunities. Sustainability15, 8788.984
2023
-
[44]
Salomez, F ., Helbling, H., Almanza, M., Soupremanien, U., Vine, G., Voldoire, A., Allard, B.,985 Ben-Ahmed, H., Chatroux, D., Cizeron, A. et al. (2024). State of the art of research towards986 sustainable power electronics. Sustainability16, 2221. 987
2024
-
[45]
Pinto, L., Riondet, L., Rio, M., Lembeye, Y ., and Crebier, J.C. (2025). Addressing modularity988 in ecodesigned power electronics. Procedia CIRP135, 918–923.989
2025
-
[46]
America’s strategy to secure the supply chain for a robust clean energy transition.990 Tech
Igogo, T. America’s strategy to secure the supply chain for a robust clean energy transition.990 Tech. Rep. USDOE Office of Policy, Washington DC (United States) (2022).991
2022
-
[47]
Kulasek, K., Lindgren, E., Johansson, E., Jul, M., Flood, J., and Oliva, M. (2020). Towards992 net zero emissions-the role of circularity in transformers. Transform. Mag4, 51–58.993
2020
-
[48]
Elgamli, E., and Anayi, F . (2023). Advancements in electrical steels: A comprehensive re-994 view of microstructure, loss analysis, magnetic properties, alloying elements, and the influ-995 ence of coatings. applied sciences13, 10283. 996
2023
-
[49]
Rao, U.M., Fofana, I., and N’cho, J.S. (2020). On some imperative ieee standards for usage997 of natural ester liquids in transformers. IEEE Access8, 145446–145456.998
2020
-
[50]
Li, W. (2002). Incorporating aging failures in power system reliability evaluation. IEEE Trans-999 actions on Power systems17, 918–923. 1000
2002
-
[51]
Aubertin, S. (2016). Power and distribution transformer markets. Transformers Magazine3,1001 38–45. 1002
2016
-
[52]
Us solar photovoltaic system and energy storage1004 cost benchmarks, with minimum sustainable price analysis: Q1 2023
Ramasamy, V., Zuboy, J., Woodhouse, M., O’Shaughnessy, E., Feldman, D., Desai, J.,1003 Walker, A., Margolis, R., and Basore, P . Us solar photovoltaic system and energy storage1004 cost benchmarks, with minimum sustainable price analysis: Q1 2023. Tech. Rep. National1005 Renewable Energy Laboratory (NREL), Golden, CO (United States) (2023).1006
2023
-
[53]
Paananen, J. (2023). Grid-interactive data centers enabling energy transition: Data cen-1007 ter’s hidden potential to provide essential grid services of a future power system. IEEE1008 electrification magazine11, 26–34. 1009 31
2023
-
[54]
U.S. Geological Survey. Mineral commodity summaries 2025. Tech. Rep. U.S. Geological1010 Survey (2025). doi:10.3133/mcs2025version 1.2, March 2025, 212 p., ISSN 0076-89521011 (print). 1012
-
[55]
Applegate, J.D. (2023). Final list of critical minerals. US Geological Survey, Department of1013 the Interior. 1014
2023
-
[56]
Wood, R., Stadler, K., Bulavskaya, T., Lutter, S., Giljum, S., De Koning, A., Kuenen, J.,1015 Sch¨utz, H., Acosta-Fern´andez, J., Usubiaga, A. et al. (2014). Global sustainability account-1016 ing—developing exiobase for multi-regional footprint analysis. Sustainability7, 138–163.1017
2014
-
[57]
Census Bureau (2025)
U.S. Census Bureau (2025). Annual economic surveys: Annual sur-1018 vey of manufactures benchmark: 2018 - 2021. Data.gov Catalog. U.S.1019 Department of Commerce. URL:https://catalog.data.gov/dataset/1020 annual-economic-surveys-annual-survey-of-manufactures-benchmark-2018-20211021 accessed: April 21, 2026. 1022
2025
-
[58]
Miller, R.E., and Blair, P .D. (2009). Input-output analysis: foundations and extensions. Cam-1023 bridge university press. 1024
2009
-
[59]
Wieland, H., Giljum, S., Bruckner, M., Owen, A., and Wood, R. (2018). Structural production1025 layer decomposition: a new method to measure differences between mrio databases for1026 footprint assessments. Economic Systems Research30, 61–84.1027
2018
-
[60]
Ten Raa, T. (2005). The economics of input-output analysis. Cambridge University Press.1028
2005
-
[61]
UN Comtrade Database.https://comtrade.un.1029 org/
United Nations Statistics Division (2026). UN Comtrade Database.https://comtrade.un.1029 org/. . Accessed: 2026-03-22. 1030 32
2026
discussion (0)
Sign in with ORCID, Apple, or X to comment. Anyone can read and Pith papers without signing in.