Characterizing and spectrally modeling embedded FUor eruptions in the near-infrared
Pith reviewed 2026-05-10 01:36 UTC · model grok-4.3
The pith
Near-infrared spectra and disk models confirm infrared-selected young stellar objects as embedded FUor eruptions with high extinction.
A machine-rendered reading of the paper's core claim, the machinery that carries it, and where it could break.
Core claim
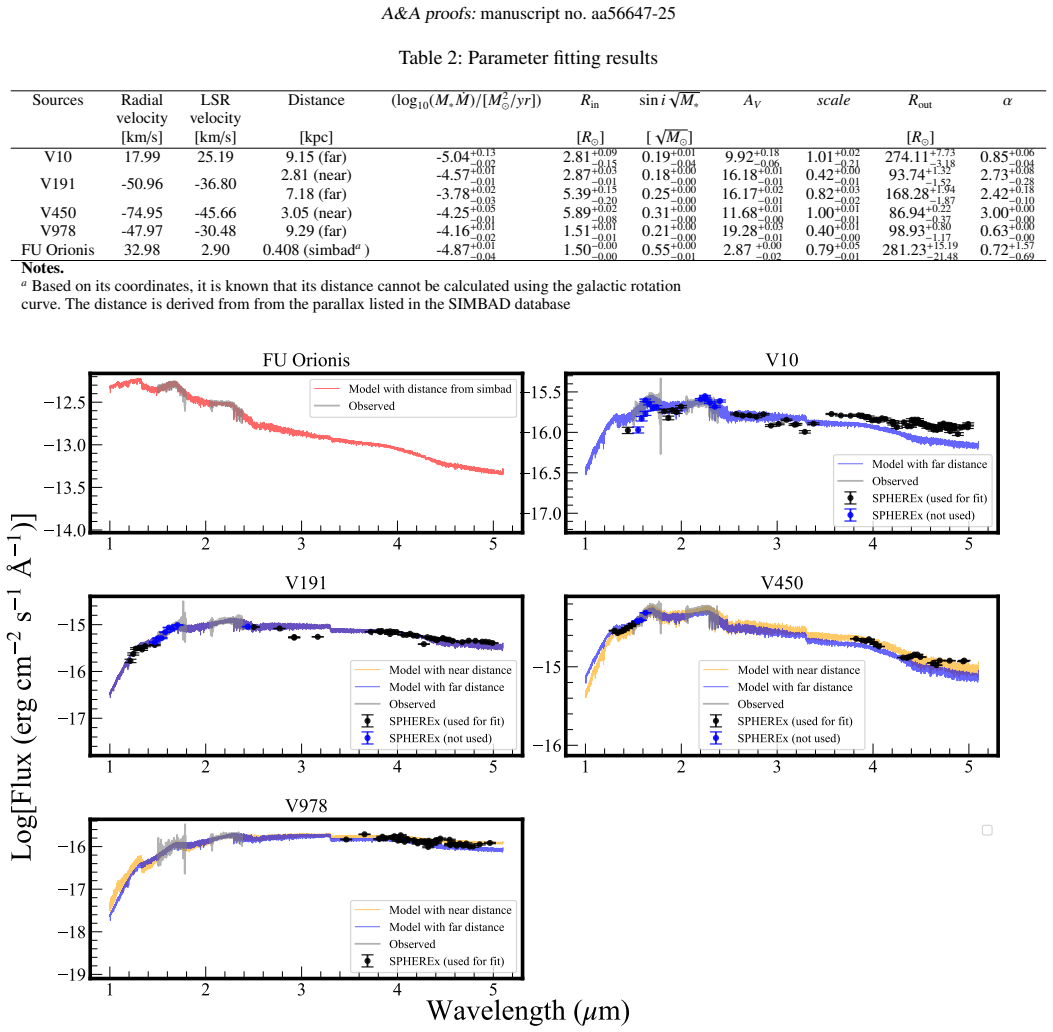
All observed objects display CO and H2O absorption bands at 2.3 microns and occupy positions in the Na plus Ca versus CO equivalent width diagram that confirm their classification as FUors. The best-fitting disk models match both the spectral features and the overall continuum shape, returning high extinctions of A_V = 10-20 mag and M_star times M_dot values comparable to those of FU Orionis. Among the 18 sources initially selected by infrared light curves, 6-7 out of the 8 with available spectra exhibit these FUor characteristics.
What carries the argument
Two-component disk model of an actively accreting inner disk plus passively irradiated outer disk, combined with equivalent-width measurements of CO, Na, and Ca lines.
If this is right
- High extinctions mean these FUors are invisible at optical wavelengths, so infrared time-domain surveys are required to find them.
- Accretion rates similar to FU Orionis indicate that the same inner-disk outburst mechanism operates in embedded environments.
- The high confirmation rate among infrared candidates shows that light-curve selection efficiently recovers FUor events in dense star-forming regions.
- Episodic accretion confirmed in obscured sources supports its proposed role in solving the luminosity problem for young stellar objects.
Where Pith is reading between the lines
- Repeating the infrared selection plus near-IR follow-up on larger samples could produce a more complete count of FUor frequency across the Galaxy.
- The same modeling framework could be applied to other classes of eruptive young stellar objects to test whether they share the same inner-disk structure.
- Future infrared facilities could catch the onset of these outbursts and obtain time-resolved spectra to track changes in the accretion flow.
Load-bearing premise
The observed absorption bands, diagram positions, and disk-model fits are assumed to identify these sources uniquely as FUors rather than other variable young stellar objects.
What would settle it
Detection of an infrared outburst light curve in a source that shows no CO or H2O absorption at 2.3 microns or whose spectrum cannot be fit by the accreting-inner plus irradiated-outer disk model.
Figures




read the original abstract
Context. Episodic accretion in young stellar objects (YSOs) is thought to play a critical role in addressing the "luminosity problem" associated with star formation. However, optical surveys tend to bias against sources that are heavily obscured. Infrared time-domain surveys, such as unTimely WISE, facilitate the identification of such sources within the dense star formation regions of our Galaxy. Aims. We aim to systematically identify and characterize FUor outbursts in infrared-selected YSOs using high-resolution spectroscopy and detailed disk modeling. Methods. We conducted follow-up high-resolution spectroscopy with Gemini South/IGRINS for four FUor candidates discovered in infrared time-domain surveys. Using a combination of photometric and spectroscopic observations, we constructed spectral energy distributions and fit them with a disk model that incorporates an actively accreting inner disk together with a passively irradiated outer disk. Results. All objects show CO and H$_2$O absorption bands at 2.3$\mu$m, and their positions in the Na + Ca versus CO equivalent width diagram further corroborate their classification as FUors. The best-fitting model spectra closely match both the observed spectral features and the overall continuum, providing additional confirmation of the FUor classification. The best-fit models reveal high extinction values ($A_V$ = 10-20 mag), with $M_*\dot{M}$ comparable to those of classical FUors such as FU Orionis. Among 18 sources initially selected via infrared light curves, $6-$7 out of 8 with available spectra exhibit FUor characteristics, implying a high selection efficiency.
Editorial analysis
A structured set of objections, weighed in public.
Referee Report
Summary. The manuscript reports follow-up Gemini/IGRINS near-infrared spectroscopy and two-component disk modeling (actively accreting inner disk plus passively irradiated outer disk) for four infrared-selected FUor candidates from time-domain surveys. It finds that all objects exhibit CO and H2O absorption bands at 2.3 μm, occupy the appropriate region of the Na+Ca versus CO equivalent-width diagram, and are well-fit by models yielding A_V = 10–20 mag and M_*Ṁ values comparable to classical FUors such as FU Orionis. The authors conclude that 6–7 of the 8 sources with spectra (from an initial sample of 18) display FUor characteristics, implying high selection efficiency for embedded outbursts.
Significance. If the classifications prove robust, the work would be significant for episodic-accretion studies because it supplies a concrete demonstration that IR light-curve selection can efficiently recover heavily extincted FUors missed by optical surveys. The reported consistency of accretion-rate products with known FUors and the high yield among spectroscopically observed targets would strengthen the case that such events contribute substantially to resolving the luminosity problem in embedded star formation.
major comments (3)
- [Abstract and Results] Abstract, Results paragraph: The claim that CO/H2O bands, Na+Ca vs. CO EW diagram placement, and two-component disk fits 'further corroborate' and 'provide additional confirmation' of FUor classification is load-bearing but unsupported by any quantitative comparison to a control sample of non-outbursting Class I/II YSOs at comparable extinction. No equivalent-width statistics or model fits for such a sample are presented, so overlap cannot be excluded.
- [Results] Results (modeling description): The statement that 'best-fitting model spectra closely match' the data does not include reported χ² values, posterior widths on A_V and M_*Ṁ, or fits to alternative models (e.g., steady-state or truncated inner-disk geometries). Without these, degeneracies between extinction, accretion rate, and disk geometry remain unquantified.
- [Methods] Methods: No details are supplied on IGRINS data reduction, equivalent-width measurement procedures, or error propagation. These omissions directly affect the reliability of the diagnostic diagram and the claimed spectral matches.
minor comments (2)
- [Abstract] Abstract: The notation 'M_* Mdot' should be rendered as M_*Ṁ (or M_* dot{M}) for standard clarity.
- [Abstract] Abstract: The context sentence on infrared time-domain surveys would benefit from an explicit citation to the unTimely WISE survey.
Simulated Author's Rebuttal
We thank the referee for their constructive and detailed comments, which have identified areas where the manuscript can be strengthened. We address each major comment below and indicate the revisions we will implement.
read point-by-point responses
-
Referee: [Abstract and Results] Abstract, Results paragraph: The claim that CO/H2O bands, Na+Ca vs. CO EW diagram placement, and two-component disk fits 'further corroborate' and 'provide additional confirmation' of FUor classification is load-bearing but unsupported by any quantitative comparison to a control sample of non-outbursting Class I/II YSOs at comparable extinction. No equivalent-width statistics or model fits for such a sample are presented, so overlap cannot be excluded.
Authors: We acknowledge that a direct quantitative comparison against a control sample of non-outbursting Class I/II YSOs at similar extinctions would provide stronger evidence against potential overlap. The CO/H2O features and Na+Ca vs. CO EW diagram are established diagnostics in the FUor literature, and our infrared-variable sources align with known FUors. In the revised manuscript we will add a short discussion citing equivalent-width statistics from published non-FUor YSO samples and explicitly note the absence of a dedicated control sample in the present work as a limitation. This constitutes a partial revision. revision: partial
-
Referee: [Results] Results (modeling description): The statement that 'best-fitting model spectra closely match' the data does not include reported χ² values, posterior widths on A_V and M_*Ṁ, or fits to alternative models (e.g., steady-state or truncated inner-disk geometries). Without these, degeneracies between extinction, accretion rate, and disk geometry remain unquantified.
Authors: We agree that quantitative fit statistics and exploration of alternative models are needed to assess degeneracies. In the revised Results section we will report χ² values for the best-fit models, provide posterior widths or uncertainties on A_V and M_*Ṁ, and include a brief comparison to steady-state and truncated-disk geometries. These additions will be made in the next version of the manuscript. revision: yes
-
Referee: [Methods] Methods: No details are supplied on IGRINS data reduction, equivalent-width measurement procedures, or error propagation. These omissions directly affect the reliability of the diagnostic diagram and the claimed spectral matches.
Authors: We apologize for these omissions. The revised Methods section will describe the IGRINS data reduction steps, the exact procedures for equivalent-width measurements (including continuum definition and integration windows), and the error propagation methods used for the diagnostic diagram. These details will be added to ensure full transparency and reproducibility. revision: yes
Circularity Check
No significant circularity; classification rests on external spectral standards and new observations
full rationale
The paper reports new Gemini/IGRINS spectra and applies standard two-component disk modeling (active inner + passive outer) to photometric/spectroscopic data. FUor classification is corroborated by observed CO/H2O bands at 2.3 μm and positions in the Na+Ca vs. CO EW diagram, both drawn from prior literature on classical FUors rather than defined within this work. Model fits yield A_V and M_*Ṁ values but are not renamed as 'predictions' of the input data; they are direct fits. No self-citation chain is load-bearing for the central claim, and no equation reduces the result to its own inputs by construction. The derivation is self-contained against external benchmarks.
Axiom & Free-Parameter Ledger
free parameters (2)
- A_V (extinction)
- M_* Mdot (accretion rate product)
axioms (2)
- domain assumption The system consists of an actively accreting inner disk plus a passively irradiated outer disk.
- domain assumption CO and H2O absorption at 2.3um combined with Na+Ca vs CO equivalent width diagram position uniquely identifies FUors.
Reference graph
Works this paper leans on
-
[1]
Allard, F. 2014, in IAU Symposium, V ol. 299, Exploring the Formation and Evo- lution of Planetary Systems, ed. M. Booth, B. C. Matthews, & J. R. Graham, 271–272
work page 2014
- [2]
-
[3]
Bae, J., Hartmann, L., Zhu, Z., & Nelson, R. P. 2014, ApJ, 795, 61
work page 2014
-
[4]
Bock, J. J., Aboobaker, A. M., Adamo, J., et al. 2026, ApJ, 999, 139
work page 2026
-
[5]
Carvalho, A. S., Hillenbrand, L. A., Hambsch, F.-J., et al. 2023, ApJ, 953, 86
work page 2023
-
[6]
Connelley, M. S. & Reipurth, B. 2018, ApJ, 861, 145 Contreras Peña, C., Lucas, P. W., Minniti, D., et al. 2017, MNRAS, 465, 3011
work page 2018
-
[7]
Dunham, M. M., Evans, II, N. J., Terebey, S., Dullemond, C. P., & Young, C. H. 2010, ApJ, 710, 470
work page 2010
-
[8]
Evans, II, N. J., Dunham, M. M., Jørgensen, J. K., et al. 2009, ApJS, 181, 321
work page 2009
-
[9]
Findeisen, K., Hillenbrand, L., Ofek, E., et al. 2013, ApJ, 768, 93
work page 2013
-
[10]
Fischer, W. J., Hillenbrand, L. A., Herczeg, G. J., et al. 2023, in Astronomical Society of the Pacific Conference Series, V ol. 534, Protostars and Planets VII, ed. S. Inutsuka, Y . Aikawa, T. Muto, K. Tomida, & M. Tamura, 355
work page 2023
-
[11]
Fitzpatrick, E. L. 1999, PASP, 111, 63 Gaia Collaboration, Brown, A. G. A., Vallenari, A., et al. 2021, A&A, 649, A1 Gaia Collaboration, Vallenari, A., Brown, A. G. A., et al. 2023, A&A, 674, A1
work page 1999
- [12]
-
[13]
Guo, Z., Lucas, P. W., Contreras Peña, C., et al. 2021, MNRAS, 504, 830
work page 2021
- [14]
- [15]
-
[16]
2011, arXiv e-prints, arXiv:1106.3343
Hartmann, L., Zhu, Z., & Calvet, N. 2011, arXiv e-prints, arXiv:1106.3343
-
[17]
A., Carvalho, A., van Roestel, J., & De, K
Hillenbrand, L. A., Carvalho, A., van Roestel, J., & De, K. 2023, ApJ, 958, L27
work page 2023
-
[18]
Hillenbrand, L. A., Carvalho, A. S., Stern, D., et al. 2025, ApJ, 988, 77
work page 2025
-
[19]
A., Contreras Peña, C., Morrell, S., et al
Hillenbrand, L. A., Contreras Peña, C., Morrell, S., et al. 2018, ApJ, 869, 146
work page 2018
-
[20]
Kaplan, K., Lee, J.-J., Sawczynec, E., & Kim, H.-J. 2024, igrins/plp: v3.0.0
work page 2024
- [21]
- [22]
-
[23]
Liu, H., Herczeg, G. J., Johnstone, D., et al. 2022, ApJ, 936, 152
work page 2022
-
[24]
W., Elias, J., Points, S., et al
Lucas, P. W., Elias, J., Points, S., et al. 2020, MNRAS, 499, 1805
work page 2020
- [25]
-
[26]
2018, in Society of Photo-Optical Instru- mentation Engineers (SPIE) Conference Series, V ol
Mace, G., Sokal, K., Lee, J.-J., et al. 2018, in Society of Photo-Optical Instru- mentation Engineers (SPIE) Conference Series, V ol. 10702, Ground-based and Airborne Instrumentation for Astronomy VII, ed. C. J. Evans, L. Simard, & H. Takami, 107020Q
work page 2018
- [27]
- [28]
-
[29]
Meisner, A. M., Caselden, D., Schlafly, E. F., & Kiwy, F. 2023, AJ, 165, 36
work page 2023
-
[30]
Minniti, D., Lucas, P. W., Emerson, J. P., et al. 2010, New A, 15, 433 Morales-Calderón, M., Stauffer, J. R., Hillenbrand, L. A., et al. 2011, ApJ, 733, 50
work page 2010
-
[31]
Park, C., Jaffe, D. T., Yuk, I.-S., et al. 2014, in Society of Photo-Optical Instru- mentation Engineers (SPIE) Conference Series, V ol. 9147, Ground-based and Airborne Instrumentation for Astronomy V , ed. S. K. Ramsay, I. S. McLean, & H. Takami, 91471D
work page 2014
-
[32]
2021, ApJ, 920, 132 Pérez, S., Hales, A., Liu, H
Park, W., Lee, J.-E., Contreras Peña, C., et al. 2021, ApJ, 920, 132 Pérez, S., Hales, A., Liu, H. B., et al. 2020, ApJ, 889, 59
work page 2021
- [33]
- [34]
-
[35]
Reipurth, B., Aspin, C., & Herbig, G. H. 2012, ApJ, 748, L5
work page 2012
-
[36]
Robitaille, T. P. 2017, A&A, 600, A11
work page 2017
-
[37]
Robitaille, T. P., Whitney, B. A., Indebetouw, R., Wood, K., & Denzmore, P. 2006, ApJS, 167, 256
work page 2006
-
[38]
Rodriguez, A. C. & Hillenbrand, L. A. 2022, ApJ, 927, 144
work page 2022
-
[39]
Roychowdhury, T. & Hillenbrand, L. A. 2024, Research Notes of the AAS, 8, 171
work page 2024
-
[40]
Saito, R., Hempel, M., Alonso-García, J., et al. 2010, The Messenger, 141, 24
work page 2010
-
[41]
Sawczynec, E., Kaplan, K. F., Mace, G. N., et al. 2025, PASP, 137, 034505
work page 2025
- [42]
-
[43]
Shakura, N. I. & Sunyaev, R. A. 1973, A&A, 24, 337
work page 1973
- [44]
-
[45]
Skrutskie, M. F., Cutri, R. M., Stiening, R., et al. 2006, AJ, 131, 1163
work page 2006
-
[46]
Ulrich, R. K. 1976, ApJ, 210, 377 V orobyov, E. I. & Basu, S. 2006, ApJ, 650, 956
work page 1976
- [47]
- [48]
-
[49]
Wenger, T. V ., Balser, D. S., Anderson, L. D., & Bania, T. M. 2018, ApJ, 856, 52
work page 2018
- [50]
-
[51]
Wright, E. L., Eisenhardt, P. R. M., Mainzer, A. K., et al. 2010, AJ, 140, 1868
work page 2010
- [52]
-
[53]
Zhu, Z., Jiang, Y .-F., & Stone, J. M. 2020, MNRAS, 495, 3494 Article number, page 11 A&A proofs:manuscript no. aa56647-25 Appendix A: Fitting procedure The fitting procedure is based on Bayesian inference. The obser- vational data used in the fitting consist of two components: (i) the ground-based near-infrared spectra and (ii) the SPHEREx low- resolutio...
work page 2020
discussion (0)
Sign in with ORCID, Apple, or X to comment. Anyone can read and Pith papers without signing in.