Recognition: unknown
Evaluating Computing Platforms for Sustainability: A Comparative Analysis of FPGAs against ASICs, GPUs, and CPUs
Pith reviewed 2026-05-09 22:54 UTC · model grok-4.3
The pith
FPGAs can be more sustainable than ASICs, GPUs, or CPUs for frequently changing low-volume workloads because reconfigurability amortizes embodied carbon across multiple uses.
A machine-rendered reading of the paper's core claim, the machinery that carries it, and where it could break.
Core claim
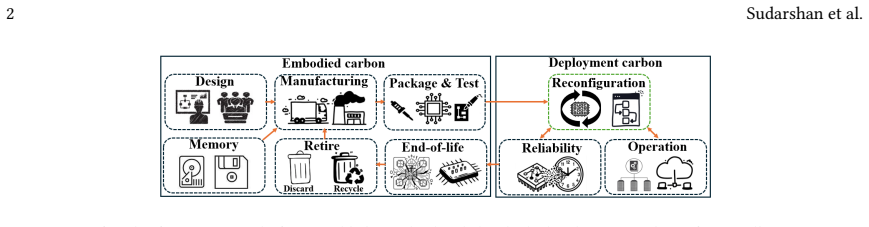
GreenFPGA shows that FPGAs can be more sustainable than ASICs, GPUs, and CPUs under iso-performance assumptions whenever workloads are diverse and frequently changing and when application volumes are low; the advantage arises because embodied emissions incurred once during fabrication and design are spread across repeated reconfigurations instead of requiring separate hardware for each task.
What carries the argument
GreenFPGA, a lifetime carbon-footprint estimator that models uncertainties in design, manufacturing, reconfigurability-driven reuse, operation, disposal, testing, and recycling phases and computes total emissions for direct platform comparisons.
If this is right
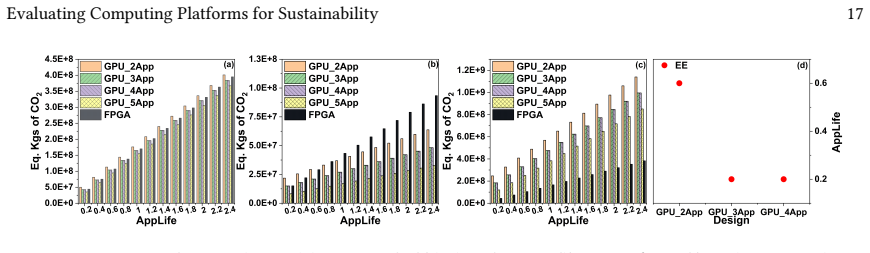
- Total carbon footprint depends strongly on application type, device lifetime, daily usage hours, and production volume.
- Reconfigurability provides a concrete mechanism to reduce embodied emissions when the same hardware serves successive workloads.
- Platform selection for a given workload set must weigh both operational energy and the full manufacturing-plus-disposal footprint.
- Low-volume or rapidly evolving deployments favor FPGAs over fixed-function or general-purpose alternatives under the modeled conditions.
Where Pith is reading between the lines
- Hardware procurement policies for cloud or edge fleets could shift toward reconfigurable devices when task diversity is high and replacement cycles are short.
- The same amortization logic might apply to other reconfigurable fabrics if their manufacturing emissions are comparable.
- Extending the model to include software development emissions or supply-chain variability would tighten the uncertainty bounds used in the comparisons.
Load-bearing premise
That performance can be matched exactly across platforms and that the chosen uncertainty ranges for carbon emissions during fabrication and reuse correctly bound real-world variation.
What would settle it
A side-by-side measurement of total carbon emissions for one FPGA reused across ten distinct applications versus ten separate ASICs each running one of those applications, all delivering the same performance, would directly test whether the modeled sustainability edge appears.
Figures


read the original abstract
Climate change concerns emphasize the need for sustainable computing. Modeling the carbon footprint (CFP), including operational and embodied CFP from semiconductor use, manufacture and design, is essential. Field programmable gate arrays (FPGAs) stand out as promising platforms due to their reconfigurability across various applications, enabling the amortization of embodied CFP across multiple applications. This paper introduces GreenFPGA, a tool estimating the total CFP of FPGAs over their lifespan, considering uncertainties in CFP modeling. It accounts for CFP during design, manufacturing, reconfigurability (reuse), operation, disposal, testing, and recycling. GreenFPGA identifies deployment regimes in which FPGAs can be more sustainable than ASICs, GPUs, and CPUs under the modeled iso-performance assumptions. Experimental results highlight the importance of analyzing applications across different computing platforms to assess their CFP while varying parameters such as application type, lifetime, usage time, and volume impact their total CFP. Across the evaluated pairwise iso-performance case studies with ASICs, GPUs, and CPUs, FPGAs can be more sustainable under specific deployment regimes involving frequently changing, diverse workloads and low-volume applications.
Editorial analysis
A structured set of objections, weighed in public.
Referee Report
Summary. The manuscript introduces GreenFPGA, a tool for estimating the total carbon footprint (CFP) of FPGAs over their lifespan, accounting for uncertainties in design, manufacturing, reconfigurability, operation, disposal, testing, and recycling. It performs pairwise iso-performance comparisons with ASICs, GPUs, and CPUs and concludes that FPGAs can be more sustainable in regimes with frequently changing, diverse workloads and low-volume applications.
Significance. If the underlying models and assumptions prove accurate, this work could significantly influence sustainable computing practices by providing a framework to evaluate when reconfigurable platforms like FPGAs offer carbon advantages over specialized or general-purpose alternatives. The emphasis on varying parameters such as lifetime, usage time, and volume adds nuance to hardware selection for climate-conscious deployments.
major comments (2)
- [Abstract] Abstract: The sustainability conclusions rest on unvalidated iso-performance assumptions for the pairwise comparisons and on specific chosen uncertainty ranges for embodied CFP in design, manufacturing, reuse, and disposal phases; without shown equations, external calibration, or sensitivity bounds, the identified regimes (low-volume, frequently-changing workloads) are load-bearing on these internal parameter selections and could shift if FPGA resource overhead inflates operational CFP.
- [Experimental results] Experimental results section: The paper states that FPGAs can be more sustainable across the evaluated case studies but provides no validation data, real-world deployment metrics, or sensitivity analysis on how equivalent performance (throughput/latency) is maintained across platforms; this undermines the cross-platform claims if architectural differences are not fully accounted for in the CFP modeling.
minor comments (2)
- [Abstract] Abstract: A brief mention of the data sources or literature values used for baseline CFP estimates would improve transparency and allow readers to assess the modeling inputs.
- [Discussion] The manuscript would benefit from a dedicated subsection on limitations of the iso-performance assumption and how violations would quantitatively affect the sustainability thresholds.
Simulated Author's Rebuttal
We thank the referee for their constructive comments. We address each major comment point-by-point below and indicate where revisions will be made.
read point-by-point responses
-
Referee: [Abstract] Abstract: The sustainability conclusions rest on unvalidated iso-performance assumptions for the pairwise comparisons and on specific chosen uncertainty ranges for embodied CFP in design, manufacturing, reuse, and disposal phases; without shown equations, external calibration, or sensitivity bounds, the identified regimes (low-volume, frequently-changing workloads) are load-bearing on these internal parameter selections and could shift if FPGA resource overhead inflates operational CFP.
Authors: The iso-performance assumptions are explicitly modeled and stated as such, drawing on published benchmark data for throughput and latency equivalence across platforms. Uncertainty ranges for embodied CFP components are taken from semiconductor industry reports and prior studies, with sources cited in the methods. The GreenFPGA equations appear in Section 3 but will be made more prominent. In revision we will add the core equations to the abstract/introduction, include calibration references, and insert a sensitivity analysis subsection showing how parameter variations (including FPGA overhead effects on operational CFP) bound the low-volume and frequently-changing workload regimes. revision: yes
-
Referee: [Experimental results] Experimental results section: The paper states that FPGAs can be more sustainable across the evaluated case studies but provides no validation data, real-world deployment metrics, or sensitivity analysis on how equivalent performance (throughput/latency) is maintained across platforms; this undermines the cross-platform claims if architectural differences are not fully accounted for in the CFP modeling.
Authors: This is a modeling framework paper; real-world deployment metrics and new empirical validation therefore lie outside its scope. Architectural differences are accounted for through the iso-performance modeling that normalizes using established benchmark metrics. We will add a sensitivity analysis to the experimental results section that varies the performance-equivalence parameters and quantifies their effect on total CFP, thereby addressing the concern that unaccounted differences could alter the conclusions. revision: partial
- Real-world deployment metrics or direct empirical validation data, as the manuscript is a modeling study and no new hardware experiments or deployments were performed.
Circularity Check
No circularity: sustainability regimes derived from independent CFP modeling and explicit iso-performance assumptions
full rationale
The paper introduces GreenFPGA as a new estimation tool that aggregates CFP across design, manufacturing, reuse, operation, and disposal phases while propagating stated uncertainty ranges. The central claim identifies FPGA-favorable regimes only after applying pairwise iso-performance constraints and varying external parameters (lifetime, volume, workload diversity). No equations reduce the final sustainability comparison to a fitted parameter or self-citation by construction; the iso-performance equivalence is declared as an input assumption rather than derived from the model itself. Because the derivation chain remains self-contained against external benchmarks and does not rename or smuggle prior author results as forced conclusions, the analysis exhibits no load-bearing circular steps.
Axiom & Free-Parameter Ledger
free parameters (1)
- CFP uncertainty parameters
Reference graph
Works this paper leans on
-
[1]
Towards the Systematic Reporting of the Energy and Carbon Footprints of Machine Learning,
P. Henderson,et al., “Towards the Systematic Reporting of the Energy and Carbon Footprints of Machine Learning, ”Journal of Machine Learning Research, vol. 21, Jan. 2020
2020
-
[2]
The real climate and transformative impact of ICT: A critique of estimates, trends, and regulations,
C. Freitaget al., “The real climate and transformative impact of ICT: A critique of estimates, trends, and regulations, ”Patterns, vol. 2, 2021
2021
-
[3]
ACT: Designing Sustainable Computer Systems with an Architectural Carbon Modeling Tool,
U. Gupta,et al., “ACT: Designing Sustainable Computer Systems with an Architectural Carbon Modeling Tool, ” inProceedings of the ACM/IEEE International Symposium on Computer Architecture, p. 784–799, 2022
2022
-
[4]
ECO-CHIP: Estimation of Carbon Footprint of Chiplet-based Architectures for Sustainable VLSI,
C. C. Sudarshan,et al., “ECO-CHIP: Estimation of Carbon Footprint of Chiplet-based Architectures for Sustainable VLSI, ” inProceedings of the IEEE International Symposium on High Performance Computer Architecture, pp. 671–685, 2024
2024
-
[5]
ECO-CHIP,
C. C. Sudarshan and V. A. Chhabria, “ECO-CHIP, ” 2023. https://github.com/ASU-VDA-Lab/ECO-CHIP
2023
-
[6]
Sustainable Electronics: On the trail of Reconfigurable Computing,
L. Bossuet, “Sustainable Electronics: On the trail of Reconfigurable Computing, ”Sustainable Computing: Informatics and Systems, vol. 4, no. 3, pp. 196–202, 2014
2014
-
[7]
FPGA Product Support and EOL as Past Performance Indicators
Altera, “FPGA Product Support and EOL as Past Performance Indicators. ” https://cdrdv2-public.intel.com/650555/wp-01216-fpga-eol-indicators.pdf, 2016
2016
-
[8]
System level tradeoffs between ASIC and FPGA accelerators
T. Tan, “System level tradeoffs between ASIC and FPGA accelerators. ” http://dx.doi.org/10.26153/tsw/13814, 2021
-
[9]
GreenFPGA: Evaluating FPGAs as Environmentally Sustainable Computing Solutions,
C. Choppali Sudarshan,et al., “GreenFPGA: Evaluating FPGAs as Environmentally Sustainable Computing Solutions, ” inProceedings of the ACM/IEEE Design Automation Conference, 2024
2024
-
[10]
3D-Carbon: An Analytical Carbon Modeling Tool for 3D and 2.5D Integrated Circuits,
Y. Zhao,et al., “3D-Carbon: An Analytical Carbon Modeling Tool for 3D and 2.5D Integrated Circuits, ” inProceedings of the ACM/IEEE Design Automation Conference, 2024
2024
-
[11]
REFRESH FPGAs: Sustainable FPGA Chiplet Architectures,
P. Zhou,et al., “REFRESH FPGAs: Sustainable FPGA Chiplet Architectures, ” inProceedings of the International Green and Sustainable Computing Conference, 2024
2024
-
[12]
Life-Cycle Emissions of AI Hardware: A Cradle-To-Grave Approach and Generational Trends,
I. Schneider,et al., “Life-cycle Emissions of AI Hardware: A cradle-to-grave approach and generational trends, ”arXiv preprint arXiv:2502.01671, 2025
-
[13]
Understanding the Implications of Uncertainty in Embodied Carbon Models for Sustainable Computing,
A. Bhagavathula,et al., “Understanding the Implications of Uncertainty in Embodied Carbon Models for Sustainable Computing, ” inHotCarbon Workshop on Sustainable Computer Systems, 2024
2024
-
[14]
U-DUCT: Uncertainty-aware Dynamic Unified Carbon Modeling Tool for Datacenter Scheduling,
W. Guan,et al., “U-DUCT: Uncertainty-aware Dynamic Unified Carbon Modeling Tool for Datacenter Scheduling, ” inProceedings of the International Green and Sustainable Computing Conference, 2024
2024
-
[15]
GreenFPGA,
C. C. Sudarshan,et al., “GreenFPGA, ” 2023. https://github.com/ASU-VDA-Lab/GreenFPGA
2023
-
[16]
Beyond the Surface: The Necessity for Detailed Metrics in Corporate Sustainability Reports,
C. C. Sudarshan,et al., “Beyond the Surface: The Necessity for Detailed Metrics in Corporate Sustainability Reports, ” inProceedings of the International Green and Sustainable Computing Conference, pp. 145–150, 2024
2024
-
[17]
Environmental Responsibility Report,
Apple, “Environmental Responsibility Report, ” 2019. https://www.apple.com/environment/pdf/Apple_Environmental_Responsibility_Report_2019. pdf
2019
-
[18]
Corporate Social Responsibility Report,
TSMC, “Corporate Social Responsibility Report, ” 2023. https://www.tsmc.com/english/aboutTSMC/dc_csr_report
2023
-
[19]
The green transition of the IC industry,
L. Å. Ragnarsson,et al., “The green transition of the IC industry, ” 2022. https://www.imec-int.com/en/expertise/cmos-advanced/ sustainable-semiconductor-technologies-and-systems-ssts/stss-white-paper
2022
-
[20]
CarbonPATH: Carbon-Aware Pathfinding and Architecture Optimization for Chiplet-Based AI Systems,
C. C. Sudarshan,et al., “CarbonPATH: Carbon-aware pathfinding and architecture optimization for chiplet-based AI systems, ”arXiv preprint arXiv:2603.03878, 2026
-
[21]
Sustainable hardware specialization,
P. Dangi,et al., “Sustainable hardware specialization, ” inProceedings of the IEEE/ACM International Conference on Computer-Aided Design, 2025
2025
-
[22]
CarbonSet: A Dataset to Analyze Trends and Benchmark the Sustainability of CPUs and GPUs,
J. Hu,et al., “CarbonSet: A Dataset to Analyze Trends and Benchmark the Sustainability of CPUs and GPUs, ” inProceedings of the Great Lakes Symposium on VLSI, 2025
2025
-
[23]
DTCO including Sustainability: Power-Performance-Area-Cost-Environmental score (PPACE) Analysis for Logic Technolo- gies,
M. Garcia Bardon,et al., “DTCO including Sustainability: Power-Performance-Area-Cost-Environmental score (PPACE) Analysis for Logic Technolo- gies, ” inProceedings of the IEEE International Electron Devices Meeting, pp. 41.4.1–41.4.4, 2020
2020
-
[24]
The Dirty Secret of SSDs: Embodied Carbon,
S. Tannu and P. J. Nair, “The Dirty Secret of SSDs: Embodied Carbon, ”ACM SIGENERGY Energy Informatics Review, vol. 3, no. 3, pp. 4–9, 2023
2023
-
[25]
Towards Carbon-efficient LLM Life Cycle,
Y. L. Li,et al., “Towards Carbon-efficient LLM Life Cycle, ” inProceedings of the 3rd Workshop on Sustainable Computer Systems, 2024
2024
-
[26]
Chasing Carbon: The Elusive Environmental Footprint of Computing,
U. Gupta,et al., “Chasing Carbon: The Elusive Environmental Footprint of Computing, ”Proceedings of the IEEE/ACM International Symposium on Microarchitecture, vol. 42, no. 4, p. 37–47, 2022. Manuscript submitted to ACM Evaluating Computing Platforms for Sustainability 25
2022
-
[27]
Device Reliability Report,
AMD, “Device Reliability Report, ” 2025. https://docs.amd.com/r/en-US/ug116/SEU-and-Soft-Error-Rate-Measurements
2025
-
[28]
Calculating FIT for a Mission Profile,
TI, “Calculating FIT for a Mission Profile, ” 2015. https://www.ti.com/lit/an/spraby3/spraby3.pdf
2015
-
[29]
GPU depreciation could be the next big crisis coming for AI hyperscalers,
J. Martindale, “GPU depreciation could be the next big crisis coming for AI hyperscalers, ” 2025. https://www.tomshardware.com/gpu-depreciation
2025
-
[30]
Optimizing server refresh cycles with an aging Moore’s law,
R. Bashroush, “Optimizing server refresh cycles with an aging Moore’s law, ” 2020. https://journal.uptimeinstitute.com/ optimizing-server-refresh-cycles-with-an-aging-moores-law/
2020
-
[31]
Microsoft extends life of cloud servers from four to six years,
S. Sharwood, “Microsoft extends life of cloud servers from four to six years, ” 2022. https://www.theregister.com/2022/08/02/microsoft_server_life_ extension/
2022
-
[32]
AMD Supports Long Lifecycle FPGA Designs through 2040, 2045, and Beyond,
AMD, “AMD Supports Long Lifecycle FPGA Designs through 2040, 2045, and Beyond, ” 2026. https://www.amd.com/en/blogs/2024/ amd-supports-new-long-lifecycle-fpga-designs-thro.html
2040
-
[33]
Would You Innovate on Your Outdated Server Infrastructure?,
C. Drake, “Would You Innovate on Your Outdated Server Infrastructure?, ” 2025. https://www.delltechnologies.com/asset/en-in/products/servers/ industry-market/idc-server-refresh-white-paper.pdf
2025
-
[34]
Advanced Micro Devices (AMD) Corporate Responsibility,
Advanced Micro Devices, “Advanced Micro Devices (AMD) Corporate Responsibility, ” 2023. https://www.amd.com/content/dam/amd/en/documents/ corporate/cr/2022-23-amd-cr-report.pdf
2023
-
[35]
Microchip Sustainability Report,
Microchip, “Microchip Sustainability Report, ” 2023. https://ww1.microchip.com/downloads/aemDocuments/documents/corporate-responsibilty/ sustainability/2022-Microchip-Sustainability-Report.pdf
2023
-
[36]
NVIDIA Corporate Responsibility Report,
NVIDIA, “NVIDIA Corporate Responsibility Report, ” 2023. https://images.nvidia.com/aem-dam/Solutions/documents/ FY2023-NVIDIA-Corporate-Responsibility-Report-1.pdf
2023
-
[37]
Carbon intensity of electricity generation,
Our World in Data, “Carbon intensity of electricity generation, ” 2026. https://ourworldindata.org/grapher/carbon-intensity-electricity?tab=chart& country=USA~TWN#research-and-writing
2026
-
[38]
2019 Refinement to the 2006 IPCC Guidelines for National Greenhouse Gas Inventories,
J. Baasansuren,et al., “2019 Refinement to the 2006 IPCC Guidelines for National Greenhouse Gas Inventories, ”IPCC Switzerland, 2019
2019
-
[39]
The use and evaluation of yield models in integrated circuit manufacturing,
J. Cunningham, “The use and evaluation of yield models in integrated circuit manufacturing, ”IEEE Transactions on Semiconductor Manufacturing, vol. 3, no. 2, pp. 60–71, 1990
1990
-
[40]
’Better Yield on 5nm than 7nm’: TSMC Update on Defect Rates for N5
I. Cutress, “’Better Yield on 5nm than 7nm’: TSMC Update on Defect Rates for N5. ” https://www.anandtech.com/show/16028/ better-yield-on-5nm-than-7nm-tsmc-update-on-defect-rates-for-n5
-
[41]
Intel 14th Gen i9 Processor
Intel, “Intel 14th Gen i9 Processor. ” https://www.intel.com/content/www/us/en/products/docs/processors/core/core-14th-gen-desktop-brief.html
-
[42]
Apple expands the use of recycled materials across its products,
Apple, “Apple expands the use of recycled materials across its products, ” 2022. https://www.apple.com/newsroom/2022/04/ apple-expands-the-use-of-recycled-materials-across-its-products/
2022
-
[43]
Carbon Footprint: Recycling Compared to Not Recycling,
Georgette Kilgore, “Carbon Footprint: Recycling Compared to Not Recycling, ” 2023. https://8billiontrees.com/carbon-offsets-credits/ carbon-footprint-recycling/
2023
-
[44]
Waste Reduction Model,
“Waste Reduction Model, ” 2023. https://www.epa.gov/warm
2023
-
[45]
Understanding the impact of transistor-level BTI variability,
J. Fang and S. S. Sapatnekar, “Understanding the impact of transistor-level BTI variability, ” inIEEE International Reliability Physics Symposium, 2012
2012
-
[46]
Impact of Self-heating on Performance and Reliability in FinFET and GAAFET Designs,
V. A. Chhabria and S. S. Sapatnekar, “Impact of Self-heating on Performance and Reliability in FinFET and GAAFET Designs, ” inProceedings of the IEEE International Symposium on Quality Electronic Design, pp. 235–240, 2019
2019
-
[47]
2024 United States Data Center Energy Usage Report,
A. Shehabi,et al., “2024 United States Data Center Energy Usage Report, ” 2024. https://escholarship.org/uc/item/32d6m0d1#main
2024
-
[48]
TPU v4: An Optically Reconfigurable Supercomputer for Machine Learning with Hardware Support for Embeddings,
N. Jouppi,et al., “TPU v4: An Optically Reconfigurable Supercomputer for Machine Learning with Hardware Support for Embeddings, ” inProceedings of the ACM/IEEE International Symposium on Computer Architecture, 2023
2023
-
[49]
NVIDIA Datacenter Roadmaps,
Timothy Morgan, “NVIDIA Datacenter Roadmaps, ” 2023. https://www.nextplatform.com/2023/10/12/ nvidia-picks-up-the-pace-for-datacenter-roadmaps/
2023
-
[50]
Why Compete When You Can Work Together: FPGA-ASIC Integration for Persistent RNNs,
E. Nurvitadhi,et al., “Why Compete When You Can Work Together: FPGA-ASIC Integration for Persistent RNNs, ” inProceedings of the IEEE International Symposium on Field-Programmable Custom Computing Machines, pp. 199–207, 2019
2019
-
[51]
Comparative analysis of FPGA and GPU performance for machine learning-based track reconstruction at LHCb,
F. I. Giasemis,et al., “Comparative analysis of FPGA and GPU performance for machine learning-based track reconstruction at LHCb, ” in2025 23rd IEEE Interregional NEWCAS Conference, pp. 533–537, 2025
2025
-
[52]
A comparison of CPUs, GPUs, FPGAs, and massively parallel processor arrays for random number generation,
D. B. Thomas,et al., “A comparison of CPUs, GPUs, FPGAs, and massively parallel processor arrays for random number generation, ” inProceedings of the ACM/SIGDA International Symposium on Field Programmable Gate Arrays, p. 63–72, 2009
2009
-
[53]
HLSTransform: Energy-efficient LLaMA 2 inference on FPGAs via high level synthesis,
A. He,et al., “HLSTransform: Energy-efficient LLaMA 2 inference on FPGAs via high level synthesis, ”arXiv preprint arXiv:2405.00738, 2024
-
[54]
Performance Evaluation of FPGA, GPU, and CPU in FIR Filter Implementation for Semiconductor-Based Systems,
M. Arucu and T. Iliev, “Performance Evaluation of FPGA, GPU, and CPU in FIR Filter Implementation for Semiconductor-Based Systems, ”Journal of Low Power Electronics and Applications, vol. 15, no. 3, p. 40, 2025
2025
-
[55]
NVIDIA H100 Tensor Core GPU,
NVIDIA, “NVIDIA H100 Tensor Core GPU, ” 2024. https://www.nvidia.com/en-us/data-center/h100/
2024
-
[56]
Intel Agilex 7 FPGA and SoC FPGA I-Series
Intel, “Intel Agilex 7 FPGA and SoC FPGA I-Series. ” https://www.intel.com/content/www/us/en/products/details/fpga/agilex/7/i-series/products.html
-
[57]
Product Carbon Footprint (PCF) Summary for HGX H100,
NVIDIA, “Product Carbon Footprint (PCF) Summary for HGX H100, ” 2024. https://images.nvidia.com/aem-dam/Solutions/documents/ HGX-H100-PCF-Summary.pdf. Manuscript submitted to ACM
2024
discussion (0)
Sign in with ORCID, Apple, or X to comment. Anyone can read and Pith papers without signing in.