pith. machine review for the scientific record. sign in

arxiv: 2604.20644 · v2 · submitted 2026-04-22 · ✦ hep-ex

Recognition: unknown

Review of experimental studies of charmed meson decays at BESIII

Authors on Pith no claims yet

Pith reviewed 2026-05-09 22:31 UTC · model grok-4.3

classification ✦ hep-ex
keywords decaysdifferentbesiiiexperimentalhadronicmatrixmeasurementsprime
0
0 comments X

The pith

A review of BESIII charmed meson decay studies presents the most precise averages for |V_cs|, |V_cd|, D and D_s decay constants, and several hadronic form factors from combined experimental results.

A machine-rendered reading of the paper's core claim, the machinery that carries it, and where it could break.

Charmed mesons like D0, D+, and Ds+ contain a charm quark and are studied to understand the weak force and quark mixing. The BESIII experiment in China has been collecting data from electron-positron collisions tuned to produce these particles in large numbers. This review covers measurements of how often different decay modes occur, known as branching fractions. It also includes determinations of decay constants, which measure the probability of the meson decaying into leptons, and form factors that describe the momentum dependence in semileptonic decays to pions, kaons, and other light particles. Additional topics include tests of whether electrons and muons behave the same in these decays, measurements of strong phases in D0 decays, and searches for very rare processes that might indicate new particles or forces. By averaging results from BESIII and other experiments, the authors provide updated values for the CKM matrix elements |Vcs| and |Vcd|, which quantify the strength of charm to strange and charm to down quark transitions. These numbers are crucial for checking if the three-generation quark model is consistent.

Core claim

Based on existing results of (semi)leptonic D decays from all experiments, we have presented the most precise averages for the CKM matrix elements |V_cs|=0.9648±0.009±0.0036 and |V_cd|=0.2259±0.0014±0.0013, the decay constants of D+ and D+s f_{D^+}=(213.1±2.0±1.5) MeV and f_{D^+_s}=(253.2±1.2±1.6) MeV, as well as the hadronic form factors f^{D→K}_+(0)=0.7342±0.0007±0.0008, f^{D→π}_+(0)=0.6337±0.0053±0.0037, and others.

Load-bearing premise

The averaging procedure assumes that systematic uncertainties from different experiments are correctly estimated, uncorrelated where not specified, and that the selected measurements form a representative and unbiased sample of the true values.

Figures

Figures reproduced from arXiv: 2604.20644 by Hailong Ma, Xiang Pan, Yijia Zeng.

Figure 1
Figure 1. Figure 1: The M2 miss distributions of the accepted candidates for (left) D + → µ +νµ [34] as well as (middle) π-like and (right) µ-like candidates for D + → τ +(→ π +ν¯τ )ντ [75]. correspond to B(D+ → τ +ντ ) = (9.9 ± 1.1 ± 0.5) × 10−4 [75] [PITH_FULL_IMAGE:figures/full_fig_p006_1.png] view at source ↗
Figure 3
Figure 3. Figure 3: Comparison of |Vcd| from experimental measurements with leptonic D decays (CLEO-c [73] and BESIII [34, 75]) and semileptonic D decays (Belle [81], BaBar [82], CLEO￾c [83, 87] and BESIII [84–86, 88, 89]) as well as HFLAV23 [78] and CKMfitter [39]. The green band is the ±1σ region of CKMfitter and the yellow band denotes the ±1σ region of the result averaged over all measurements with (semi)leptonic D decays… view at source ↗
Figure 2
Figure 2. Figure 2: shows a comparison of fD+ from different experiments and recent LQCD calculations, and [PITH_FULL_IMAGE:figures/full_fig_p006_2.png] view at source ↗
Figure 5
Figure 5. Figure 5: The BDT, MM2 or E tot extra,γ distributions of the accepted candidates for D + s → τ +(→ π +ν¯τ )ντ [108], D + s → τ +(→ ρ(770)+ν¯τ )ντ [109], D + s → τ +(→ e +νeν¯τ )ντ [110], and D + s → τ +(→ µ +νµν¯τ )ντ [111], which are combined from all used tag modes and energy points. Two independent measurements of the branching fractions of D+ s → ℓ +νℓ (ℓ = µ or τ ) were also performed by using 1.3k of tagged D−… view at source ↗
Figure 7
Figure 7. Figure 7: Comparison of |Vcs| from experimental results mea￾sured with semileptonic Ds decays (Belle1 [81], BaBar1 [117], CLEO-c1 [83], and BESIII1,2,3 [31, 32, 114–116, 118]) and leptonic D decays (CLEO-c2 [99, 104, 105], BaBar2 [102], Belle2 [101], and BESIII4,5 [40, 108–113], in which the combined D + s → τ +ντ result of CLEO-c2 is based on [99, 104, 105]; the combined D + s → τ +ντ result of BESIII4 is based on … view at source ↗
Figure 6
Figure 6. Figure 6: Comparison of fD+ s from experimental measurements of CLEO-c1,2 [99, 104, 105], BaBar1,2 [102], Belle1,2 [101], and BESIII1,2 [40, 108–113], LQCD calculations of ETM [79] and Fermilab and MILC [80] as well as HFLAV23 [78] and FLAG24 [77]. The combined D + s → τ +ντ result of CLEO-c is based on [99, 104, 105]; the combined D + s → τ +ντ result of BESIII is based on [108–113]; and the combined D + s → µ +νµ … view at source ↗
Figure 8
Figure 8. Figure 8: The M2 miss distributions of the accepted candidates for D ∗+ s → e +νe [136]. In addition, the first searches for D∗+ → e +νe and D∗+ → µ +νµ were also presented with 0.33 millions of tagged D∗− mesons via e +e − → D∗+D∗− from 6.3 fb−1 of data at 4.178-4.226 GeV [142]. No significant signals were obtained, the upper limits on their decay branching [PITH_FULL_IMAGE:figures/full_fig_p009_8.png] view at source ↗
Figure 9
Figure 9. Figure 9: Comparison of fD∗+ s reported by BESIII [136] as well as LQCD calculations of HPQCD [133], LPTHE [137, 138], UKQCD [139], ETM [140], and χQCD [141]. The green band is the ±1σ region of χQCD and the yellow band denotes the ±1σ region of the BESIII result [136]. fractions are set to be B(D∗+ → e +νe) < 1.1 × 10⁻⁵ and B(D∗+ → µ +νµ) < 4.3 × 10⁻⁶ at the 90% confidence level, respectively. IV. SEMILEPTONIC DECA… view at source ↗
Figure 10
Figure 10. Figure 10: Definitions of the angular variables for [PITH_FULL_IMAGE:figures/full_fig_p011_10.png] view at source ↗
Figure 11
Figure 11. Figure 11: Simultaneous fit to the measured partial decay rates (top) and forward-backward asymmetries (middle) of [PITH_FULL_IMAGE:figures/full_fig_p014_11.png] view at source ↗
Figure 12
Figure 12. Figure 12: The confidence regions of (a) the scalar combination of complex Wilson coefficients [PITH_FULL_IMAGE:figures/full_fig_p015_12.png] view at source ↗
Figure 13
Figure 13. Figure 13: (Top row) Simultaneous fits to the differential decay [PITH_FULL_IMAGE:figures/full_fig_p015_13.png] view at source ↗
Figure 14
Figure 14. Figure 14: (a,b) Fits to ∆Γi msr. (c,d) The measured Rµ/e combining the two signal channels in each q 2 interval [116]. (e,f) Comparisons of the measured AFB and theoretical predications [10]. different experiments and those predicted by different theoretical calculations are presented in Figs. 16 and 17, respectively. (0) D→K + f 0 0.2 0.4 0.6 0.8 Average 0.7342±0.0007±0.0008 BESIII 0.7343±0.0007±0.0008 CLEO-c 0.73… view at source ↗
Figure 15
Figure 15. Figure 15: Comparison of f D→K + (0) from experimental measurements of BaBar [117], Belle [81], CLEO-c [83], and BESIII [31, 32, 118] as well as recent LQCD calculations of ETM [216], HPQCD [217], and Fermilab and MILC [218] as well as HFLAV23 [78] and FLAG24 [77]. The green band is the ±1σ region of the result of Fermilab and MILC [218] and the yellow band denotes the ±1σ region of the result averaged over all meas… view at source ↗
Figure 17
Figure 17. Figure 17: Comparison of f Ds→η ′ + (0) from experimental mea￾surements of BESIII [114–116] and theoretical calculations of RQM [10], CLFQM [219], LFQM1 [220], CCQM1 [222], CCQM2 [223], CQM [224], LCSR1 [226], LCSR2 [227], LCSR3 [228], LCSR4 [229], LCSR5 [230], LCSR6 [231], LCSR7 [232], LCSR8 [233], and LQCD [234]. The green band is the ±1σ region of averaged theoretical calculations [235] and the yellow band denote… view at source ↗
Figure 18
Figure 18. Figure 18: Fits to the partial decay rates of (left) [PITH_FULL_IMAGE:figures/full_fig_p018_18.png] view at source ↗
Figure 19
Figure 19. Figure 19: ∆Γ0(+) i /∆q 2 of D 0(+) → π −(0)ℓ +νℓ (top) and R 0(+) LFU (bottom) in various q 2 bins [236]. ) 2 q 2 (GeV 0.0 0.5 1.0 1.5 2.0 ) -2 GeV -1 (ns 2 q ∆ / Γ ∆ 2 4 6 e ν + e 0 → K + Data: Ds simple pole modified pole z series (2 par.) (a) ) 2 q 2 (GeV 0.0 0.5 1.0 1.5 2.0 ) -2 GeV -1 (ns 2 q ∆ / Γ ∆ 2 4 6 µ ν + µ 0 → K + Data: Ds (b) ) 2 q 2 (GeV 0.0 0.5 1.0 1.5 2.0 ) 2 (q + f 1.0 1.5 (c) LQCD ) 2 q 2 (GeV 0.… view at source ↗
Figure 20
Figure 20. Figure 20: Fits to the partial decay rates for (a) D + s → K0 e +νe and (b) D + s → K0µ +νµ [89]. (c) Projection onto f Ds→K0 + (q 2 ), and the hatched curves show the LQCD prediction [218]. (d) The measured R µ/e K0 (q 2 ) in various q 2 intervals. with results shown in [PITH_FULL_IMAGE:figures/full_fig_p018_20.png] view at source ↗
Figure 21
Figure 21. Figure 21: (a) Simultaneous fit to partial decay rates of [PITH_FULL_IMAGE:figures/full_fig_p019_21.png] view at source ↗
Figure 22
Figure 22. Figure 22: (a, b) Fits to ∆Γi msr, (c) projections to f η ′ + (q 2 ), and (d) the measured Rµ/e in each q 2 interval. The yellow bands are the ±1σ intervals of the fitted parameters [88]. (0) D→π + f -0.5 0 0.5 Average 0.6337±0.0053±0.0037 BESIII 0.6328±0.0067±0.0044 CLEO-c 0.6493±0.0133±0.0049 Belle 0.6301±0.0200±0.0303 BaBar 0.6110±0.0169±0.0107 Fermilab and MILC 0.6300±0.0051 HPQCD 0.666±0.020±0.021 ETM 0.612±0.0… view at source ↗
Figure 23
Figure 23. Figure 23: Comparison of f D→π + (0) from experimental measurements of BaBar [82], Belle [81], CLEO-c [83], and BESIII [84, 207] and LQCD calculations of ETM [216], HPQCD [242], and Fermilab and MILC [218] as well as HFLAV23 [78] and FLAG24 [77]. The green band is the ±1σ region of the result of Fermilab and MILC [218] and the yellow band denotes the ±1σ region of the result averaged over all measurements of D → πℓ+… view at source ↗
Figure 25
Figure 25. Figure 25: Comparison of f D→η ′ + (0) from experimental measurements of BESIII [88] as well as theoretical calculations of CLFQM [219], RQM [10], CCQM1 [222], CCQM2 [223], LCSR2 [227], LCSR4 [229], LCSR5 [230], LCSR6 [231], LCSR7 [232], and LCSR9 [240]. The green band is the ±1σ region of the averaged result of theoretical calculations [235] and the yellow band denotes the ±1σ region of the BESIII result [88]. are … view at source ↗
Figure 26
Figure 26. Figure 26: Comparison of f Ds→K0 + (0) from experimental measurements of BESIII [89, 115] and theoretical calculations of CQM [224], LCSR1 [243], LCSR2 [244]. CLFQM1 [245], CLFQM2 [246], CCQM [222], RQM [10], hQCD [247], and LQCD [218]. The green band is the ±1σ region of the LQCD result [218] and the yellow band denotes the ±1σ region of the result averaged over all measurements of D + s → K0 ℓ +νℓ. the first time … view at source ↗
Figure 27
Figure 27. Figure 27: The projections of amplitude analysis for [PITH_FULL_IMAGE:figures/full_fig_p023_27.png] view at source ↗
Figure 28
Figure 28. Figure 28: The projections of amplitude analysis for (top) [PITH_FULL_IMAGE:figures/full_fig_p023_28.png] view at source ↗
Figure 29
Figure 29. Figure 29: Measured observables ⟨Ai⟩, ⟨Si⟩, Rµ/e and the CP asymmetry for D + → K¯ ∗ (892)0 ℓ +νℓ in different q 2 regions with 0.8 < mK¯ ∗(892)0 < 1.0 GeV2 /c4 . The e + (µ +) results are shown in blue (red). The horizontal lines and shaded bands represent the mean value and 1 standard deviation across full q 2 range [249].. 0.8 1 1.2 1.4 )2 - (GeV/c π 0 K M −2 10 −1 10 1 10 2 10 3 10 4 10 (a) Events/0.02 GeV 0.8 1… view at source ↗
Figure 30
Figure 30. Figure 30: The projections of amplitude analysis for (left) [PITH_FULL_IMAGE:figures/full_fig_p024_30.png] view at source ↗
Figure 31
Figure 31. Figure 31: The projections of amplitude analysis for [PITH_FULL_IMAGE:figures/full_fig_p025_31.png] view at source ↗
Figure 32
Figure 32. Figure 32: The projections of amplitude analysis for [PITH_FULL_IMAGE:figures/full_fig_p025_32.png] view at source ↗
Figure 33
Figure 33. Figure 33: Comparisons of the (left) rV , (middle) r2, and (right) A1(0) for D 0(+) → K¯ ∗ measured by experimental measurements (D + → K¯ ∗ from E653 [260], E687 [174], E791 [261], E791 [262], BEAT [263], FOCUS1 [264], BaBar [151], BESIII1 (D + → K−π +e +νe based on 2.93 fb−1 of data at 3.773 GeV) [152], BESIII2 (D + → K0 Sπ 0 ℓ +νℓ based on 20.3 fb−1 of data at 3.773 GeV) [249]; and D 0 → K∗ (892)− from FOCUS2 [16… view at source ↗
Figure 34
Figure 34. Figure 34: The projections of amplitude analysis for [PITH_FULL_IMAGE:figures/full_fig_p026_34.png] view at source ↗
Figure 35
Figure 35. Figure 35: Comparisons of the (left) rV and (middle) r2 for D + s → ϕ measured by experimental measurements of FOCUS [272], BaBar [198], and BESIII [266] as well as theoretical calculations of CQM [219], HMχT [257], HQEFT [243], SCI [267], LCSR [268], CCQM [223], CLFQM [221], LFQM [269], LQCD1 [270], and LQCD2 [271]. The green band is the ±1σ region of the averaged LQCD1,2 result [270, 271] and the yellow band denot… view at source ↗
Figure 36
Figure 36. Figure 36: The projections of amplitude analysis for [PITH_FULL_IMAGE:figures/full_fig_p027_36.png] view at source ↗
Figure 37
Figure 37. Figure 37: Comparisons of the (left) rV and (right) r2 for D + → ω measured by BESIII [273] and theoretical calculations of HMχT [257], LFQM [221], LCSR [275], CCQM [222], and DMQCD [276]. The green band is the ±1σ region of the CCQM result [222] and the yellow band denotes the ±1σ region of the BESIII result [273] [PITH_FULL_IMAGE:figures/full_fig_p027_37.png] view at source ↗
Figure 38
Figure 38. Figure 38: The projections of amplitude analysis for (top) [PITH_FULL_IMAGE:figures/full_fig_p028_38.png] view at source ↗
Figure 39
Figure 39. Figure 39: Comparisons of the (left) rV and (right) r2 for D → ρ measured by CLEO-c [186], BESIII1 [277] (D 0 → π −π 0 e +νe and D + → π −π +e +νe with 2.93 fb−1 of data at 3.773 GeV), BESIII2 [280] (D 0 → π −π 0 e +νe with 7.9 fb−1 of data at 3.773 GeV) as well as theoretical calculations of HMχT [257], LCSR [243], LFQM [221], CQM [222], and CCQM [224]. The green band is the ±1σ region of the CCQM result [224] and … view at source ↗
Figure 40
Figure 40. Figure 40: Comparisons of the (left) rV and (right) r2 for D + s → K∗ measured by BESIII [237] and theoretical calculations of QRM [10], χUA [257], CCQM [222, 223], CQM [224], and LCSR [243]. The green band is the ±1σ region of the LCSR result [243] and the yellow band denotes the ±1σ region of the BESIII result [237]. ) 4 c-2 GeV -1 (ns 2 q ∆ / Γ∆ ) 4 /c 2 q 2 (GeV ) 2 (q + f ) 4 /c 2 q 2 (GeV 0.0 0.5 1.0 1.5 2.0 0… view at source ↗
Figure 41
Figure 41. Figure 41: (a) The partial decay rates of D + → f0(500)ℓ +νℓ and (b) projections to f D→f0(500) + (q 2 ) [279]. 0 0.5 1 0 2 4 6 8 10 ) 4 /c 2 q 2 (GeV ) 4 c/ 2 /GeV -1 (ns 2 /dq Γ d (a) Data Fit 0 0.5 1 0.3 0.4 0.5 0.6 0.7 0.8 ) 4 /c 2 q 2 (GeV ) 2 (q + 0 f f (b) [PITH_FULL_IMAGE:figures/full_fig_p029_41.png] view at source ↗
Figure 42
Figure 42. Figure 42: (a) The fit to the differential decay rate as a function [PITH_FULL_IMAGE:figures/full_fig_p029_42.png] view at source ↗
Figure 43
Figure 43. Figure 43: Projections of the 2-D fit on (left) Mηπ and (right) U for (a)(b) D 0 → ηπ−e +νe and (c)(d) D + → ηπ0 e +νe [283]. 0 0.2 0.4 0.6 0 0.2 0.4 0.6 0.8 ) 4 /c 2 q 2 (GeV ) 4 c / 2 /GeV -1 (ns 2 q /d Γ d (a) 0 0.2 0.4 0.6 0 0.1 0.2 0.3 ) 4 /c 2 q 2 (GeV | cd V)| 2 q ( 0 a+ f (b) [PITH_FULL_IMAGE:figures/full_fig_p029_43.png] view at source ↗
Figure 46
Figure 46. Figure 46: Comparisons of hadronic form factors of D transition into scalar mesons: f D→f0(500) + (0) measured by BESIII [279] and theoretical calculations of LCSR [291], CCQM [292], and chPT [293]. The green band is the ±1σ region of the CCQM result [292] and the yellow band denotes the ±1σ region of the BESIII result [279]. (0) (980) 0 D→a + f -2 -1 0 1 BESIII 0.559±0.056±0.013 CCQM 0.55±0.02 Ads/QCD 0.72±0.09 3 L… view at source ↗
Figure 47
Figure 47. Figure 47: Comparisons of hadronic form factors of D transition into scalar mesons: f D→a0(980) + (0) measured by BESIII [284] and theoretical calculations of SU(3)-flavor [291], LCSR1 [294], LCSR2 [295], LCSR3 [296], Ads/QCD [297], and CCQM [285]. The green band is the ±1σ region of the CCQM result [285] and the yellow band denotes the ±1σ region of the BESIII result [284]. D+ → K¯ 1(1270)0 e +νe and D0 → K1(1270)−… view at source ↗
Figure 48
Figure 48. Figure 48: The projections of the amplitude analysis for [PITH_FULL_IMAGE:figures/full_fig_p031_48.png] view at source ↗
Figure 50
Figure 50. Figure 50: The 2-D fits to the accepted candidates for (top) D 0 → b1(1235)−e +νe and (bottom) D + → b1(1235)0 e +νe [311]. semileptonic decays D+ s → K1(1270)0 e +νe and D+ s → b1(1235)0 e +νe [312] as well as D+ s → f1(1420)e +νe and D+ s → f1(1285)e +νe [313] were also searched for the first time. The first evidence for the decay D+ s → f1(1420)e +νe is found with a statistical significance of 3.4σ, and its produ… view at source ↗
Figure 51
Figure 51. Figure 51: The c (′) i /s(′) i parameters determined without constraints (red), with constraints (green) and predicted by the amplitude models [342] (blue) under the modified optimal binning scheme. See Ref. [341] for details. important for the γ measurement. Their sensitivity to the γ in analyses of B → Dh decays depends on knowledge of the hadronic parameters: the coherence factor RS, the amplitude ratio r S D, an… view at source ↗
Figure 52
Figure 52. Figure 52: Scans of ∆χ 2 in the global (RK3π, δ K3π D ) and (RKππ0 , δ Kππ0 D ) parameter space, where the filled color contours represent the current results and the various black lines indicate the previous BESIII measurements [350]. The ∆χ 2 = 2.30, 6.18, and 11.83 contours correspond to the 68.3%, 95.4%, and 99.7% confidence levels in the 2-D parameter space, respectively. See Ref. [353] for details. In addition… view at source ↗
Figure 53
Figure 53. Figure 53: The ratios of efficiency-corrected yields observed in data to those expected in the absence of correlations and mixing [PITH_FULL_IMAGE:figures/full_fig_p037_53.png] view at source ↗
Figure 54
Figure 54. Figure 54: (Left) The fit results for (ci, si) in each phase-space bin [364], with error bars corresponding to 68% confidence intervals. Only the statistical uncertainties are considered. The model predictions are shown as blue diagonal crosses, labelled with their bin numbers. The bin numbers are shown above and to the right of the measurements, and below and to the left of the model predictions. (right) The (solid… view at source ↗
Figure 55
Figure 55. Figure 55: Fits to the MK+K− spectra of the candidate events for (a) D + → ϕX and (b) D 0 → ϕX in the MBC signal region, (c) D + → ϕX and (d) D 0 → ϕX in the MBC sideband region [382]. respectively [383]. The results of fits to the Mπ+π− distributions are shown in [PITH_FULL_IMAGE:figures/full_fig_p038_55.png] view at source ↗
Figure 56
Figure 56. Figure 56: Fits to the MBC distributions of the double-tag events for D + → K0 SX and D 0 → K0 SX in data [383]. The top and bottom plots correspond to events with Mπ+π− in the K0 S signal and sideband regions, respectively. 2.93 fb−1 of data at 3.773 GeV [386], the branching fractions for the inclusive decays D+ s → 2π +π −X, D0 → 2π +π −X, and D+ → 2π +π −X were measured for the first time to be B(D+ s → 2π +π −X)… view at source ↗
Figure 58
Figure 58. Figure 58: Distributions of (left column) Mtag BC versus Msig BC and the projections on (middle column) Mtag BC and (right column) Msig BC of the 2-D fits to the double-tag candidate events for (top row) D + → K+2π 0 and (bottom row) D + → K+π 0 η [425] [PITH_FULL_IMAGE:figures/full_fig_p040_58.png] view at source ↗
Figure 59
Figure 59. Figure 59: Fits to the Umiss distributions of the double-tag candidate events for (a) D 0 → K+π −, (b) D 0 → K+2π −π +, (c) D 0 → K+π −π 0 , (d) D 0 → K+π −2π 0 , (e) D 0 → K+π −η and (f) D 0 → K+π −π 0 η in data [427]. In each plot pair, the left panel is D¯ 0 → K+e −ν¯e tags and the right one is D¯ 0 → K+µ −ν¯µ tags. - π + π + → K + D Fit result Data Signal BKG 0 200 400 600 800 - K + K + → K + D Fit result Data S… view at source ↗
Figure 60
Figure 60. Figure 60: Fits to the Msig BC distributions of the double-tag candidates for DCS D + decays in data [427] [PITH_FULL_IMAGE:figures/full_fig_p041_60.png] view at source ↗
Figure 61
Figure 61. Figure 61: Fits to the 3π mass spectra for (a) D + → π +π −π 0π + and (b) D 0 → π +π −2π 0 in the signal region [524]. 2. Two-body D decays at BESIII Using 2.93 fb−1 of data at 3.773 GeV with the double￾tag method, the SCS decays D+ → ωπ+ and D0 → ωπ0 are observed with statistical significances of 5.5σ and 4.1σ, respectively [524]. The results of fits to the M3π distributions are shown in [PITH_FULL_IMAGE:figures/f… view at source ↗
Figure 62
Figure 62. Figure 62: Fits to the MM2 distributions of the accepted candidate events of D 0 → K0 Lϕ, D 0 → K0 Lη, D 0 → K0 Lω, and D 0 → K0 Lη ′ in data [525]. and (8.24 ± 0.21 ± 0.30) × 10−4 [528], based on 576 and 6.3k single-tag signal events, respectively. Meanwhile, with 17.5k, 3.3k, and 102 single-tag signal events, the branching fractions of D+ → ϕπ+, D0 → ϕπ0 , and D0 → ϕη are determined to be B(D0 → ϕπ0 ) = (1.168±0.0… view at source ↗
Figure 63
Figure 63. Figure 63: Fits to the MBC distributions of the single-tag (left) D + and (right) D 0 candidate events [536]. ) (%) + π - →K 0 B(D 0 1 2 3 4 PDG fit 3.945±0.030 PDG average 3.909±0.034 BESIII 3.883±0.006±0.051 CLEO-c 3.934±0.021±0.061 CLEOII 3.82±0.07±0.12 BaBar 4.007±0.037±0.072 2 ALEPH 3.90±0.09±0.12 1 ALEPH 3.62±0.34±0.44 ARGUS [440] 3.41±0.12±0.28 [438] [439] [441] [436] [446] [536] [PITH_FULL_IMAGE:figures/ful… view at source ↗
Figure 64
Figure 64. Figure 64: Comparison of branching fraction of D 0 → K−π + measured by BESIII [536], CLEO-c [446], CLEOII [436], BaBar [441], ALEPH1 [439], ALEPH2 [438], and AR￾GUS [440]. The yellow band denotes the ±1σ region of the PDG global fit result [39]. | θω |cos 0 0.5 1 Events 0 500 1000 1500 2000 | K |cosθ 0.5 1 Events 0 500 1000 1500 2000 [PITH_FULL_IMAGE:figures/full_fig_p046_64.png] view at source ↗
Figure 66
Figure 66. Figure 66: Projections on Msig BC of the 2-D fits to the double￾tag candidate events for D 0 → K−π +η, K0 Sπ 0 η, K+K−η, K0 SK0 Sη, K−π +π 0 η, K0 Sπ +π −η, K0 S2π 0 η, and π +π −π 0 η; D + → K0 Sπ +η, K0 SK+η, K−2π +η, K0 Sπ +π 0 η, 2π +π −η, and π +2π 0 η in data [544]. Also with 2.93 fb−1 of data at 3.773 GeV and the double-tag method, more studies of SCS D decays came from Refs. [547–550]. Reference [547] made t… view at source ↗
Figure 67
Figure 67. Figure 67: Projections of Msig BC of the 2-D fits to the double-tag candidate events for D 0 → π +π −π 0 , π +π −2π 0 , π +π −2η, 4π 0 , 3π 0 η, 2π +2π −π 0 , 2π +2π −η, π +π −3π 0 , 2π +2π −2π 0 , and D + → 2π +π −, π +2π 0 , 2π +π −π 0 , π +3π 0 , 3π +2π −, 2π +π −2π 0 , 2π +π −π 0 η, π +4π 0 , π +3π 0 η, 3π +2π −π 0 , 2π +π −3π 0 in data [550]. reports the first observation of D+ → 2ηπ+ as well as the improved me… view at source ↗
Figure 68
Figure 68. Figure 68: Comparison of branching fraction of D + s → K+K−π + measured by BESIII [553], CLEO-c [463], BaBar [102], and Belle [101]. The yellow band denotes the ±1σ region of the PDG global fit result [39]. and the background function with the corresponding fraction as the coefficient. The signal amplitude is parameterized with the isobar formulation in the covariant tensor formalism [565]. The total signal amplitud… view at source ↗
Figure 69
Figure 69. Figure 69: The projections of the amplitude analysis fit for [PITH_FULL_IMAGE:figures/full_fig_p049_69.png] view at source ↗
Figure 70
Figure 70. Figure 70: The projections of the amplitude analysis fit for [PITH_FULL_IMAGE:figures/full_fig_p050_70.png] view at source ↗
Figure 71
Figure 71. Figure 71: The projections of the amplitude analysis fit for [PITH_FULL_IMAGE:figures/full_fig_p051_71.png] view at source ↗
Figure 72
Figure 72. Figure 72: The projections of the amplitude analysis fit for [PITH_FULL_IMAGE:figures/full_fig_p051_72.png] view at source ↗
Figure 73
Figure 73. Figure 73: Comparison of the results for Rϕ measured by BESIII [619] and the HBC [606–608, 620], OLYA [605], CMD2 [609], and CMD3 [610] experiments. Above the dotted line are the theoretical calculations [601, 603, 604, 614], below are the experimental results. The green band is the ±1σ region of the DUBNICKA result [614] and the yellow band denotes the ±1σ region of the BESIII result [619]. about 4σ. This indicates… view at source ↗
Figure 74
Figure 74. Figure 74: The projections of the amplitude analysis fit for [PITH_FULL_IMAGE:figures/full_fig_p052_74.png] view at source ↗
Figure 75
Figure 75. Figure 75: The projections of the amplitude analysis fits of [PITH_FULL_IMAGE:figures/full_fig_p052_75.png] view at source ↗
Figure 76
Figure 76. Figure 76: The projections of the amplitude analysis fit for [PITH_FULL_IMAGE:figures/full_fig_p053_76.png] view at source ↗
Figure 77
Figure 77. Figure 77: The projections of the amplitude analysis fit for [PITH_FULL_IMAGE:figures/full_fig_p053_77.png] view at source ↗
Figure 78
Figure 78. Figure 78: The projections of the amplitude analysis fit [PITH_FULL_IMAGE:figures/full_fig_p053_78.png] view at source ↗
Figure 79
Figure 79. Figure 79: The projections of the amplitude analysis fit of [PITH_FULL_IMAGE:figures/full_fig_p055_79.png] view at source ↗
Figure 80
Figure 80. Figure 80: The projections of the amplitude analysis fit of [PITH_FULL_IMAGE:figures/full_fig_p055_80.png] view at source ↗
Figure 1
Figure 1. Figure 1: Projections 3 ) 2 (GeV/c η 0 Mπ 0.8 1 1.2 1.4 ) 2 c Events / (22 MeV/ 0 200 400 600 (b) Data Total fit Background 0 S a0 (980)K (892)η * K η S (Kπ) [PITH_FULL_IMAGE:figures/full_fig_p056_1.png] view at source ↗
Figure 82
Figure 82. Figure 82: (Left) The Dalitz plot as well as the projections of the amplitude analysis fit for [PITH_FULL_IMAGE:figures/full_fig_p056_82.png] view at source ↗
Figure 83
Figure 83. Figure 83: The projections of the amplitude analysis fit for [PITH_FULL_IMAGE:figures/full_fig_p056_83.png] view at source ↗
Figure 84
Figure 84. Figure 84: The projections of the amplitude analysis fit of [PITH_FULL_IMAGE:figures/full_fig_p058_84.png] view at source ↗
Figure 85
Figure 85. Figure 85: (a) The Dalitz plot as well as the projections of the amplitude analysis fit for [PITH_FULL_IMAGE:figures/full_fig_p058_85.png] view at source ↗
Figure 86
Figure 86. Figure 86: The projections of the amplitude analysis fit for [PITH_FULL_IMAGE:figures/full_fig_p059_86.png] view at source ↗
Figure 87
Figure 87. Figure 87: The Dalitz plots as well as the projections of the amplitude analysis fits on two-body particle mass distributions of [PITH_FULL_IMAGE:figures/full_fig_p059_87.png] view at source ↗
Figure 88
Figure 88. Figure 88: (Left) The Dalitz plot of the data as well as the projections of the amplitude analysis fit of [PITH_FULL_IMAGE:figures/full_fig_p060_88.png] view at source ↗
Figure 89
Figure 89. Figure 89: The projections of the amplitude analysis fit of [PITH_FULL_IMAGE:figures/full_fig_p062_89.png] view at source ↗
Figure 90
Figure 90. Figure 90: The projections of the amplitude analysis fit of [PITH_FULL_IMAGE:figures/full_fig_p062_90.png] view at source ↗
Figure 91
Figure 91. Figure 91: The projections of the amplitude analysis fit of [PITH_FULL_IMAGE:figures/full_fig_p063_91.png] view at source ↗
Figure 92
Figure 92. Figure 92: The projections of the amplitude analysis fit of [PITH_FULL_IMAGE:figures/full_fig_p063_92.png] view at source ↗
Figure 93
Figure 93. Figure 93: The projections of the amplitude analysis fit of [PITH_FULL_IMAGE:figures/full_fig_p064_93.png] view at source ↗
Figure 94
Figure 94. Figure 94: The projections of the amplitude analysis fit of [PITH_FULL_IMAGE:figures/full_fig_p065_94.png] view at source ↗
Figure 95
Figure 95. Figure 95: The projections of the amplitude analysis fit of [PITH_FULL_IMAGE:figures/full_fig_p065_95.png] view at source ↗
Figure 96
Figure 96. Figure 96: The projections of the amplitude analysis fit of [PITH_FULL_IMAGE:figures/full_fig_p066_96.png] view at source ↗
Figure 97
Figure 97. Figure 97: The projections of the amplitude analysis fit of [PITH_FULL_IMAGE:figures/full_fig_p066_97.png] view at source ↗
Figure 98
Figure 98. Figure 98: The projections of the amplitude analysis fit of [PITH_FULL_IMAGE:figures/full_fig_p068_98.png] view at source ↗
Figure 99
Figure 99. Figure 99: The projections of the amplitude analysis fit of [PITH_FULL_IMAGE:figures/full_fig_p068_99.png] view at source ↗
Figure 100
Figure 100. Figure 100: The projections of the amplitude analysis fit of [PITH_FULL_IMAGE:figures/full_fig_p069_100.png] view at source ↗
Figure 101
Figure 101. Figure 101: The projections of the amplitude analysis fit of [PITH_FULL_IMAGE:figures/full_fig_p069_101.png] view at source ↗
Figure 103
Figure 103. Figure 103: The projections of the amplitude analysis fit of (left) [PITH_FULL_IMAGE:figures/full_fig_p070_103.png] view at source ↗
Figure 104
Figure 104. Figure 104: The projections of the amplitude analysis fit of [PITH_FULL_IMAGE:figures/full_fig_p071_104.png] view at source ↗
Figure 105
Figure 105. Figure 105: The projections of the amplitude analysis fit of [PITH_FULL_IMAGE:figures/full_fig_p071_105.png] view at source ↗
Figure 106
Figure 106. Figure 106: The distributions of Msig BC of accepted candidates for D 0,+ → he+e − and D 0,+ → hh′ e +e − in data [796]. The solid histograms are data, the hatched ones are the simulated background events, and the black dashed lines denote the signal region. branching fraction of D0 → D0π 0 relative to D∗0 → D0γ. In addition, CLEOII [805, 809] and ARGUS [806] reported the branching fraction of D∗+ → D0π +; and CLEOI… view at source ↗
Figure 107
Figure 107. Figure 107: Fits to the M(D + s ) distributions of accepted candidates for D + s → he+e − and D + s → hh′ e +e − in data [797]. data at √ s = 4.178 GeV. This is the first experimental determination of the spin and parity of the D∗ (s) mesons, which are the cornerstone for the exploration of the properties of heavier charm and beauty mesons [824]. Based on 3.19 fb−1 of data at √ s = 4.178 GeV. the electromagnetic Dal… view at source ↗
read the original abstract

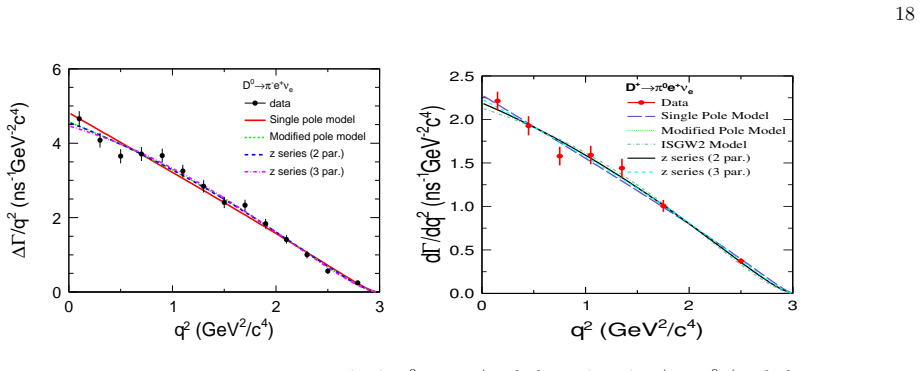
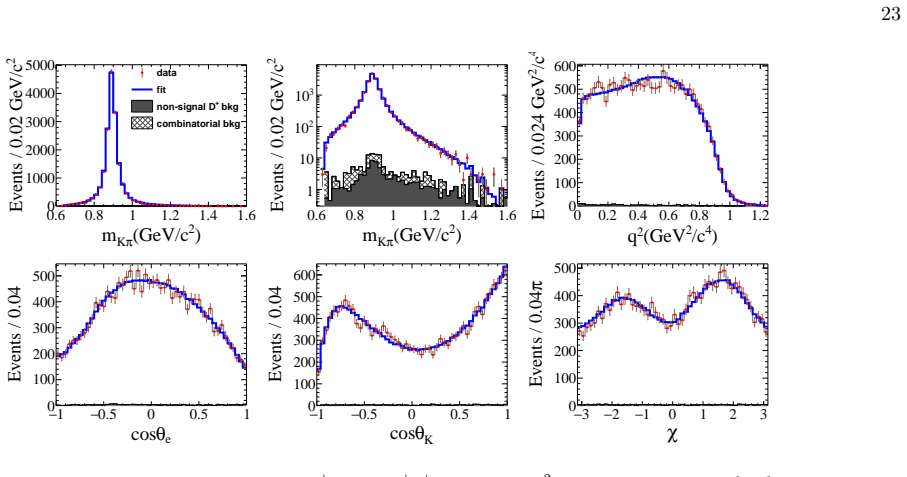
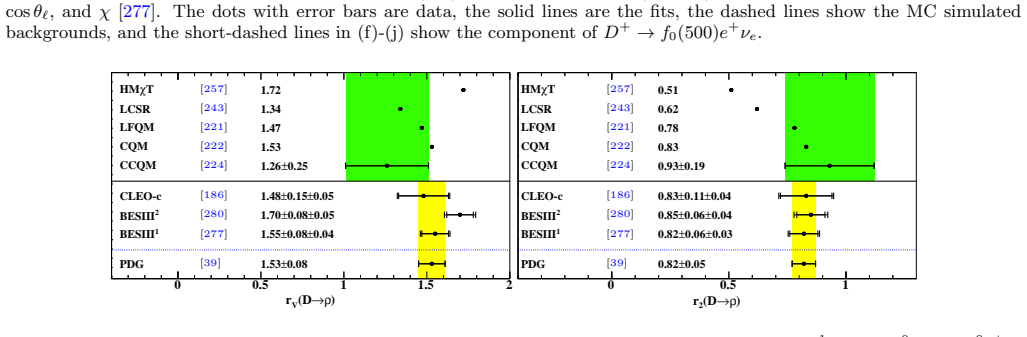
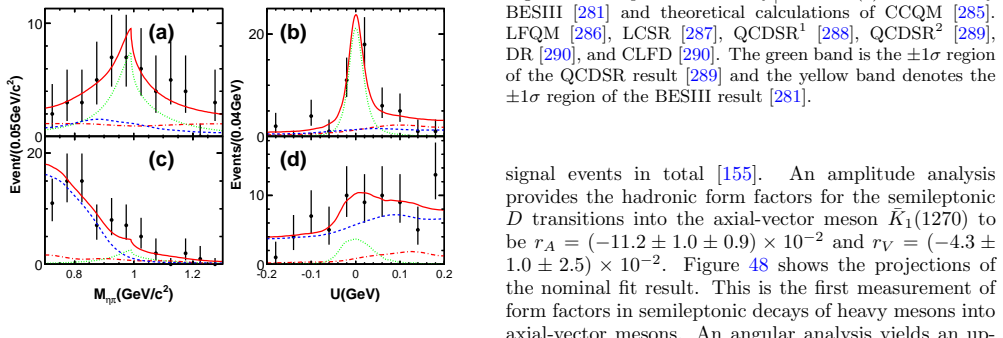
Experimental measurements of different decays of charmed mesons have been extensively performed at BESIII. Precision measurements of absolute branching fractions of different decays, the decay constants of $D^+$ and $D^+_s$ mesons, hadronic form factors of $D$ transitions to light hadrons ($K$, $\pi$, $\eta$, $\eta^\prime$, $K^*(892)$, $\rho$, $\omega$, $\phi$, $K_1(1270)$, $f_0(980)$), $c\to s(d)$ Cabibbo-Kobayashi-Maskawa (CKM) matrix elements, tests of lepton flavor universality with various (semi)leptonic $D$ decays, precision measurements of strong phase difference between $D^0$ and $\bar D^0$ decays, amplitude analyses of multibody hadronic $D_{(s)}$ decays, search for rare $D$ decays have been reported. The reported results offer important information to test different theoretical calculations, to test the unitarity of the CKM matrix, and to search for new physics effects beyond the standard model (SM). This paper reviews experimental studies of different decays of $D^0$, $D^+$, and $D^+_s$ as well as their excitations at BESIII as of April 15, 2026. Based on existing results of (semi)leptonic $D$ decays from all experiments, we have presented the most precise averages for the CKM matrix elements $|V_{cs}|=0.9648\pm0.009\pm0.0036$ and $|V_{cd}|=0.2259\pm0.0014\pm0.0013$, the decay constants of $D^+$ and $D^+_s$ $f_{D^+}=(213.1\pm2.0\pm1.5)$ MeV and $f_{D^+_s}=(253.2\pm1.2\pm1.6)$ MeV, as well as the hadronic form factors $f^{D\to K}_+(0)=0.7342\pm0.0007\pm0.0008$, $f^{D\to \pi}_+(0)=0.6337\pm0.0053\pm0.0037$, $f^{D\to \eta}_+(0)=0.351\pm0.009\pm0.005$, $f^{D\to \eta^\prime}_+(0)=0.263\pm0.025\pm0.006$, $f^{D_s\to \eta}_+(0)=0.4653\pm0.0058\pm0.0069$, $f^{D_s\to \eta^\prime}_+(0)=0.535\pm0.020\pm0.011$, and $f^{D_s\to K^0}_+(0)=0.627\pm0.036\pm0.009$, where the first and second uncertainties are statistical and systematic, respectively.

Editorial analysis

A structured set of objections, weighed in public.

Desk editor's note, referee report, simulated authors' rebuttal, and a circularity audit. Tearing a paper down is the easy half of reading it; the pith above is the substance, this is the friction.

Referee Report

1 major / 0 minor

Summary. This manuscript is a review of experimental studies of charmed meson decays (D^0, D^+, D_s^+ and excitations) at BESIII, summarizing measurements of absolute branching fractions, (semi)leptonic decays, decay constants, hadronic form factors for D transitions to light hadrons, CKM elements |V_cs| and |V_cd|, lepton flavor universality tests, strong phase differences, amplitude analyses of multibody decays, and rare decay searches. It concludes by presenting combined world averages for |V_cs|=0.9648±0.009±0.0036, |V_cd|=0.2259±0.0014±0.0013, f_{D^+}=(213.1±2.0±1.5) MeV, f_{D_s^+}=(253.2±1.2±1.6) MeV, and several f_+(0) values, derived from results across all experiments.

Significance. If the averages are rigorously derived, the review compiles a substantial body of high-precision BESIII data that serves as a key resource for testing lattice QCD calculations, verifying CKM unitarity, and searching for beyond-Standard-Model effects in charm physics. The explicit numerical averages for decay constants and form factors provide concrete benchmarks for phenomenological use.

major comments (1)
  1. [Abstract] Abstract: The central claim of having 'presented the most precise averages' for |V_cs|, |V_cd|, f_{D^+}, f_{D_s^+}, and the listed f_+(0) values (e.g., f^{D→K}_+(0)=0.7342±0.0007±0.0008) is load-bearing but unsupported by any description of the averaging procedure. No section, table, or appendix specifies the input measurements selected, the list of experiments included, the treatment of correlations among systematic uncertainties from BESIII, CLEO-c, BaBar, Belle, and LHCb, or the combination algorithm (e.g., weighted average, scale factor, or covariance construction). This prevents evaluation of whether the quoted total uncertainties are correctly estimated or whether the 'most precise' assertion holds.

Simulated Author's Rebuttal

1 responses · 0 unresolved

We thank the referee for the careful reading and constructive feedback on our manuscript. We appreciate the acknowledgment of its potential value as a resource for lattice QCD tests and CKM unitarity checks. We address the single major comment below.

read point-by-point responses
  1. Referee: [Abstract] Abstract: The central claim of having 'presented the most precise averages' for |V_cs|, |V_cd|, f_{D^+}, f_{D_s^+}, and the listed f_+(0) values (e.g., f^{D→K}_+(0)=0.7342±0.0007±0.0008) is load-bearing but unsupported by any description of the averaging procedure. No section, table, or appendix specifies the input measurements selected, the list of experiments included, the treatment of correlations among systematic uncertainties from BESIII, CLEO-c, BaBar, Belle, and LHCb, or the combination algorithm (e.g., weighted average, scale factor, or covariance construction). This prevents evaluation of whether the quoted total uncertainties are correctly estimated or whether the 'most precise' assertion holds.

    Authors: We agree that a transparent description of the averaging procedure is required to support the central claims. The quoted values are world averages combining results from BESIII and other experiments (CLEO-c, BaBar, Belle, LHCb), as stated in the abstract. In the revised manuscript we will add a dedicated subsection (or appendix) that explicitly lists: the selected input measurements and experiments, inclusion criteria, treatment of correlations among systematic uncertainties, and the combination algorithm (weighted averages, with scale factors applied where appropriate for consistency). This will enable readers to verify the uncertainties and confirm the 'most precise' status. revision: yes

Circularity Check

0 steps flagged

Averages of independent experimental results from multiple experiments introduce no circular derivation

full rationale

The paper is a review that summarizes published measurements of charmed meson decays from BESIII and other experiments (CLEO-c, Belle, BaBar, LHCb), then computes simple averages for |V_cs|, |V_cd|, f_D, f_{D_s}, and selected form factors f_+(0). No internal equations, ansatze, or derivations are presented that reduce these averages to quantities defined or fitted within the paper itself. The central claims rest on external literature values whose uncertainties and correlations are taken as given; any self-citations to prior BESIII work are not load-bearing for the quoted averages. This is the standard, non-circular structure of an experimental review.

Axiom & Free-Parameter Ledger

0 free parameters · 1 axioms · 0 invented entities

The paper relies on standard particle-physics conventions for combining experimental results and on the accuracy of the cited BESIII measurements; no new free parameters, axioms beyond domain standards, or invented entities are introduced.

axioms (1)
  • domain assumption Standard assumptions in particle physics data averaging, such as Gaussian error distributions and independence of systematic uncertainties where not specified otherwise.
    Invoked when forming the combined averages for CKM elements, decay constants, and form factors from multiple experiments.

pith-pipeline@v0.9.0 · 5870 in / 1466 out tokens · 55584 ms · 2026-05-09T22:31:36.839221+00:00 · methodology

discussion (0)

Sign in with ORCID, Apple, or X to comment. Anyone can read and Pith papers without signing in.

Reference graph

Works this paper leans on

298 extracted references · 213 canonical work pages · 4 internal anchors

  1. [1]

    J. E. Augustinet al.(SLAC-SP-017), Phys. Rev. Lett. 33, 1406 (1974)

  2. [2]

    J. J. Aubertet al.(E598), Phys. Rev. Lett.33, 1404 (1974)

  3. [3]

    Goldhaberet al., Phys

    G. Goldhaberet al., Phys. Rev. Lett.37, 255 (1976)

  4. [4]

    Peruzziet al., Phys

    I. Peruzziet al., Phys. Rev. Lett.37, 569 (1976)

  5. [5]

    Brandeliket al.(DASP), Phys

    R. Brandeliket al.(DASP), Phys. Lett. B70, 132 (1977)

  6. [6]

    Brandeliket al.(DASP), Phys

    R. Brandeliket al.(DASP), Phys. Lett. B80, 412 (1979)

  7. [7]

    Blaylocket al.(MARK-III), Phys

    G. Blaylocket al.(MARK-III), Phys. Rev. Lett.58, 2171 (1987)

  8. [8]

    Silverman and H

    D. Silverman and H. Yao, Phys. Rev. D38, 214 (1988)

  9. [9]

    Becher and R

    T. Becher and R. J. Hill, Phys. Lett. B633, 61 (2006), arXiv:hep-ph/0509090

  10. [10]

    R. N. Faustov, V. O. Galkin, and X.-W. Kang, Phys. Rev. D101, 013004 (2020), arXiv:1911.08209 [hep-ph]

  11. [11]

    Ryd and A

    A. Ryd and A. A. Petrov, Rev. Mod. Phys.84, 65 (2012), arXiv:0910.1265 [hep-ph]

  12. [12]

    Xing, Phys

    Z.-z. Xing, Phys. Rev. D55, 196 (1997), arXiv:hep- ph/9606422

  13. [13]

    Amhiset al.(HFLAV), Eur

    Y. Amhiset al.(HFLAV), Eur. Phys. J. C77, 895 (2017), arXiv:1612.07233 [hep-ex]

  14. [15]

    Fajfer, S

    S. Fajfer, S. Prelovsek, and P. Singer, Phys. Rev. D64, 114009 (2001), arXiv:hep-ph/0106333

  15. [16]

    A. Paul, I. I. Bigi, and S. Recksiegel, Phys. Rev. D83, 114006 (2011), arXiv:1101.6053 [hep-ph]

  16. [17]

    Cappiello, O

    L. Cappiello, O. Cata, and G. D’Ambrosio, JHEP04, 135 (2013), arXiv:1209.4235 [hep-ph]

  17. [18]

    Ablikimet al.(BES), Phys

    M. Ablikimet al.(BES), Phys. Lett. B668, 263 (2008)

  18. [19]

    Ablikimet al.(BESIII), Chin

    M. Ablikimet al.(BESIII), Chin. Phys. C42, 083001 (2018), arXiv:1803.06293 [hep-ex]

  19. [20]

    Bernsteinet al., Nucl

    D. Bernsteinet al., Nucl. Instrum. Meth. A226, 301 (1984)

  20. [21]

    J. Z. Baiet al.(BES), Nucl. Instrum. Meth. A344, 319 (1994)

  21. [22]

    J. Z. Baiet al.(BES), Nucl. Instrum. Meth. A458, 627 (2001)

  22. [23]

    Petersonet al., Nucl

    D. Petersonet al., Nucl. Instrum. Meth. A478, 142 (2002)

  23. [24]

    Kubotaet al.(CLEO), Nucl

    Y. Kubotaet al.(CLEO), Nucl. Instrum. Meth. A320, 66 (1992)

  24. [25]

    Artusoet al., Nucl

    M. Artusoet al., Nucl. Instrum. Meth. A502, 91 (2003), arXiv:hep-ex/0209009

  25. [26]

    Design and Construction of the BESIII Detector

    M. Ablikimet al.(BESIII), Nucl. Instrum. Meth. A 614, 345 (2010), arXiv:0911.4960 [physics.ins-det]

  26. [27]

    Ablikim (BESIII), Chin

    M. Ablikim (BESIII), Chin. Phys. C37, 123001 (2013), arXiv:1307.2022 [hep-ex]

  27. [28]

    Ablikimet al.,Measurement of integrated luminosity of data collected at 3.773 GeV by BESIII from 2021 to 2024, Chin

    M. Ablikimet al.(BESIII), Chin. Phys. C48, 123001 (2024), arXiv:2406.05827 [hep-ex]

  28. [29]

    Baiet al.(MARK-III), Phys

    Z. Baiet al.(MARK-III), Phys. Rev. Lett.66, 1011 (1991)

  29. [30]

    Ablikimet al.(BESIII Collaborations),arXiv:2601.21185

    M. Ablikimet al.(BESIII), (2026), arXiv:2601.21185 [hep-ex]

  30. [31]

    Ablikimet al.(BESIII Collaborations),arXiv:2601.21196

    M. Ablikimet al.(BESIII), (2026), arXiv:2601.21196 [hep-ex]

  31. [32]

    Ablikimet al.(BESIII), Phys

    M. Ablikimet al.(BESIII), Phys. Rev. D89, 051104 (2014), arXiv:1312.0374 [hep-ex]

  32. [33]

    Ablikimet al.(BESIII), Precision Measurement of the Branching Fraction ofD+→µ+νµ, Phys

    M. Ablikimet al.(BESIII), Phys. Rev. Lett.135, 061801 (2025), arXiv:2410.07626 [hep-ex]

  33. [34]

    J. Z. Baiet al.(BES), Phys. Rev. D62, 012002 (2000), arXiv:hep-ex/9910016

  34. [35]

    Cronin-Hennessyet al.(CLEO), Phys

    D. Cronin-Hennessyet al.(CLEO), Phys. Rev. D80, 072001 (2009), arXiv:0801.3418 [hep-ex]

  35. [36]

    Ablikimet al.(BESIII), Chin

    M. Ablikimet al.(BESIII), Chin. Phys. C39, 093001 (2015), arXiv:1503.03408 [hep-ex]

  36. [37]

    Ablikimet al.(BESIII), Chin

    M. Ablikimet al.(BESIII), Chin. Phys. C46, 113002 (2022), arXiv:2203.03133 [hep-ex]

  37. [38]

    Navaset al.(Particle Data Group), Phys

    S. Navaset al.(Particle Data Group), Phys. Rev. D 110, 030001 (2024)

  38. [39]

    Improved measurement of the branching fraction of $D_s^+\to\mu^+\nu_\mu$

    M. Ablikimet al.(BESIII), Phys. Rev. D108, 112001 (2023), arXiv:2307.14585 [hep-ex]

  39. [40]

    Albrechtet al.(ARGUS), Nucl

    H. Albrechtet al.(ARGUS), Nucl. Instrum. Meth. A 275, 1 (1989)

  40. [41]

    Aubertet al.(BaBar), Nucl

    B. Aubertet al.(BaBar), Nucl. Instrum. Meth. A479, 1 (2002), arXiv:hep-ex/0105044

  41. [42]

    Abashianet al.(Belle), Nucl

    A. Abashianet al.(Belle), Nucl. Instrum. Meth. A479, 117 (2002)

  42. [43]

    Anelliet al., Nucl

    M. Anelliet al., Nucl. Instrum. Meth. A289, 294 (1990)

  43. [44]

    Adevaet al.(L3), Nucl

    B. Adevaet al.(L3), Nucl. Instrum. Meth. A289, 35 (1990)

  44. [45]

    Ahmetet al.(OPAL), Nucl

    K. Ahmetet al.(OPAL), Nucl. Instrum. Meth. A305, 275 (1991)

  45. [46]

    J. R. Raabet al.(Tagged Photon Spectrometer), Phys. Rev. D37, 2391 (1988)

  46. [47]

    P. L. Frabettiet al.(E-687), Nucl. Instrum. Meth. A 320, 519 (1992)

  47. [48]

    Amato, J

    S. Amato, J. R. T. de Mello Neto, J. de Miranda, C. James, D. J. Summers, and S. B. Bracker, Nucl. Instrum. Meth. A324, 535 (1993), arXiv:hep- ex/0001003

  48. [49]

    Alexopouloset al.(E771), Nucl

    T. Alexopouloset al.(E771), Nucl. Instrum. Meth. A 376, 375 (1996)

  49. [50]

    Pripsteinet al.(E789), Phys

    D. Pripsteinet al.(E789), Phys. Rev. D61, 032005 (2000), arXiv:hep-ex/9906022

  50. [51]

    Russet al.(SELEX), in29th International Con- ference on High-Energy Physics(1998) pp

    J. Russet al.(SELEX), in29th International Con- ference on High-Energy Physics(1998) pp. 1259–1262, arXiv:hep-ex/9812031

  51. [52]

    J. M. Linket al.(FOCUS), Nucl. Instrum. Meth. A484, 270 (2002), arXiv:hep-ex/0108011

  52. [53]

    Adamovichet al., IEEE Trans

    M. Adamovichet al., IEEE Trans. Nucl. Sci.37, 236 (1990). 77

  53. [54]

    Adinolfiet al., Nucl

    M. Adinolfiet al., Nucl. Instrum. Meth. A329, 117 (1993)

  54. [55]

    Barateet al., Nucl

    R. Barateet al., Nucl. Instrum. Meth. A235, 235 (1985)

  55. [56]

    O. C. Allkoferet al.(European Muon), Nucl. Instrum. Meth.179, 445 (1981)

  56. [57]

    Biinoet al., Nucl

    C. Biinoet al., Nucl. Instrum. Meth. A243, 323 (1986)

  57. [58]

    Barlaget al.(ACCMOR), Z

    S. Barlaget al.(ACCMOR), Z. Phys. C55, 383 (1992)

  58. [59]

    Eskutet al.(CHORUS), Nucl

    E. Eskutet al.(CHORUS), Nucl. Instrum. Meth. A 401, 7 (1997)

  59. [60]

    J. E. Augustinet al., Phys. Rev. Lett.34, 233 (1975)

  60. [61]

    Barbaro-Galtieriet al., Phys

    A. Barbaro-Galtieriet al., Phys. Rev. Lett.39, 1058 (1977)

  61. [62]

    Abtet al.(HERA-B), Eur

    I. Abtet al.(HERA-B), Eur. Phys. J. C26, 345 (2003), arXiv:hep-ex/0205106

  62. [63]

    Blairet al.(CDF), (1996)

    R. Blairet al.(CDF), (1996)

  63. [64]

    A. A. Alves, Jr.et al.(LHCb), JINST3, S08005 (2008)

  64. [65]

    Aaijet al.,LHCb detector performance, Int

    R. Aaijet al.(LHCb), Int. J. Mod. Phys. A30, 1530022 (2015), arXiv:1412.6352 [hep-ex]

  65. [66]

    Adleret al., Phys

    J. Adleret al., Phys. Rev. Lett.60, 1375 (1988), [Erratum: Phys.Rev.Lett. 63, 1658 (1989)]

  66. [67]

    J. Z. Baiet al.(BES), Phys. Lett. B429, 188 (1998)

  67. [68]

    Ablikimet al.(BES), Phys

    M. Ablikimet al.(BES), Phys. Lett. B610, 183 (2005), arXiv:hep-ex/0410050

  68. [69]

    Bonviciniet al.(CLEO), Phys

    G. Bonviciniet al.(CLEO), Phys. Rev. D70, 112004 (2004), arXiv:hep-ex/0411050

  69. [70]

    Artusoet al.(CLEO), Phys

    M. Artusoet al.(CLEO), Phys. Rev. Lett.95, 251801 (2005), arXiv:hep-ex/0508057

  70. [71]

    B. I. Eisensteinet al.(CLEO), Phys. Rev. D78, 052003 (2008), arXiv:0806.2112 [hep-ex]

  71. [72]

    Ablikimet al.(BESIII), Chin

    M. Ablikimet al.(BESIII), Chin. Phys. C.49, 063001 (2025), arXiv:2501.04760 [hep-ex]

  72. [73]

    Ablikimet al.(BESIII), JHEP01, 089 (2025), arXiv:2410.20063 [hep-ex]

    M. Ablikimet al.(BESIII), JHEP01, 089 (2025), arXiv:2410.20063 [hep-ex]

  73. [74]

    Ablikimet al.(BESIII), Phys

    M. Ablikimet al.(BESIII), Phys. Rev. Lett.123, 211802 (2019), arXiv:1908.08877 [hep-ex]

  74. [75]

    Aoki et al., FLAG review 2024, Phys

    Y. Aokiet al.(Flavour Lattice Averaging Group (FLAG)), Phys. Rev. D113, 014508 (2026), arXiv:2411.04268 [hep-lat]

  75. [76]

    Banerjeeet al.(Heavy Flavor Averaging Group (HFLAV)), Phys

    S. Banerjeeet al.(Heavy Flavor Averaging Group (HFLAV)), Phys. Rev. D113, 012008 (2026), arXiv:2411.18639 [hep-ex]

  76. [77]

    Carrascoet al., Phys

    N. Carrascoet al., Phys. Rev.D91, 054507 (2015), arXiv:1411.7908 [hep-lat]

  77. [78]

    B- andD-meson leptonic decay con- stants from four-flavor lattice QCD,

    A. Bazavovet al., Phys. Rev.D98, 074512 (2018), arXiv:1712.09262 [hep-lat]

  78. [79]

    Widhalmet al.(Belle Collaboration), Phys

    L. Widhalmet al.(Belle Collaboration), Phys. Rev. Lett.97, 061804 (2006)

  79. [80]

    J. P. Leeset al.(BaBar), Phys. Rev. D91, 052022 (2015), arXiv:1412.5502 [hep-ex]

  80. [81]

    Bessonet al.(CLEO Collaboration), Phys

    D. Bessonet al.(CLEO Collaboration), Phys. Rev. D 80, 032005 (2009)

Showing first 80 references.