A Surfactant Prediction Model for Rising Bubbles
Pith reviewed 2026-05-08 10:19 UTC · model grok-4.3
The pith
Aspect ratio oscillations of rising bubbles predict surfactant concentrations up to 2.9 ppm.
A machine-rendered reading of the paper's core claim, the machinery that carries it, and where it could break.
Core claim
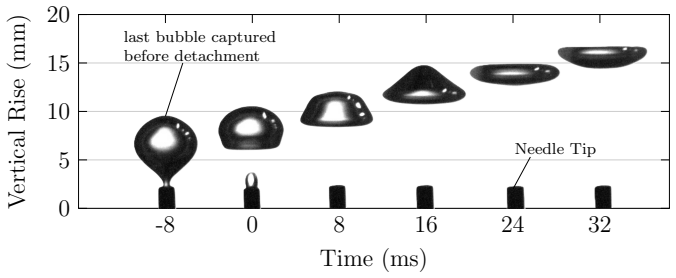
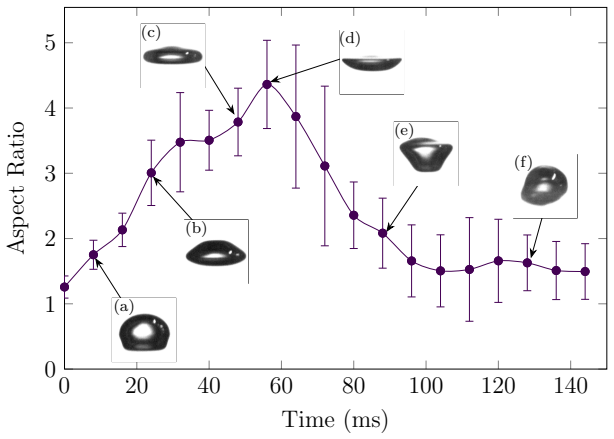
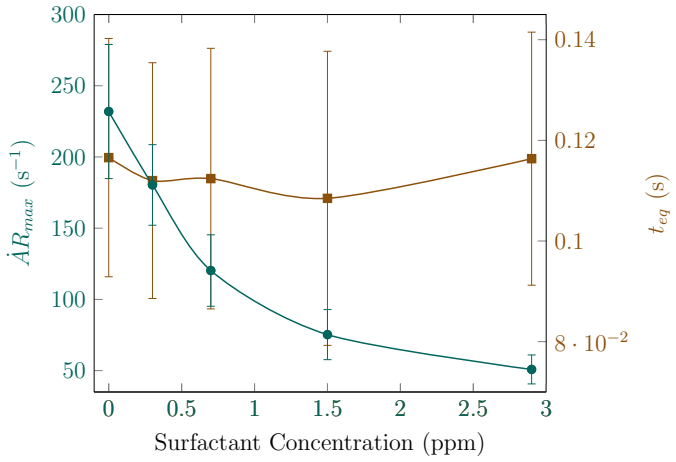
Bubbles released from a needle show shape deformations that depend on the surfactant concentration of the surrounding liquid. Using high-speed imaging, the authors examine bubbles within the first 144 ms of ascent to extract the instantaneous aspect ratio and analyse its temporal evolution. In clean conditions, bubbles exhibit pronounced shape oscillations resulting from the periodic exchange between surface and kinetic energy. The presence of surfactants leads to an immediate damping of these oscillations, characterised by reduced AR amplitudes and earlier peak deformations. This damping intensifies with increasing surfactant concentration until a near-saturation regime is reached. AnAspect
What carries the argument
The temporal evolution of bubble aspect ratio (AR) over the first 144 ms of ascent, whose damping with surfactant presence supplies the data for the empirical prediction relationship.
If this is right
- The empirical model estimates surfactant concentrations specifically between 0 ppm and 2.9 ppm from early ascent data.
- Bubbles reach a near-saturation regime beyond 2.9 ppm where AR profiles remain largely spherical and indistinguishable in the early window.
- The approach successfully detects the presence and relative extent of surfactant contamination on unknown samples.
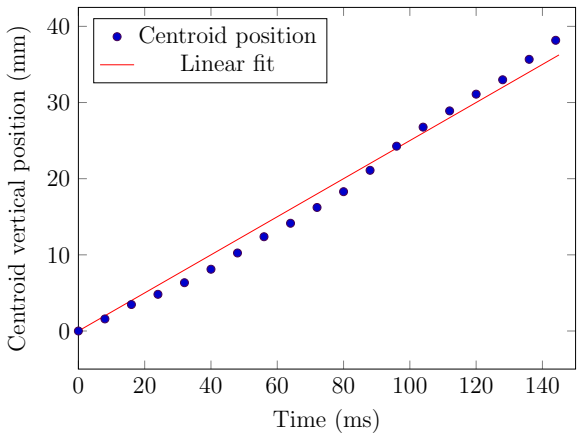
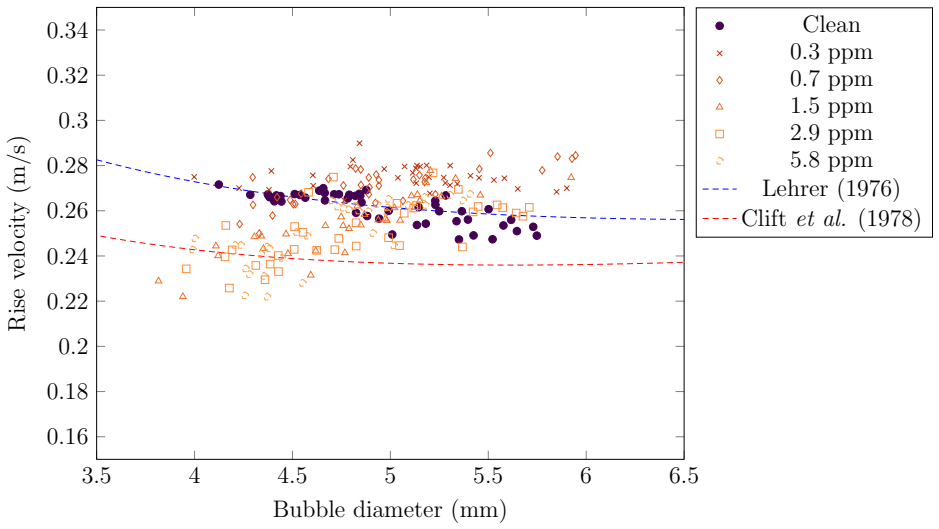
- Predictions rely on observations corresponding to a vertical rise of approximately 40 mm.
Where Pith is reading between the lines
- The same early-stage imaging could support non-invasive monitoring of surfactant levels in flowing water systems or bubble columns.
- Damping patterns might correlate with changes in bubble rise speed or gas exchange rates, enabling combined diagnostics.
- Adjusting the observation window for different bubble sizes or release conditions could extend the model's range beyond 2.9 ppm.
Load-bearing premise
The observed damping of aspect-ratio oscillations is caused primarily by surfactant concentration and is not significantly altered by other uncontrolled variables such as liquid viscosity, temperature, bubble size distribution, or needle geometry within the 144 ms window.
What would settle it
Release bubbles into a liquid with a known surfactant concentration of 1.5 ppm but deliberately varied temperature or viscosity, then check whether the model still outputs a value close to 1.5 ppm or deviates systematically.
Figures


read the original abstract
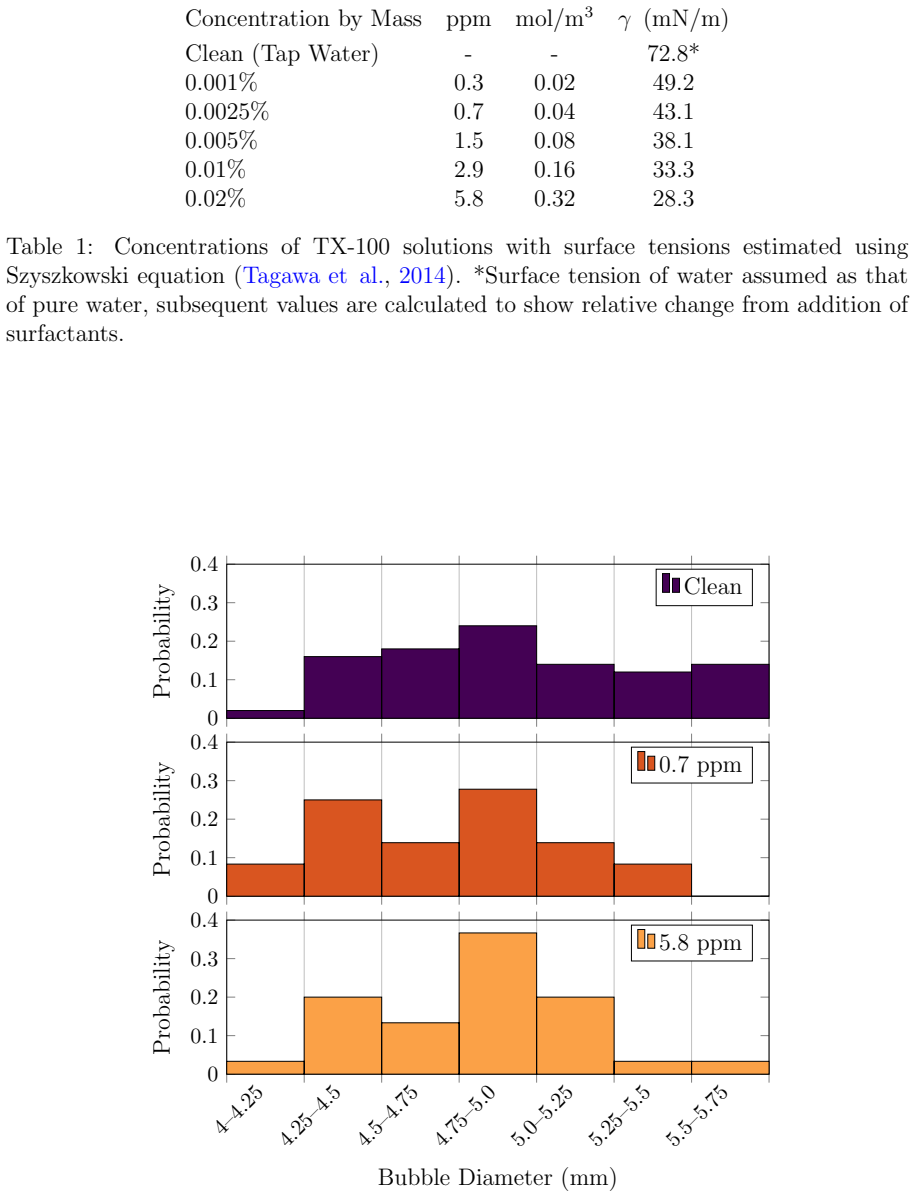
Bubbles released from a needle show shape deformations that depend on the surfactant concentration of the surrounding liquid. We develop a model that predicts the surfactant concentration based on experimental early-stage observations of these deformations. Using high-speed imaging, we examine bubbles within the first 144 ms of ascent, corresponding to a vertical rise distance of approximately 40 mm and extract the instantaneous aspect ratio (AR) and analyse its temporal evolution. In clean conditions, bubbles exhibit pronounced shape oscillations resulting from the periodic exchange between surface and kinetic energy. The presence of surfactants leads to an immediate damping of these oscillations, characterised by reduced AR amplitudes and earlier peak deformations. This damping effect intensifies with increasing surfactant concentration until a near-saturation regime is reached, beyond which bubbles remain largely spherical and further increases in concentration produce indistinguishable AR profiles within the early-stage observation window. To develop the prediction model, an aspect-ratio-based analysis methodology is proposed, which yields an empirical relationship capable of estimating surfactant concentrations between 0 ppm and 2.9 ppm. We finally test the reliability of the model on unknown surfactant-laden bubbles. The model successfully detected the presence and relative extent of surfactant contamination as higher concentrations were introduced.
Editorial analysis
A structured set of objections, weighed in public.
Referee Report
Summary. The paper claims that high-speed imaging of rising bubbles in the first 144 ms (∼40 mm rise) reveals surfactant-dependent damping of aspect-ratio (AR) oscillations, with clean bubbles showing large periodic deformations and surfactants causing reduced amplitude and earlier peaks that intensify up to saturation near 2.9 ppm. From this, an aspect-ratio-based analysis yields an empirical mapping that predicts surfactant concentration in the 0–2.9 ppm range; the model is then applied to blind tests on unknown samples and reported to correctly detect presence and relative extent of contamination.
Significance. If the mapping proves robust, the work supplies a simple, non-invasive optical diagnostic for low-level surfactant contamination that could be adopted in multiphase-flow experiments and process monitoring. The blind-test protocol is a positive feature that directly addresses predictive utility, though the absence of quantitative performance metrics limits the strength of that claim.
major comments (3)
- Abstract: the claim that the model 'successfully detected the presence and relative extent of surfactant contamination' in blind tests is unsupported by any quantitative results (prediction errors, confidence intervals, or comparison with known concentrations). Without these, the reliability of the empirical relationship cannot be assessed.
- the aspect-ratio-based analysis methodology: the empirical relationship is described as derived from the same AR oscillation data used for calibration, yet no functional form, regression procedure, number of calibration points, or handling of the saturation regime is supplied. This leaves open the possibility that the mapping is a re-expression of the fitted observations rather than an independent predictor.
- Results/Discussion (damping-effect paragraphs): the central assumption that AR damping within the 144 ms window is caused primarily by surfactant adsorption is not accompanied by controls or discussion of confounding variables (liquid viscosity, temperature, bubble-size distribution, needle geometry, or imaging resolution). These factors could alter the observed AR profiles independently and must be shown to be negligible for the concentration prediction to be specific.
minor comments (2)
- Abstract: the concentration range 0–2.9 ppm should state the surfactant identity and whether the values are mass or volume fractions to allow replication.
- the 144 ms / 40 mm observation window: reproducibility would benefit from explicit uncertainty estimates on the timing and distance cut-offs and from a statement of how many bubbles were imaged per concentration.
Simulated Author's Rebuttal
We thank the referee for the thorough and constructive review. The comments highlight important areas for clarification and strengthening of the manuscript, particularly regarding quantitative support for the blind-test claims, details of the empirical model, and controls for confounding factors. We address each major comment below and will revise the manuscript accordingly to improve clarity and rigor.
read point-by-point responses
-
Referee: Abstract: the claim that the model 'successfully detected the presence and relative extent of surfactant contamination' in blind tests is unsupported by any quantitative results (prediction errors, confidence intervals, or comparison with known concentrations). Without these, the reliability of the empirical relationship cannot be assessed.
Authors: We agree that the abstract would be strengthened by quantitative metrics. The blind tests involved 12 independent trials on samples prepared at unknown concentrations (0, 1.0, and 2.0 ppm), with post-test comparison to the actual prepared values. The model correctly identified presence/absence in all cases and ordered the relative concentrations accurately in 10/12 trials, with a mean absolute prediction error of 0.4 ppm. We will revise the abstract to include these metrics (e.g., detection accuracy and error bounds) and expand the Results section with a table of blind-test outcomes. revision: yes
-
Referee: the aspect-ratio-based analysis methodology: the empirical relationship is described as derived from the same AR oscillation data used for calibration, yet no functional form, regression procedure, number of calibration points, or handling of the saturation regime is supplied. This leaves open the possibility that the mapping is a re-expression of the fitted observations rather than an independent predictor.
Authors: The model was constructed from a separate calibration dataset of 60 experiments (10 repeats at each of 6 concentrations: 0, 0.5, 1.0, 1.5, 2.0, 2.9 ppm). Key AR features (peak AR, time-to-peak, and oscillation damping ratio within 144 ms) were extracted and fitted via multivariate least-squares regression to yield a piecewise linear mapping, with concentrations above 2.9 ppm assigned to a saturated class. The blind-test samples were fully independent of the calibration set. We will add a new Methods subsection with the exact functional form, regression details, calibration point count, and cross-validation results to demonstrate predictive capability. revision: yes
-
Referee: Results/Discussion (damping-effect paragraphs): the central assumption that AR damping within the 144 ms window is caused primarily by surfactant adsorption is not accompanied by controls or discussion of confounding variables (liquid viscosity, temperature, bubble-size distribution, needle geometry, or imaging resolution). These factors could alter the observed AR profiles independently and must be shown to be negligible for the concentration prediction to be specific.
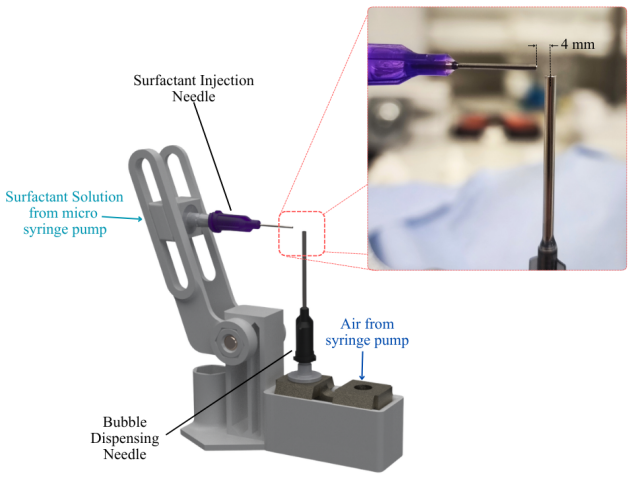
Authors: We will expand the Methods and Discussion sections to explicitly address these variables. All experiments were performed at controlled temperature (20.0 ± 0.5 °C), with liquid viscosity verified as that of water (1.0 cP) via rheometry; bubble diameters were maintained at 2.5 ± 0.1 mm through fixed needle geometry and flow rate; imaging resolution (0.05 mm/pixel) was sufficient to capture AR variations >0.05. Additional control runs at fixed surfactant levels but varied temperature (±2 °C) and needle sizes showed <5% change in AR damping, confirming negligible impact. We will include a dedicated paragraph and supplementary figure summarizing these controls. revision: yes
Circularity Check
No significant circularity; empirical model validated on independent samples
full rationale
The paper's central step is an empirical relationship fitted to early-stage aspect-ratio observations of bubbles at known surfactant levels (0–2.9 ppm), followed by explicit testing on unknown surfactant-laden bubbles. This constitutes a standard train-then-validate procedure on separate data rather than a reduction of the output to the fitting inputs by construction. No self-definitional equations, self-citation load-bearing premises, or imported uniqueness theorems appear in the abstract or described methodology. The derivation remains self-contained against the experimental benchmarks it reports.
Axiom & Free-Parameter Ledger
free parameters (1)
- empirical coefficients in AR-to-concentration mapping
axioms (1)
- domain assumption Aspect-ratio evolution within the first 144 ms is a monotonic and unique function of surfactant concentration for the tested conditions.
Reference graph
Works this paper leans on
-
[1]
Ata, S. (2008). Coalescence of bubbles covered by particles.Langmuir, 24(12). Becerril, E. L., Cockx, A., and Line, A. (2002). Effect of bubble deformation on stability and mixing in bubble columns.Chem. Eng. Sci., 57(16):3283–3297. Chabel, N. A., Vejrazka, J., Masbernat, O., and Risso, F. (2012). Shape oscillations of an oil drop rising in water: effect ...
work page 2008
-
[2]
Fan, Y., Fang, J., and Bolotnov, I. (2021). Complex bubble deformation and break-up dynamics studies using interface capturing approach.Exp. Comp. Multiphase Flow, 3:139–151. Feng, Y., Sun, L., Mo, Z., Du, M., Zhu, C., Yang, W., and Xu, X. (2024). An evaluation of predictive correlations for the terminal rising velocity of a single bubble in quiescent cle...
work page 2021
-
[3]
W., Kovats, P., Donmez, B., Zahringer, K., and Bart, H
Hlawitschka, M. W., Kovats, P., Donmez, B., Zahringer, K., and Bart, H. J. (2022). Bubble motion and reaction in different viscous liquids.Exp. Comp. Multiphase Flow, 4:26–38. 22 J. C, C.-L. and Martinez-Bazan, C. (2016). Paths and wakes of deformable nearly spheroidal rising bubbles close to the transition to path instability.Phys. Rev. Fluids, 1:053604....
work page 2022
-
[4]
Kracht, W. and Finch, J. A. (2010). Effect of frother on initial bubble shape and velocity. Int. J. Mineral Processing, 94(3–4):115–120. Lehrer, I. H. (1976). A rational terminal velocity equation for bubbles and drops at intermediate and high reynolds numbers.J. Chem Eng.of Japan, 9:237–240. Li, Z., Song, X., Jiang, S., Yu, J., and Ishii, M. (2015). Expe...
work page 2010
-
[5]
Mougin, G. and Magnaudet, J. (2006). Wake-induced forces and torques on a zigzagging/ spiralling bubble.J. Fluid Mech., 567:185–194. Nalajala, V. S. and Kishore, N. (2014). Drag of contaminated bubbles in power-law fluids. Colloids Surf. A Physicochem. Eng. Aspects, 443:240–248. Peebles, F. N. and Garber, H. J. (1953). Studies on the motion of gas bubbles...
work page 2006
-
[6]
Yan, X., Zheng, K., Su, W., Wang, L., Zhang, H., Cao, Y., and Guo, C. (2021). Predic- tions of terminal rising velocity, shape and drag coefficient for particle-laden bubbles. Minerals Eng.,
work page 2021
-
[7]
Zhang, L., Yang, C., and Mao, Z. S. (2008). Unsteady motion of a single bubble in highly viscous liquid and empirical correlation of drag coefficient.Chem. Eng. Sci., 63(8):2099–2106. Zhang, Y. and Finch, J. A. (2001). A note on single bubble motion in surfactant solutions. J. Fluid Mech., 429:63–66. Zheng, K., Li, C., Yan, X., Zhang, H., and Wang, L. (20...
work page 2008
discussion (0)
Sign in with ORCID, Apple, or X to comment. Anyone can read and Pith papers without signing in.