Sampling distributions for complex design variance estimators in a Fay-Herriot model
Pith reviewed 2026-05-08 10:41 UTC · model grok-4.3
The pith
Fay-Herriot models with variance smoothing yield better credible intervals when using derived sampling distributions instead of chi-squared for complex survey designs.
A machine-rendered reading of the paper's core claim, the machinery that carries it, and where it could break.
Core claim
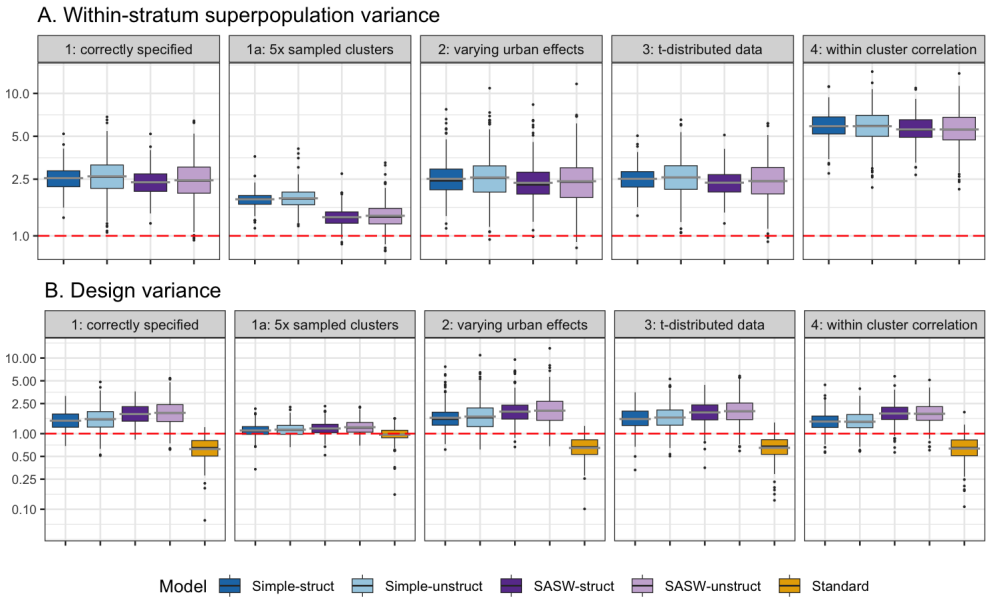
We derive two sampling distributions under the DHS design while specifying the required superpopulation and design assumptions. The variance smoothing models produce better credible intervals according to proper scoring rules than the standard Fay-Herriot model, which exhibits undercoverage. The simple sampling distribution performs equally as well as the more complex one.
What carries the argument
Two derived sampling distributions (simple and complex) for design variance estimators in stratified two-stage cluster sampling, incorporated into variance smoothing for Fay-Herriot models.
If this is right
- Standard Fay-Herriot models show undercoverage of credible intervals under complex designs.
- Variance smoothing with the derived distributions improves credible interval performance by proper scoring rules.
- The simple derived distribution matches the complex one in effectiveness while being easier to implement.
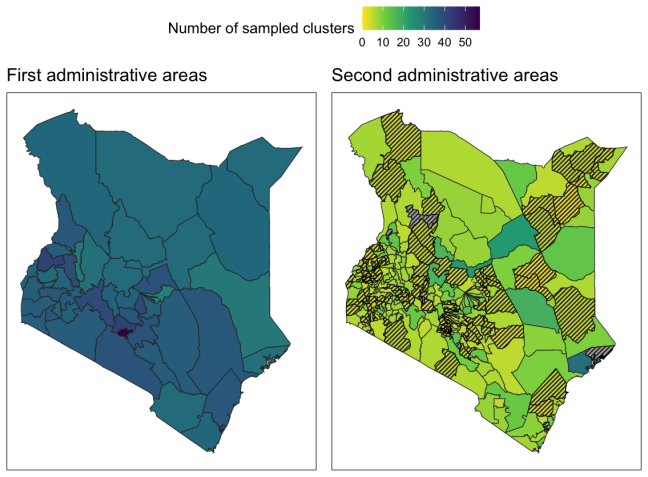
- The method applies to estimating domain-level health indicators such as height-for-age z-scores using DHS data.
Where Pith is reading between the lines
- Other complex survey designs may require analogous derivations to avoid relying on invalid chi-squared assumptions.
- Adopting variance smoothing could become standard practice in small area estimation for national health surveys with small domains.
- The equivalence in performance suggests prioritizing implementability when choosing between the two distributions.
- This work underscores the importance of matching statistical assumptions to the actual sampling design in survey data analysis.
Load-bearing premise
The sampling distributions are derived under strong assumptions about the superpopulation and the specific stratified two-stage clustering design used by DHS surveys.
What would settle it
Simulations under the exact DHS sampling design assumptions where the observed distribution of design variance estimators fails to match the derived simple or complex sampling distributions.
Figures


read the original abstract
Fay-Herriot (FH) models with variance smoothing typically use chi-squared sampling distributions for the design variance estimators. This choice is only valid under strong assumptions on the population and the sampling design, and the choice of sampling distribution is understudied for complex survey designs such as the stratified two-stage clustering design used by the Demographic and Health Surveys (DHS). DHS conducts surveys in low- and middle-income countries and result in low sample sizes for unplanned domains of interest. Thus, accounting for the uncertainty in the estimated design variances is important. We derive two sampling distributions under the DHS design, a simple and a more complex, while clearly specifying and discussing the required superpopulation and design assumptions. In a simulation study, we compare the two sampling distributions to the empirical sampling distributions, and the resulting FH models with variance smoothing to the standard FH model. We find that the standard model exhibits undercoverage, while the variance smoothing models produce better credible intervals according to proper scoring rules. Interestingly, the simple sampling distribution, which is easiest to implement, performs equally as well as the more complex sampling distribution. We illustrate the proposed models by estimating height-for-age z-scores using the 2022 Kenya DHS.
Editorial analysis
A structured set of objections, weighed in public.
Referee Report
Summary. The paper derives two sampling distributions (simple and complex) for design-based variance estimators under the stratified two-stage cluster sampling of DHS surveys, with explicit superpopulation and design assumptions stated. A simulation study compares these distributions to empirical sampling distributions generated under the same design and evaluates the resulting variance-smoothed Fay-Herriot models against the standard chi-squared choice using proper scoring rules for credible intervals. The standard model shows undercoverage while the proposed models improve interval performance, with the simple distribution performing equally well as the complex one. The approach is illustrated by estimating height-for-age z-scores from the 2022 Kenya DHS.
Significance. If the derivations hold under the stated assumptions, the work addresses a genuine gap in small-area estimation for complex surveys by providing alternatives to the chi-squared sampling distribution, which the abstract notes is valid only under strong assumptions. The explicit discussion of assumptions, the direct simulation check against empirical distributions, and the finding that the simpler distribution suffices are strengths that enhance practical utility. The use of proper scoring rules for evaluating credible intervals adds rigor, and the DHS application demonstrates relevance for low-sample domains in low- and middle-income country surveys.
major comments (1)
- [Simulation study] Simulation study: the central claim that the simple sampling distribution performs equally as well as the more complex one (and both outperform the standard model) rests on proper scoring rule comparisons; the manuscript should report the actual numerical scores, coverage probabilities, and any differences in a table to allow assessment of whether equivalence holds across metrics or if small but systematic differences exist.
minor comments (3)
- The abstract refers to 'proper scoring rules' without naming them (e.g., CRPS or logarithmic score); specify the exact rules and their implementation in the methods or simulation section for reproducibility.
- [Assumptions discussion] A summary table or dedicated paragraph listing the superpopulation and design assumptions required for each of the two derived distributions would improve clarity and help readers evaluate applicability to other surveys.
- Consider adding a short comparison to existing literature on variance smoothing or sampling distributions in Fay-Herriot models to better position the novelty of the two new distributions.
Simulated Author's Rebuttal
We thank the referee for their positive and constructive review, which recommends minor revision. We address the single major comment below and will incorporate the suggested changes into the revised manuscript.
read point-by-point responses
-
Referee: [Simulation study] Simulation study: the central claim that the simple sampling distribution performs equally as well as the more complex one (and both outperform the standard model) rests on proper scoring rule comparisons; the manuscript should report the actual numerical scores, coverage probabilities, and any differences in a table to allow assessment of whether equivalence holds across metrics or if small but systematic differences exist.
Authors: We agree that including the numerical results would strengthen the presentation and allow readers to directly assess the claimed equivalence. In the revised manuscript we will add a table (or expanded table) in the simulation study section that reports the actual proper scoring rule values (e.g., CRPS or log score), empirical coverage probabilities, and the observed differences between the standard chi-squared model, the simple sampling distribution, and the complex sampling distribution. This will make the performance comparisons fully transparent. revision: yes
Circularity Check
No significant circularity detected
full rationale
The paper explicitly derives two sampling distributions (simple and complex) for design-based variance estimators under the DHS stratified two-stage clustering design, stating the required superpopulation and design assumptions in the abstract and full text. These derivations are presented as new contributions, with the standard chi-squared choice identified as valid only under strong assumptions that the authors relax. The simulation directly generates empirical sampling distributions under the same design to compare against the derived forms, and evaluates the resulting variance-smoothed Fay-Herriot models via proper scoring rules against the standard model. No step reduces a prediction or central claim to a fitted input, self-citation, or definitional equivalence; the chain is externally validated by simulation and remains self-contained.
Axiom & Free-Parameter Ledger
axioms (1)
- domain assumption Strong assumptions on the population and sampling design required for the derived sampling distributions to be valid
Reference graph
Works this paper leans on
-
[1]
Bernton, E., Jacob, P. E., Gerber, M., and Robert, C. P. (2019). On parameter estimation with the Wasserstein distance.Information and Inference: A Journal of the IMA, 8(4):657–676. Besag, J., York, J., and Molli´e, A. (1991). Bayesian image restoration, with two applications in spatial statistics.Annals of the Institute of Statistical Mathematics, 43:1–2...
work page 2019
-
[2]
An essay on the logical foundations of survey sampling, part I
Earth Observation Group, NOAA National Centers for Environmental Information (2022). VIIRS nighttime lights version 2 annual composites.https://eogdata.mines.edu/products/vnl/. Accessed: 2026-02-16. Erciulescu, A. L., Cruze, N. B., and Nandram, B. (2019). Model-based county level crop estimates incorporating auxiliary sources of information.Journal of the...
work page 2022
discussion (0)
Sign in with ORCID, Apple, or X to comment. Anyone can read and Pith papers without signing in.