From short-lived to long-lived clouds: impact of star formation models on giant molecular cloud evolution in simulations of an NGC 300-like galaxy
Pith reviewed 2026-05-07 15:39 UTC · model grok-4.3
The pith
The choice of star formation model in galaxy simulations determines whether giant molecular clouds live for 20 million years or over 200 million years.
A machine-rendered reading of the paper's core claim, the machinery that carries it, and where it could break.
Core claim
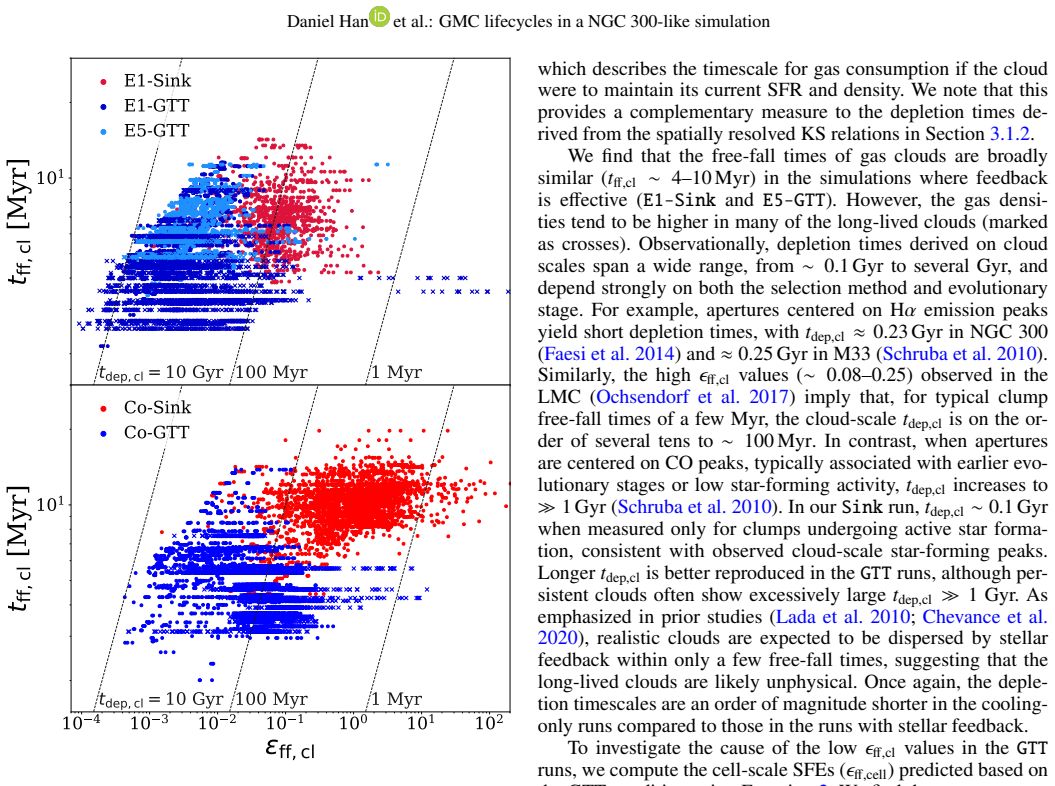
In simulations of an NGC 300-like galaxy, the sink-particle star formation model produces GMC lifetimes of about 20-30 Myr with SFEs per free-fall time of a few percent, consistent with observations, while the GTT model yields long-lived clouds with lifetimes exceeding 200 Myr due to very low SFEs below 0.003 that make stellar feedback ineffective. Cloud mergers extend lifetimes and integrated SFEs in both cases, and both models match the observed Kennicutt-Schmidt relation with depletion times of a few Gyr.
What carries the argument
The star formation prescription, either sink particles or the gravo-thermo-turbulent (GTT) condition, which sets the star formation efficiency per free-fall time and thereby controls whether stellar feedback can disperse the clouds.
If this is right
- Cloud-cloud mergers increase GMC lifetimes and integrated star formation efficiencies by extending the star-forming period, though they barely affect instantaneous efficiencies.
- Both star formation models reproduce the observed Kennicutt-Schmidt relation within scatter, giving gas depletion times of a few Gyr.
- An extreme feedback model with boosted supernova energy, combined with the GTT prescription, overly suppresses star formation leading to depletion times of 6-20 Gyr.
- Global star formation rates are bursty and self-regulated at 0.1-0.5 solar masses per year in the sink model.
Where Pith is reading between the lines
- Improved star formation models that capture clump-scale processes realistically could resolve the discrepancy between simulated and observed cloud lifetimes.
- Since the isolated galaxy setup omits external gas accretion, including inflows might alter the longevity of clouds in the GTT model.
- These findings suggest that subgrid star formation prescriptions in cosmological simulations need calibration against resolved GMC observations to avoid biasing galaxy evolution predictions.
- Testing the models against multi-wavelength observations of molecular and ionized gas in other spiral galaxies could distinguish which prescription better matches reality.
Load-bearing premise
The assumption that the extremely low star formation efficiency per free-fall time in the GTT model reflects physical reality rather than an artifact of the prescription.
What would settle it
Direct measurement of GMC lifetimes in an NGC 300-like galaxy through multi-wavelength observations of molecular and ionized gas to see if they disperse within 20-30 Myr or persist much longer.
Figures




read the original abstract
Multi-wavelength observations of molecular and ionized gas indicate that GMCs are short-lived, generally dispersing within one or two dynamical timescales. To investigate the physical origin of these short lifetimes and the role of star formation prescriptions, we conduct radiation-hydrodynamic simulations of an NGC 300-like disk galaxy with RAMSES-RT. We compare two distinct star formation models, one based on a local gravo-thermo-turbulent (GTT) condition and the other employing sink particles, to examine how star formation and feedback collectively regulate GMC evolution. The sink-particle-based model yields bursty yet self-regulated global star formation rates of $0.1$-$0.5$ $M_{\odot}\,yr^{-1}$ and produces GMC lifetimes of $\sim20$-$30$ Myr, with star formation efficiencies (SFEs) per free-fall time of a few percent, consistent with observations. In contrast, the GTT model generates a population of long-lived clouds with lifetimes $\gtrsim200$ Myr, owing to the extremely low SFEs per free-fall time $(\lesssim3\times10^{-3})$, which renders stellar feedback ineffective. With both models, cloud-cloud mergers extend the lifetimes of GMCs and increase their integrated SFEs by lengthening the star-forming duty cycle, while having only a minor impact on instantaneous efficiencies. On galactic scales, both models broadly reproduce the observed KS relation within its scatter, yielding gas depletion times of a few Gyr. In comparison, an extreme feedback model with the supernova energy boosted by a factor of five, combined with the GTT star formation model, excessively suppresses star formation and produces much longer depletion times ($6$-$20$ Gyr) for this isolated system. These results demonstrate that GMC lifecycles are strongly governed by the adopted star formation model, highlighting the need for improved prescriptions that realistically capture clump-scale star formation.
Editorial analysis
A structured set of objections, weighed in public.
Referee Report
Summary. The manuscript reports radiation-hydrodynamic simulations of an NGC 300-like galaxy using RAMSES-RT, comparing a gravo-thermo-turbulent (GTT) star formation prescription against a sink-particle model. The sink model produces bursty but self-regulated global SFRs of 0.1-0.5 M⊙ yr⁻¹, GMC lifetimes of ~20-30 Myr, and SFEs per free-fall time of a few percent, consistent with observations; the GTT model instead yields long-lived clouds (lifetimes ≳200 Myr) due to extremely low SFEs (≲3×10^{-3}) that render feedback ineffective. Both models reproduce the KS relation within scatter (gas depletion times of a few Gyr), while cloud-cloud mergers extend lifetimes and integrated SFEs in either case. An extreme-feedback variant with boosted supernova energy is also tested. The central conclusion is that GMC lifecycles are strongly governed by the adopted star formation model.
Significance. If the results hold, the work demonstrates the strong sensitivity of simulated GMC lifetimes and duty cycles to subgrid star formation prescriptions, providing a clear illustration of why improved clump-scale models are needed. The direct side-by-side comparison in an otherwise identical RAMSES-RT setup, the reproduction of the observed KS relation, and the explicit quantification of merger effects on integrated SFE are strengths that would be useful to the community. The isolated-disk configuration and lack of external accretion, however, limit the generality of the 'strongly governed' claim.
major comments (2)
- [Abstract] Abstract: the central claim that GMC lifecycles are 'strongly governed' by the star formation model rests on the isolated NGC 300-like disk setup. The text notes that cloud-cloud mergers lengthen lifetimes and integrated SFEs, but does not examine or quantify the effect of continuous external gas accretion from larger-scale flows (present in real galaxies and potentially able to shorten the long-lived GTT clouds or change the relative impact of the two prescriptions). This is load-bearing for the comparison because the absence of inflows is an explicit modeling choice that could alter the reported ~20-30 Myr vs. ≳200 Myr distinction.
- [Abstract] Abstract and implied Methods: the reported lifetime and SFE differences are presented without mention of numerical convergence tests, resolution studies, or error analysis on the lifetime measurements themselves. Given that the GTT result hinges on an extremely low SFE per free-fall time (≲3×10^{-3}) making feedback ineffective, verification that this outcome is robust to resolution, time-stepping, or the precise implementation of the GTT threshold is required to support the conclusion that the difference is physical rather than numerical.
minor comments (2)
- The abstract would be clearer if it stated the precise numerical range or median SFE per free-fall time obtained in the sink-particle runs (rather than 'a few percent') to facilitate direct comparison with observations and the GTT value.
- The extreme-feedback experiment (SN energy boosted by ×5) is mentioned only briefly; a short additional sentence on how this variant was initialized relative to the fiducial GTT run would improve reproducibility.
Simulated Author's Rebuttal
We thank the referee for their detailed and constructive report on our manuscript. We address each of the major comments below and have incorporated revisions to improve the clarity and robustness of our findings.
read point-by-point responses
-
Referee: [Abstract] Abstract: the central claim that GMC lifecycles are 'strongly governed' by the star formation model rests on the isolated NGC 300-like disk setup. The text notes that cloud-cloud mergers lengthen lifetimes and integrated SFEs, but does not examine or quantify the effect of continuous external gas accretion from larger-scale flows (present in real galaxies and potentially able to shorten the long-lived GTT clouds or change the relative impact of the two prescriptions). This is load-bearing for the comparison because the absence of inflows is an explicit modeling choice that could alter the reported ~20-30 Myr vs. ≳200 Myr distinction.
Authors: We thank the referee for highlighting this important limitation of our isolated disk setup. Our simulations are intentionally configured as an isolated galaxy to isolate the effects of the star formation prescription on GMC evolution without the influence of external gas flows. This allows for a direct comparison between the two models under identical conditions. We agree that in real galaxies, continuous accretion could potentially replenish gas in long-lived clouds and alter their lifetimes. We have revised the abstract and added a dedicated paragraph in the Discussion section to explicitly state that our conclusions apply to isolated systems and to discuss how external accretion might modify the results, particularly for the GTT model. Nevertheless, the large difference in lifetimes between the models is primarily due to the internal regulation by star formation and feedback, suggesting the sensitivity to the SF model would remain a key factor even with accretion. revision: partial
-
Referee: [Abstract] Abstract and implied Methods: the reported lifetime and SFE differences are presented without mention of numerical convergence tests, resolution studies, or error analysis on the lifetime measurements themselves. Given that the GTT result hinges on an extremely low SFE per free-fall time (≲3×10^{-3}) making feedback ineffective, verification that this outcome is robust to resolution, time-stepping, or the precise implementation of the GTT threshold is required to support the conclusion that the difference is physical rather than numerical.
Authors: We acknowledge that the original manuscript did not present explicit numerical convergence tests or error analysis for the GMC lifetime measurements. To address this, we have conducted additional simulations at higher resolution (increasing the maximum refinement level by one) and verified that the qualitative differences persist: the sink model continues to produce short-lived clouds (~20-30 Myr) while the GTT model yields long-lived ones (≳200 Myr) with similarly low SFEs. We have included these results in a new appendix. For the lifetime measurements, we have added an error analysis based on the temporal sampling of simulation outputs and the cloud tracking algorithm, estimating uncertainties of approximately 10-20% in the median lifetimes. Additionally, we tested the sensitivity to the GTT threshold parameters and found the results robust. These revisions confirm that the reported differences are physical rather than numerical artifacts. revision: yes
Circularity Check
No circularity: results from direct comparison of independent simulation models
full rationale
The paper reports outcomes from radiation-hydrodynamic simulations run with two distinct star formation prescriptions (GTT condition vs. sink particles) in the same isolated NGC 300-like disk. GMC lifetimes, SFEs, and KS relation are measured directly from the evolved simulation states rather than being fitted parameters or redefined quantities. No self-citations, ansatzes, or uniqueness theorems are invoked to force the central claim that lifecycles are governed by the SF model; the differences emerge from the model implementations themselves. The derivation chain is therefore self-contained against external benchmarks.
Axiom & Free-Parameter Ledger
free parameters (1)
- Star formation efficiency per free-fall time =
few percent or <0.003
axioms (1)
- domain assumption Radiation hydrodynamics in RAMSES-RT accurately models gas dynamics, cooling, and stellar feedback in galactic disks
Reference graph
Works this paper leans on
-
[1]
& Kravtsov, A
Agertz, O. & Kravtsov, A. V . 2015, ApJ, 804, 18
2015
-
[2]
2021, MNRAS, 503, 5826
Agertz, O., Renaud, F., Feltzing, S., et al. 2021, MNRAS, 503, 5826
2021
-
[3]
R., Bonnell, I
Bate, M. R., Bonnell, I. A., & Price, N. M. 1995, MNRAS, 277, 362
1995
-
[4]
M., Wadsley, J
Benincasa, S. M., Wadsley, J. W., Couchman, H. M. P., Pettitt, A. R., & Tasker, E. J. 2019, MNRAS, 486, 5022
2019
-
[5]
2023, MNRAS, 523, 6336
Bieri, R., Naab, T., Geen, S., et al. 2023, MNRAS, 523, 6336
2023
-
[6]
2008, AJ, 136, 2846
Bigiel, F., Leroy, A., Walter, F., et al. 2008, AJ, 136, 2846
2008
-
[7]
F., Eracleous, M., et al
Binder, B., Williams, B. F., Eracleous, M., et al. 2012, ApJ, 758, 15
2012
-
[8]
A., Williams, R., Payne, J., et al
Binder, B. A., Williams, R., Payne, J., et al. 2024, ApJ, 969, 97
2024
-
[9]
& Teyssier, R
Bleuler, A. & Teyssier, R. 2014, MNRAS, 445, 4015
2014
-
[10]
2015, Computational As- trophysics and Cosmology, 2, 5
Bleuler, A., Teyssier, R., Carassou, S., & Martizzi, D. 2015, Computational As- trophysics and Cosmology, 2, 5
2015
-
[11]
M., Agertz, O., Kravtsov, A
Booth, C. M., Agertz, O., Kravtsov, A. V ., & Gnedin, N. Y . 2013, ApJ, 777, L16
2013
-
[12]
& Schmidt, W
Braun, H. & Schmidt, W. 2015, MNRAS, 454, 1545
2015
-
[13]
2009, ApJ, 700, 309
Bresolin, F., Gieren, W., Kudritzki, R.-P., et al. 2009, ApJ, 700, 309
2009
-
[14]
2020, ApJ, 896, L34
Brucy, N., Hennebelle, P., Bournaud, F., & Colling, C. 2020, ApJ, 896, L34
2020
-
[15]
Chevalier, R. A. & Clegg, A. W. 1985, Nature, 317, 44
1985
-
[16]
Chevance, M., Kruijssen, J. M. D., Hygate, A. P. S., et al. 2020, MNRAS, 493, 2872
2020
-
[17]
Chevance, M., Kruijssen, J. M. D., Krumholz, M. R., et al. 2022, MNRAS, 509, 272
2022
-
[18]
A., Leitherer, C., & Chen, Y
Chisholm, J., Tremonti, C. A., Leitherer, C., & Chen, Y . 2017, MNRAS, 469, 4831
2017
-
[19]
2024, MNRAS, 531, 4045
Choi, W., Bureau, M., Liu, L., et al. 2024, MNRAS, 531, 4045
2024
-
[20]
& Povich, M
Chomiuk, L. & Povich, M. S. 2011, AJ, 142, 197
2011
-
[21]
F., McKee, C
Cioffi, D. F., McKee, C. F., & Bertschinger, E. 1988, ApJ, 334, 252
1988
-
[22]
2014, ApJ, 784, 3
Colombo, D., Hughes, A., Schinnerer, E., et al. 2014, ApJ, 784, 3
2014
-
[23]
2017, A&A, 601, A146
Corbelli, E., Braine, J., Bandiera, R., et al. 2017, A&A, 601, A146
2017
-
[24]
& Dubois, Y
Dashyan, G. & Dubois, Y . 2020, A&A, 638, A123 de los Reyes, M. A. C. & Kennicutt, Jr., R. C. 2019, ApJ, 872, 16
2020
-
[25]
& Silk, J
Dekel, A. & Silk, J. 1986, ApJ, 303, 39 Del Zanna, G., Dere, K. P., Young, P. R., & Landi, E. 2021, ApJ, 909, 38 Di Teodoro, E. M., McClure-Griffiths, N. M., De Breuck, C., et al. 2019, ApJ, 885, L32
1986
-
[26]
L., Pringle, J
Dobbs, C. L., Pringle, J. E., & Duarte-Cabral, A. 2015, MNRAS, 446, 3608
2015
-
[27]
Draine, B. T. 2011, Physics of the Interstellar and Intergalactic Medium
2011
-
[28]
2021, A&A, 651, A109
Dubois, Y ., Beckmann, R., Bournaud, F., et al. 2021, A&A, 651, A109
2021
-
[29]
2014, MNRAS, 444, 1453
Dubois, Y ., Pichon, C., Welker, C., et al. 2014, MNRAS, 444, 1453
2014
-
[30]
K., Steidel, C
Erb, D. K., Steidel, C. C., Trainor, R. F., et al. 2014, ApJ, 795, 33
2014
-
[31]
M., Lada, C
Faesi, C. M., Lada, C. J., & Forbrich, J. 2018, ApJ, 857, 19
2018
-
[32]
M., Lada, C
Faesi, C. M., Lada, C. J., Forbrich, J., Menten, K. M., & Bouy, H. 2014, ApJ, 789, 81
2014
-
[33]
2010, MNRAS, 406, 2267
Fakhouri, O., Ma, C.-P., & Boylan-Kolchin, M. 2010, MNRAS, 406, 2267
2010
-
[34]
& Klessen, R
Federrath, C. & Klessen, R. S. 2012, ApJ, 761, 156
2012
-
[35]
Federrath, C., Sur, S., Schleicher, D. R. G., Banerjee, R., & Klessen, R. S. 2011, ApJ, 731, 62
2011
-
[36]
J., Korista, K
Ferland, G. J., Korista, K. T., Verner, D. A., et al. 1998, PASP, 110, 761 Flores Velázquez, J. A., Gurvich, A. B., Faucher-Giguère, C.-A., et al. 2021, MNRAS, 501, 4812
1998
-
[37]
2021, PASJ, 73, S1
Fukui, Y ., Habe, A., Inoue, T., Enokiya, R., & Tachihara, K. 2021, PASJ, 73, S1
2021
-
[38]
2008, ApJS, 178, 56
Fukui, Y ., Kawamura, A., Minamidani, T., et al. 2008, ApJS, 178, 56
2008
-
[39]
2014, ApJ, 780, 36
Fukui, Y ., Ohama, A., Hanaoka, N., et al. 2014, ApJ, 780, 36
2014
-
[40]
2018, ApJ, 859, 166
Fukui, Y ., Torii, K., Hattori, Y ., et al. 2018, ApJ, 859, 166
2018
-
[41]
R., Ohama, A., et al
Furukawa, N., Dawson, J. R., Ohama, A., et al. 2009, ApJ, 696, L115
2009
-
[42]
2021, MNRAS, 504, 1902
Garel, T., Blaizot, J., Rosdahl, J., et al. 2021, MNRAS, 504, 1902
2021
-
[43]
2017, MNRAS, 466, 1903
Gatto, A., Walch, S., Naab, T., et al. 2017, MNRAS, 466, 1903
2017
-
[44]
2023, MNRAS, 526, 1832
Geen, S., Bieri, R., de Koter, A., Kimm, T., & Rosdahl, J. 2023, MNRAS, 526, 1832
2023
-
[45]
2018, MNRAS, 479, 3042
Girichidis, P., Naab, T., Hanasz, M., & Walch, S. 2018, MNRAS, 479, 3042
2018
-
[46]
& Ostriker, E
Gong, H. & Ostriker, E. C. 2013, ApJS, 204, 8
2013
-
[47]
J., et al
Gratier, P., Braine, J., Rodriguez-Fernandez, N. J., et al. 2012, A&A, 542, A108
2012
-
[48]
Grisdale, K., Agertz, O., Renaud, F., & Romeo, A. B. 2018, MNRAS, 479, 3167 Grudi´c, M. Y ., Guszejnov, D., Offner, S. S. R., et al. 2022, MNRAS, 512, 216 Grudi´c, M. Y ., Hopkins, P. F., Faucher-Giguère, C.-A., et al. 2018, MNRAS, 475, 3511
2018
-
[49]
& Teyssier, R
Guillet, T. & Teyssier, R. 2011, Journal of Computational Physics, 230, 4756
2011
-
[50]
& Madau, P
Haardt, F. & Madau, P. 2012, ApJ, 746, 125
2012
-
[51]
2022, ApJ, 935, 53
Han, D., Kimm, T., Katz, H., Devriendt, J., & Slyz, A. 2022, ApJ, 935, 53
2022
-
[52]
Han, S., Yi, S. K., Dubois, Y ., et al. 2025, arXiv e-prints, arXiv:2507.06301
-
[53]
J., Tasker, E
Haworth, T. J., Tasker, E. J., Fukui, Y ., et al. 2015, MNRAS, 450, 10
2015
-
[54]
T., Kruijssen, J
Haydon, D. T., Kruijssen, J. M. D., Chevance, M., et al. 2020, MNRAS, 498, 235
2020
-
[55]
2004, ApJS, 154, 253
Helou, G., Roussel, H., Appleton, P., et al. 2004, ApJS, 154, 253
2004
-
[56]
& Chabrier, G
Hennebelle, P. & Chabrier, G. 2011, ApJ, 743, L29
2011
-
[57]
& Inutsuka, S.-i
Hennebelle, P. & Inutsuka, S.-i. 2019, Frontiers in Astronomy and Space Sci- ences, 6, 5
2019
-
[58]
& Dame, T
Heyer, M. & Dame, T. M. 2015, ARA&A, 53, 583
2015
-
[59]
Heyer, M., Krawczyk, C., Duval, J., & Jackson, J. M. 2009, ApJ, 699, 1092
2009
-
[60]
H., Carpenter, J
Heyer, M. H., Carpenter, J. M., & Snell, R. L. 2001, ApJ, 551, 852
2001
-
[61]
F., Chan, T
Hopkins, P. F., Chan, T. K., Ji, S., et al. 2021, MNRAS, 501, 3640
2021
-
[62]
F., Narayanan, D., & Murray, N
Hopkins, P. F., Narayanan, D., & Murray, N. 2013, MNRAS, 432, 2647
2013
-
[63]
F., Wetzel, A., Kereš, D., et al
Hopkins, P. F., Wetzel, A., Kereš, D., et al. 2018, MNRAS, 480, 800
2018
-
[64]
2024, MNRAS, 527, 10077
Horie, S., Okamoto, T., & Habe, A. 2024, MNRAS, 527, 10077
2024
-
[65]
E., Colombo, D., et al
Hughes, A., Meidt, S. E., Colombo, D., et al. 2013, ApJ, 779, 46 Article number, page 22 of 24 Daniel Han et al.: GMC lifecycles in a NGC 300-like simulation
2013
-
[66]
2010, MNRAS, 406, 2065 Ibáñez-Mejía, J
Hughes, A., Wong, T., Ott, J., et al. 2010, MNRAS, 406, 2065 Ibáñez-Mejía, J. C., Mac Low, M.-M., Klessen, R. S., & Baczynski, C. 2017, ApJ, 850, 62
2010
-
[67]
Jeffreson, S. M. R., Kruijssen, J. M. D., Krumholz, M. R., & Longmore, S. N. 2018, MNRAS, 478, 3380
2018
-
[68]
Jeffreson, S. M. R., Semenov, V . A., & Krumholz, M. R. 2024, MNRAS, 527, 7093
2024
-
[69]
2025, A&A, 693, A149
Kang, C., Kimm, T., Han, D., et al. 2025, A&A, 693, A149
2025
-
[70]
2019, MNRAS, 485, 117
Kannan, R., V ogelsberger, M., Marinacci, F., et al. 2019, MNRAS, 485, 117
2019
-
[71]
Katz, H., Kimm, T., Sijacki, D., & Haehnelt, M. G. 2017, MNRAS, 468, 4831
2017
-
[72]
Katz, H., Liu, S., Kimm, T., et al. 2022, arXiv e-prints, arXiv:2211.04626
-
[73]
P., Cadiou, C., Kimm, T., & Agertz, O
Katz, H., Rey, M. P., Cadiou, C., Kimm, T., & Agertz, O. 2024, arXiv e-prints, arXiv:2411.07282
-
[74]
2009, ApJS, 184, 1
Kawamura, A., Mizuno, Y ., Minamidani, T., et al. 2009, ApJS, 184, 1
2009
-
[75]
Kennicutt, R. C. & Evans, N. J. 2012, ARA&A, 50, 531
2012
-
[76]
Kennicutt, Jr., R. C. 1998, ARA&A, 36, 189
1998
-
[77]
C., Calzetti, D., Walter, F., et al
Kennicutt, Jr., R. C., Calzetti, D., Walter, F., et al. 2007, ApJ, 671, 333
2007
-
[78]
& Ostriker, E
Kim, C.-G. & Ostriker, E. C. 2015, ApJ, 802, 99
2015
-
[79]
& Ostriker, E
Kim, C.-G. & Ostriker, E. C. 2017, ApJ, 846, 133
2017
-
[80]
Kim, J., Chevance, M., Kruijssen, J. M. D., et al. 2021, MNRAS, 504, 487
2021
discussion (0)
Sign in with ORCID, Apple, or X to comment. Anyone can read and Pith papers without signing in.