A Novel Exact Inference Approach for Log-Logistic Reliability Functions with Applications to Time-to-Event Data
Pith reviewed 2026-05-09 18:35 UTC · model grok-4.3
The pith
Least squares-based generalized pivotal quantities enable exact inference for log-logistic reliability functions in small samples.
A machine-rendered reading of the paper's core claim, the machinery that carries it, and where it could break.
Core claim
A new inference framework based on the least squares estimator-based generalized pivotal quantities (LSE-GPQ) is proposed for the parameters and reliability functions of the log-logistic distribution, which can provide better coverage in small sample scenarios.
What carries the argument
Least squares estimator-based generalized pivotal quantities (LSE-GPQ), which derive pivotal quantities directly from least squares estimators to construct confidence intervals for the reliability function and model parameters.
If this is right
- The LSE-GPQ intervals achieve higher or nominal coverage probabilities than MLE and parametric bootstrap methods in small-sample simulations.
- The method applies directly to reliability function estimation for time-to-event data in electrical, electronic, and mechanical engineering.
- Real data applications confirm that the approach yields usable interval estimates where traditional methods may underperform.
- The framework extends the use of generalized pivotal quantities beyond maximum likelihood estimators to least squares estimators for this distribution.
Where Pith is reading between the lines
- The same LSE-GPQ construction might be adapted to other lifetime distributions that lack closed-form MLEs, though this would require fresh derivation of the pivotal quantities.
- Because the method relies on simulation to verify coverage, its practical deployment would benefit from automated software that recomputes the pivotal quantities for each new data set.
- If the small-sample advantage holds, reliability engineers could reduce the number of failure observations needed to reach a target precision level.
Load-bearing premise
The specific form of the LSE-GPQ construction produces coverage properties that remain exact or superior to alternatives when sample sizes are small.
What would settle it
Monte Carlo simulations in which the empirical coverage of the LSE-GPQ intervals falls materially below the nominal level for small samples drawn from the log-logistic distribution would falsify the performance claim.
Figures


read the original abstract
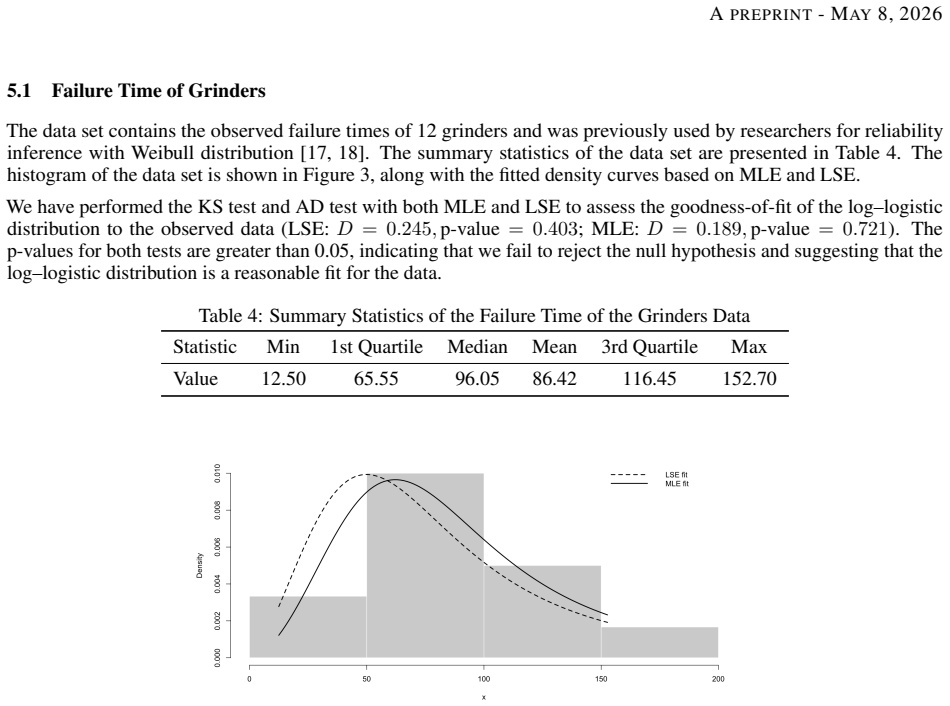
Log-logistic distribution is a flexible distribution that can model a wide range of failure patterns in the field of electrical, electronic and mechanical engineering and is often used in reliability inference. However, the inference of the parameters and reliability function of the log-logistic distribution can be challenging, especially in small sample scenarios. In this paper, we propose a new inference framework based on the least squares estimator-based generalized pivotal quantities (LSE-GPQ) for the parameters and reliability functions of the log-logistic distribution, which can provide better coverage in small sample scenarios. We will compare the performance of our proposed method with traditional methods such as the MLE and parametric bootstrapping through simulation studies and real data applications.
Editorial analysis
A structured set of objections, weighed in public.
Referee Report
Summary. The manuscript proposes a new inference framework based on least squares estimator-based generalized pivotal quantities (LSE-GPQ) for the parameters and reliability function R(t) of the log-logistic distribution. It claims that this yields exact or superior frequentist coverage in small samples relative to MLE and parametric bootstrap, with supporting evidence from simulation studies and real-data applications.
Significance. If the LSE-GPQ construction is shown to be parameter-free and the simulations confirm nominal coverage across relevant small-sample regimes, the method would provide a useful exact-inference tool for reliability analysis of time-to-event data in engineering contexts where sample sizes are limited. Generalized pivotal quantities have succeeded for other distributions; a verified extension to the nonlinear reliability function of the log-logistic would be a modest but practical advance.
major comments (2)
- [Methodology / Simulation Studies] The abstract and available text assert that simulation studies demonstrate better coverage, yet no explicit formulas for the LSE-GPQ, no derivation showing the quantity is free of unknown parameters, and no simulation design (sample sizes, parameter grid, t values for R(t)) are supplied. Without these, the central claim that coverage is exact or superior cannot be verified.
- [Section 3 (LSE-GPQ construction)] For the nonlinear functional R(t), the paper must demonstrate that substituting the LSE-GPQs for the scale and shape parameters preserves the parameter-free property; any residual dependence on the true values would render the coverage approximate rather than exact. No such verification is visible in the provided description.
minor comments (1)
- [Abstract] The abstract refers to 'better coverage' without stating the nominal levels (e.g., 95 %) or reporting quantitative coverage probabilities, making the improvement difficult to gauge.
Simulated Author's Rebuttal
We thank the referee for the careful reading and constructive feedback. We agree that greater explicitness is needed in presenting the LSE-GPQ formulas, their parameter-free property, and the simulation design. The revised manuscript will incorporate these clarifications to strengthen the central claims.
read point-by-point responses
-
Referee: [Methodology / Simulation Studies] The abstract and available text assert that simulation studies demonstrate better coverage, yet no explicit formulas for the LSE-GPQ, no derivation showing the quantity is free of unknown parameters, and no simulation design (sample sizes, parameter grid, t values for R(t)) are supplied. Without these, the central claim that coverage is exact or superior cannot be verified.
Authors: We appreciate the referee highlighting the need for more explicit details. While the formulas appear in Section 3, we acknowledge they require clearer presentation. In the revision we will state the explicit LSE-GPQ expressions for the scale and shape parameters and for the reliability function R(t). We will also add a dedicated subsection on the simulation design, specifying sample sizes (n=10, 15, 20, 30), the grid of shape and scale values, and the t values at which R(t) is evaluated. These additions will allow direct verification of the reported coverage properties. revision: yes
-
Referee: [Section 3 (LSE-GPQ construction)] For the nonlinear functional R(t), the paper must demonstrate that substituting the LSE-GPQs for the scale and shape parameters preserves the parameter-free property; any residual dependence on the true values would render the coverage approximate rather than exact. No such verification is visible in the provided description.
Authors: We agree this verification is essential. The LSE-GPQs for the parameters are constructed to be pivotal; because R(t) is a continuous function of those parameters, the composed GPQ remains free of unknown quantities. In the revision we will add an explicit lemma or argument in Section 3 demonstrating this preservation, together with numerical confirmation from the simulations that coverage stays nominal across the parameter grid. This will confirm the exact frequentist coverage for the nonlinear functional. revision: yes
Circularity Check
No significant circularity; LSE-GPQ construction and coverage verification are independent of fitted inputs
full rationale
The paper introduces LSE-GPQ as a new framework for log-logistic parameters and R(t), following the standard generalized pivotal quantity construction from the literature (with Weerahandi as co-author). The central claim of improved small-sample coverage is supported by explicit simulation studies comparing to MLE and parametric bootstrap, rather than by any self-definitional reduction or renaming of a fitted quantity as a prediction. No equation equates the target reliability function to its own estimator by construction, and the simulation design serves as an external check on coverage rather than a tautology. Self-citations to prior GPQ work are present but supply the general method, not the specific log-logistic application or its performance claims.
Axiom & Free-Parameter Ledger
axioms (1)
- domain assumption The log-logistic distribution appropriately models the time-to-event data under consideration.
Reference graph
Works this paper leans on
-
[1]
William Q Meeker, Luis A Escobar, and Francis G Pascual.Statistical methods for reliability data. John Wiley & Sons, 2021
work page 2021
-
[2]
Accelerated degradation tests: modeling and analysis
William Q Meeker, Luis A Escobar, and C Joseph Lu. Accelerated degradation tests: modeling and analysis. Technometrics, 40(2):89–99, 1998
work page 1998
-
[3]
Kamel Rekab. A sampling scheme for estimating the reliability of a series system.IEEE transactions on reliability, 42(2):287–290, 2002
work page 2002
-
[4]
Kamel Rekab, Herbert Thompson, and Wei Wu. A multistage sequential test allocation for software reliability estimation.IEEE Transactions on Reliability, 62(2):424–433, 2013
work page 2013
-
[5]
Samaradasa Weerahandi and Richard A Johnson. Testing reliability in a stress-strength model when x and y are normally distributed.Technometrics, 34(1):83–91, 1992
work page 1992
-
[6]
Marvin Rausand and Arnljot Hoyland.System reliability theory: models, statistical methods, and applications, volume 396. John Wiley & Sons, 2003
work page 2003
-
[7]
Yuhlong Lio, Ding-Geng Chen, HK Tony Ng, and Tzong-Ru Tsai.Bayesian inference and computation in Reliability and Survival Analysis. Springer, 2022
work page 2022
-
[8]
Malwane MA Ananda. Estimation and testing of availability of a parallel system with exponential failure and repair times.Journal of statistical planning and inference, 77(2):237–246, 1999
work page 1999
-
[9]
Bowen Liu and Malwane MA Ananda. A new insight into reliability data modeling with an exponentiated composite exponential-pareto model.Applied Sciences, 13(1):645, 2023
work page 2023
-
[10]
Bowen Liu and Malwane Ananda. Exact statistical inference for quantities of loggamma distribution.Electronic Research Archive, 34(4):2572–2589, 2026
work page 2026
-
[11]
Samaradasa Weerahandi, Malwane MA Ananda, and Osman Dag. An approach for parametric survival anova with application to weibull distribution.Communications in Statistics-Theory and Methods, pages 1–14, 2025
work page 2025
-
[12]
Kahadawala Cooray and Malwane MA Ananda. Analyzing survival data with highly negatively skewed distribution: The gompertz-sinh family.Journal of Applied Statistics, 37(1):1–11, 2010
work page 2010
-
[13]
PhD thesis, University of Nevada, Las Vegas, 2023
Bowen Liu.A Generalized Family of Exponentiated Composite Distributions With Applications to Insurance and Survival Data. PhD thesis, University of Nevada, Las Vegas, 2023
work page 2023
-
[14]
Peter J Smith.Analysis of failure and survival data. Chapman and Hall/CRC, 2017
work page 2017
-
[15]
David Collett.Modelling survival data in medical research. Chapman and Hall/CRC, 2023
work page 2023
-
[16]
Xiang Jia, Saralees Nadarajah, and Bo Guo. Exact Inference on Weibull Parameters With Multiply Type-I Censored Data.IEEE Transactions on Reliability, 67(2):432–445, June 2018
work page 2018
-
[17]
Reliability evaluation for weibull distribution under multiply type-i censoring
Xiang Jia, Ping Jiang, and Bo Guo. Reliability evaluation for weibull distribution under multiply type-i censoring. Journal of Central South University, 22(9):3506–3511, September 2015
work page 2015
-
[18]
N. Balakrishnan and M. Kateri. On the maximum likelihood estimation of parameters of Weibull distribution based on complete and censored data.Statistics & Probability Letters, 78(17):2971–2975, December 2008
work page 2008
-
[19]
Routledge, New York, 2 edition, November 2017
Lee Bain.Statistical Analysis of Reliability and Life-Testing Models: Theory and Methods, Second Edition,. Routledge, New York, 2 edition, November 2017
work page 2017
-
[20]
Lawless.Statistical Models and Methods for Lifetime Data
Jerald F. Lawless.Statistical Models and Methods for Lifetime Data. John Wiley & Sons, January 2011. Google-Books-ID: bvTgR4qbN50C
work page 2011
-
[21]
D. R. Cox.Analysis of Survival Data. Chapman and Hall/CRC, New York, February 2018
work page 2018
-
[22]
Chapman and Hall/CRC, New York, November 2008
Horst Rinne.The Weibull Distribution: A Handbook. Chapman and Hall/CRC, New York, November 2008. 11 APREPRINT- MAY8, 2026
work page 2008
-
[23]
Journal of the American Statistical Association , volume =
Govind S. Mudholkar, Deo Kumar Srivastava, and Georgia D. Kollia. A Generalization of the Weibull Distribution with Application to the Analysis of Survival Data.Journal of the American Statistical Association, 91(436):1575–1583, December 1996. Publisher: Taylor & Francis _eprint: https://www.tandfonline.com/doi/pdf/10.1080/01621459.1996.10476725
-
[24]
McCool.Using the Weibull Distribution: Reliability, Modeling, and Inference
John I. McCool.Using the Weibull Distribution: Reliability, Modeling, and Inference. John Wiley & Sons, August
-
[25]
Google-Books-ID: U_8JtXXyp5MC
-
[26]
Gemai Chen. Generalized log-normal distributions with reliability application.Computational Statistics & Data Analysis, 19(3):309–319, March 1995
work page 1995
-
[27]
M. B. Kline. Suitability of the lognormal distribution for corrective maintenance repair times.Reliability Engineering, 9(2):65–80, January 1984
work page 1984
-
[28]
Shantayan Panda and Min Wang. Bootstrap-Based Control Chart for Percentiles of the Generalized Lognormal Distribution With Reliability Applications.Quality and Reliability Engineering International, 41(4):1329–1349,
-
[29]
_eprint: https://onlinelibrary.wiley.com/doi/pdf/10.1002/qre.3722
-
[30]
María González-Calderón, María Jaenada, and Leandro Pardo. Robust Statistical Inference for Accelerated Life- Tests With One-Shot Devices Under Log-Logistic Distributions.IEEE Transactions on Reliability, 75:954–968, 2026
work page 2026
-
[31]
Caner Tanı¸ s. Record-based transmuted log-logistic distribution: Properties, simulation, and applications to petroleum rock and reactor pump data, September 2025. arXiv:2509.09757 [stat]
-
[32]
Heba S. Mohammed, Osama E. Abo-Kasem, Ahmed Elshahhat, Heba S. Mohammed, Osama E. Abo-Kasem, and Ahmed Elshahhat. Computational analysis of generalized progressive hybrid log-logistic model and its modeling for physics and engineering applications.AIMS Mathematics, 10(5):10709–10739, 2025. Cc_license_type: cc_by Primary_atype: AIMS Mathematics Subject_ter...
work page 2025
-
[33]
Gupta, Olcay Akman, and Sergey Lvin
Ramesh C. Gupta, Olcay Akman, and Sergey Lvin. A Study of Log-Logistic Model in Survival Analysis.Biomet- rical Journal, 41(4):431–443, 1999. _eprint: https://onlinelibrary.wiley.com/doi/pdf/10.1002/%28SICI%291521- 4036%28199907%2941%3A4%3C431%3A%3AAID-BIMJ431%3E3.0.CO%3B2-U
work page 1999
-
[34]
Inference on Survival Reliability with Type-I Censored Weibull data
Bowen Liu, Malwane Ananda, and Sam Weerahandi. Inference on survival reliability with type-i censored weibull data.arXiv preprint arXiv:2604.12011, 2026
work page internal anchor Pith review Pith/arXiv arXiv 2026
-
[35]
L. F. Zhang, M. Xie, and L. C. Tang. A study of two estimation approaches for parameters of Weibull distribution based on WPP.Reliability Engineering & System Safety, 92(3):360–368, March 2007
work page 2007
-
[36]
M Salman Suprawhardana and Sangadji Prayoto. Total time on test plot analysis for mechanical components of the rsg-gas reactor.Atom Indones, 25(2):81–90, 1999
work page 1999
-
[37]
Vikas Kumar Sharma, Sanjay Kumar Singh, and Umesh Singh. A new upside-down bathtub shaped hazard rate model for survival data analysis.Applied Mathematics and Computation, 239:242–253, 2014. 12
work page 2014
discussion (0)
Sign in with ORCID, Apple, or X to comment. Anyone can read and Pith papers without signing in.