A comparative study of two-sample hypothesis tests in the presence of long-term survivors
Pith reviewed 2026-05-08 17:29 UTC · model grok-4.3
The pith
When both groups have long-term survivors, conventional log-rank and some non-PH tests show non-monotonic power as follow-up increases, while parametric models show steadily rising power.
A machine-rendered reading of the paper's core claim, the machinery that carries it, and where it could break.
Core claim
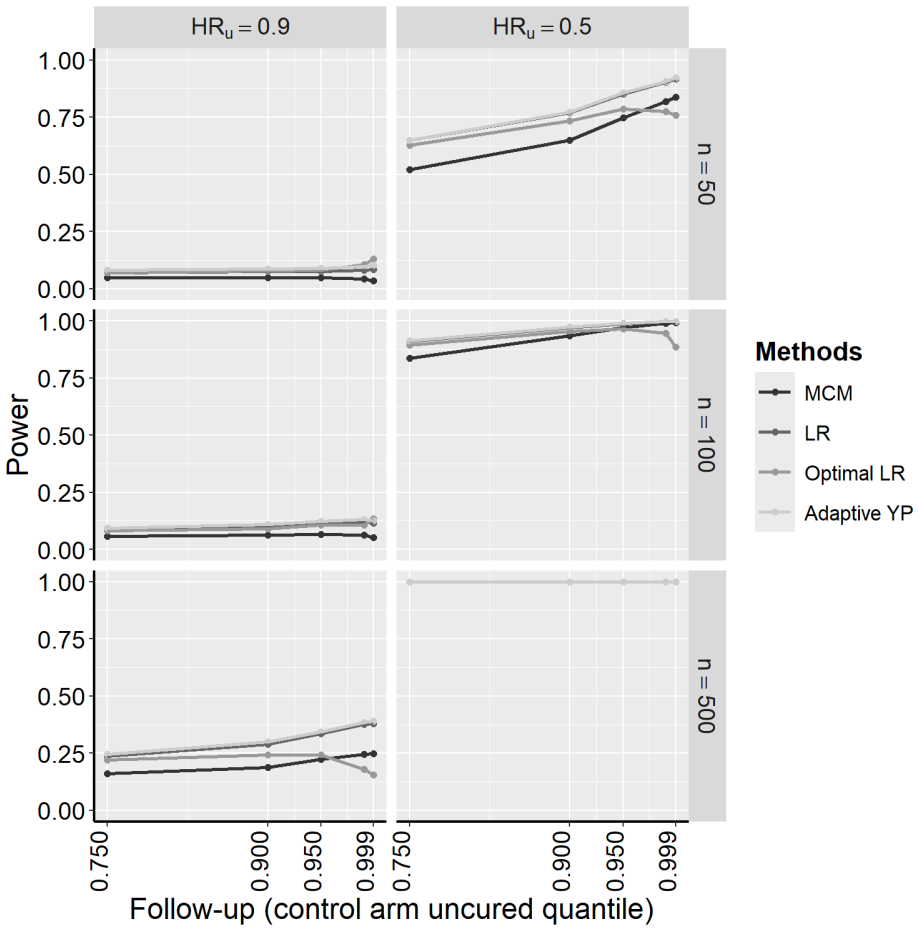
In simulations of time-to-event data with long-term survivors present in both groups, conventional log-rank tests and one non-proportional hazards method produce non-monotonic power as a function of follow-up time, whereas a correctly specified parametric cure model yields monotonic increasing power that reaches its highest value at the longest follow-up time considered.
What carries the argument
Simulation study tracking power and type I error of multiple two-sample tests as functions of follow-up duration when long-term survivors are present in one or both groups.
If this is right
- When both groups contain long-term survivors, power patterns across follow-up remain consistent regardless of sample size.
- Parametric cure models achieve the highest power at the longest follow-up times examined.
- A numerical approach can predict the potential for non-monotonic power before a study begins.
- Conventional methods applied without adjustment can produce unexpected power behavior in the presence of long-term survivors.
Where Pith is reading between the lines
- Planners facing possible long-term survivors in both arms may need to select follow-up duration with the aid of the numerical check rather than defaulting to standard tests.
- The observed non-monotonicity could influence decisions about interim analyses or maximum follow-up in trials where cure fractions are expected.
Load-bearing premise
The chosen simulation data-generating mechanisms match the real behavior of long-term survivors and the parametric model is correctly specified for the scenarios tested.
What would settle it
Finding that log-rank or non-PH test power increases monotonically with follow-up time, or that the parametric model does not achieve the highest power at the longest follow-up, in data generated with long-term survivors in both groups would contradict the central result.
Figures


read the original abstract
Time-to-event data with long-term survivors (L-TS), subjects who never experience the event, have been reported in multiple areas of oncology as therapies have improved. Conventional two-sample tests ignore L-TS, but alternatives have been developed in the cure models literature. Because L-TS can induce non-proportional hazards (non-PH), non-PH candidates also exist. However, there has not been a comprehensive comparison of these candidates. Additionally, follow-up is an important consideration for data with L-TS, but there has been limited study of the impact of follow-up time on performance of two-sample tests with L-TS. We conducted a neutral simulation study of the impact of sample size and follow-up time on type I error and power across varying effect sizes for conventional methods, methods adapted for non-PH, and a correctly-specified parametric model. When one or both groups lack L-TS, log-rank tests and one non-PH method typically have the highest power, but order varies. Surprisingly, when both groups have L-TS, these tests have non-monotonic power as a function of follow-up time, while parametric models have monotonic increasing power and the highest power at the longest follow-up time. While absolute power differs, patterns over follow-up are consistent across sample sizes. To address this for practitioners, we devise a numerical approach to predict the potential for non-monotonicity during study planning. We conclude that na\"ive use of conventional methods can have counterintuitive properties in settings with L-TS, and this work provides knowledge and a tool to anticipate and address these issues.
Editorial analysis
A structured set of objections, weighed in public.
Referee Report
Summary. The manuscript reports a neutral Monte Carlo simulation study comparing conventional log-rank tests, selected non-proportional-hazards procedures, and a correctly-specified parametric mixture-cure model for two-sample testing of time-to-event data that contain long-term survivors. Simulations vary sample size, follow-up duration, cure fractions, and latency distributions; type-I error and power are reported for each configuration. The central empirical finding is that, when both arms contain long-term survivors, log-rank and one non-PH test exhibit non-monotonic power curves with respect to follow-up time, whereas the parametric model yields monotonically increasing power that is highest at the longest follow-up examined. A numerical diagnostic is proposed to anticipate non-monotonicity during study planning.
Significance. If the reported patterns are robust, the work supplies immediately actionable guidance for oncology trial design where long-term survivors are increasingly common. The simulation design is explicitly varied across sample size, follow-up, and effect size and reports both error rates and power, satisfying standard reproducibility expectations for simulation studies. The provision of a planning-stage numerical check for non-monotonicity is a concrete practical contribution.
major comments (2)
- [§3] §3 (Simulation design): the data-generating process is described only at a high level in the abstract and main text. Exact parameter values for cure fractions, latency distributions, and the censoring mechanism (including how administrative censoring at the end of follow-up is implemented) are not tabulated; without these, independent verification of the non-monotonicity result is impossible.
- [§4.2] §4.2 (Power results when both groups contain L-TS): the claim that conventional and one non-PH test display non-monotonic power is load-bearing for the paper’s main message. The manuscript does not report the precise definition of “follow-up time” (e.g., whether it is the administrative censoring time or the maximum observed time) nor the number of Monte Carlo replicates per cell, both of which directly affect whether the observed non-monotonicity is an artifact of the chosen censoring scheme.
minor comments (2)
- [Abstract] The specific non-PH method that exhibits the non-monotonic pattern is referred to only as “one non-PH method” in the abstract; name the procedure (and cite its reference) at first use in the results.
- [Discussion] The numerical approach for predicting non-monotonicity is introduced in the discussion but lacks an explicit algorithm, pseudocode, or worked numerical example; adding one would improve usability.
Simulated Author's Rebuttal
We are grateful to the referee for their thorough review and for recognizing the potential practical value of our findings for oncology trial design. We respond to each major comment in turn and will implement revisions to enhance the manuscript's clarity and reproducibility.
read point-by-point responses
-
Referee: [§3] §3 (Simulation design): the data-generating process is described only at a high level in the abstract and main text. Exact parameter values for cure fractions, latency distributions, and the censoring mechanism (including how administrative censoring at the end of follow-up is implemented) are not tabulated; without these, independent verification of the non-monotonicity result is impossible.
Authors: We concur that the simulation design section would benefit from greater specificity to allow independent verification. In the revised manuscript, we will add a table in §3 that tabulates all key parameters of the data-generating process, including the cure fractions for each group, the specific distributions and parameters for the latency times, and the details of the administrative censoring mechanism. revision: yes
-
Referee: [§4.2] §4.2 (Power results when both groups contain L-TS): the claim that conventional and one non-PH test display non-monotonic power is load-bearing for the paper’s main message. The manuscript does not report the precise definition of “follow-up time” (e.g., whether it is the administrative censoring time or the maximum observed time) nor the number of Monte Carlo replicates per cell, both of which directly affect whether the observed non-monotonicity is an artifact of the chosen censoring scheme.
Authors: We acknowledge that the definition of follow-up time and the Monte Carlo sample size are important for interpreting the power results. We will clarify in the revised §4.2 that follow-up time corresponds to the administrative censoring time, and we will report the number of Monte Carlo replicates per configuration. These details will also be cross-referenced in the simulation design section to address the concern about potential artifacts. revision: yes
Circularity Check
No significant circularity
full rationale
This is a comparative Monte Carlo simulation study of hypothesis tests under mixture cure models with long-term survivors. All central claims (non-monotonic power for log-rank and certain non-PH tests when both groups have cure fractions, monotonic increase and highest power for correctly-specified parametric models at longest follow-up) are direct empirical outputs from the reported data-generating processes and implemented test statistics. No derivations, fitted parameters renamed as predictions, self-citation load-bearing uniqueness theorems, or ansatzes appear in the load-bearing steps. The numerical approach for anticipating non-monotonicity is a straightforward computation from the same model parameters used in the simulations and does not reduce to a tautology. The paper is self-contained against its own controlled benchmarks.
Axiom & Free-Parameter Ledger
Reference graph
Works this paper leans on
-
[1]
Lance Cowey and Christopher D
James Larkin and Vanna Chiarion-Sileni and Rene Gonzalez and Jean Jacques Grob and C. Lance Cowey and Christopher D. Lao and Dirk Schadendorf and Reinhard Dummer and Michael Smylie and Piotr Rutkowski and Grant R. Ferrucci and others , title =. New England Journal of Medicine , year =
-
[2]
Wolchok and Vanna Chiarion-Sileni and Rene Gonzalez and Jean Jacques Grob and Piotr Rutkowski and C
Jedd D. Wolchok and Vanna Chiarion-Sileni and Rene Gonzalez and Jean Jacques Grob and Piotr Rutkowski and C. Lance Cowey and Christopher D. Lao and Dirk Schadendorf and Grant R. Ferrucci and Michael Smylie and Reinhard Dummer and others , title =. Journal of Clinical Oncology , year =
-
[3]
Minimum Follow-Up Time Required for the Estimation of Statistical Cure of Cancer Patients: Verification Using Data from 42 Cancer Sites in the
Patricia Tai and Edward Yu and G. Minimum Follow-Up Time Required for the Estimation of Statistical Cure of Cancer Patients: Verification Using Data from 42 Cancer Sites in the. BMC Cancer , year =
-
[4]
Statistics in Medicine , year =
Richard Sposto , title =. Statistics in Medicine , year =
-
[5]
Gage , title =
Joseph Berkson and Robert P. Gage , title =. Journal of the American Statistical Association , year =
-
[6]
Anthony Y. C. Kuk and Chi-Hse Chen , title =. Biometrika , year =
-
[7]
Judy P. Sy and Jeremy M. G. Taylor , title =. Biometrics , year =. doi:10.1111/j.0006-341X.2000.00227.x , pmid =
-
[8]
Yingwei Peng and Keith B. G. Dear , title =. Biometrics , year =. doi:10.1111/j.0006-341X.2000.00237.x , pmid =
-
[9]
Ibrahim and Debajyoti Sinha , title =
Ming-Hui Chen and Joseph G. Ibrahim and Debajyoti Sinha , title =. Journal of the American Statistical Association , year =
-
[10]
Alexander Tsodikov , title =. Biometrics , year =. doi:10.2307/2533675 , pmid =
-
[11]
Tsodikov and Joseph G
Alexander D. Tsodikov and Joseph G. Ibrahim and Alex Y. Yakovlev , title =. Journal of the American Statistical Association , year =
-
[12]
A General Approach for Cure Models in Survival Analysis , journal =
Valentin Patilea and Ingrid. A General Approach for Cure Models in Survival Analysis , journal =. 2020 , volume =
2020
-
[13]
Haesook Teresa Kim and Robert Gray , title =. Clinical Trials , year =. doi:10.1177/1740774512436614 , pmid =
-
[14]
Statistics in Medicine , year =
Jing Wei and Jianrong Wu , title =. Statistics in Medicine , year =. doi:10.1002/sim.8440 , pmid =
-
[15]
Statistics in Medicine , year =
Jianrong Wu and Jing Wei , title =. Statistics in Medicine , year =. doi:10.1002/sim.9258 , pmid =
-
[16]
Patrick Royston and Mahesh K. B. Parmar , title =. BMC Medical Research Methodology , year =. doi:10.1186/1471-2288-13-152 , pmid =
-
[17]
Journal of Clinical Oncology , year =
Hajime Uno and Brian Claggett and Lu Tian and Eisuke Inoue and Paul Gallo and Toshio Miyata and Deborah Schrag and Masahiro Takeuchi and Yoshiaki Uyama and Lihui Zhao and Hicham Skali and Scott Solomon and Susanna Jacobus and Michael Hughes and Milton Packer and Lee-Jen Wei , title =. Journal of Clinical Oncology , year =. doi:10.1200/JCO.2014.55.2208 , pmid =
-
[18]
Fleming and David P
Thomas R. Fleming and David P. Harrington , title =. 1991 , series =
1991
-
[19]
Patrick Royston and Mahesh K. B. Parmar , title =. BMC Medical Research Methodology , year =. doi:10.1186/s12874-016-0110-x , pmid =
-
[20]
Anderson and Satrajit Roychoudhury and Eric H
Pralay Mukhopadhyay and Jiabu Ye and Keaven M. Anderson and Satrajit Roychoudhury and Eric H. Rubin and Susan Halabi and Richard J. Chappell , title =. JAMA Oncology , year =. doi:10.1001/jamaoncol.2022.2259 , pmid =
-
[21]
Florian Klinglm. A Comparison of Statistical Methods for Time-to-Event Analyses in Randomized Controlled Trials Under Non-Proportional Hazards , journal =. 2025 , volume =. doi:10.1002/sim.70019 , pmid =
-
[22]
Betensky , title =
Rebecca A. Betensky , title =. Clinical Trials , year =
-
[23]
Michael Schemper and Trevor L. Smith , title =. Controlled Clinical Trials , year =. doi:10.1016/0197-2456(96)00075-X , pmid =
-
[24]
Clark and Michael J
Taane G. Clark and Michael J. Bradburn and Sharon B. Love and Douglas G. Altman , title =. British Journal of Cancer , year =
-
[25]
Data Maturity and Follow-Up in Time-to-Event Analyses , journal =
Val Gebski and Val. Data Maturity and Follow-Up in Time-to-Event Analyses , journal =. 2018 , volume =. doi:10.1093/ije/dyy013 , pmid =
-
[26]
Megan Othus and Aasthaa Bansal and Harry Erba and Scott Ramsey , title =. Value in Health , year =. doi:10.1016/j.jval.2020.02.015 , pmid =
-
[27]
Maller and Xian Zhou , title =
Ross A. Maller and Xian Zhou , title =. Biometrika , year =
-
[28]
Maller and Xian Zhou , title =
Ross A. Maller and Xian Zhou , title =. 1996 , isbn =
1996
-
[29]
Statistics in Medicine , year =
Subodh Selukar and Megan Othus , title =. Statistics in Medicine , year =. doi:10.1002/sim.9610 , pmid =
-
[30]
Non-Parametric Cure Rate Estimation Under Insufficient Follow-Up by Using Extremes , journal =
Mikael Escobar-Bach and Ingrid. Non-Parametric Cure Rate Estimation Under Insufficient Follow-Up by Using Extremes , journal =. 2019 , volume =
2019
-
[31]
Pharmaceutical Statistics , year =
Xiaoping Xiong and Jianrong Wu , title =. Pharmaceutical Statistics , year =. doi:10.1002/pst.1790 , pmid =
-
[32]
2021 , series =
Yingwei Peng and Binbing Yu , title =. 2021 , series =
2021
-
[33]
Schoenfeld , title =
David A. Schoenfeld , title =. Biometrika , year =
-
[34]
Boag , title =
John W. Boag , title =. Journal of the Royal Statistical Society: Series B (Methodological) , year =
-
[35]
Cure Models in Survival Analysis , journal =
Ma. Cure Models in Survival Analysis , journal =. 2018 , volume =
2018
-
[36]
JCO Clinical Cancer Informatics , year =
Kouadio, Cheryl and Selukar, Subodh and Othus, Megan and Chevret, Sylvie , title =. JCO Clinical Cancer Informatics , year =
-
[37]
Gray, Juliet C. and Weston, Rebekah and Owens, Cormac and Canete, Adela and Gambart, Marion and De Wilde, Bram and Nysom, Karsten and van Eijkelenburg, Natasha and Ladenstein, Ruth and Castellano, Aurora and Gerber, Nicolas U. and Marshall, Lynley V. and Barone, Giuseppe and Rubio-San-Simon, Alba and Ng, Antony and Vaidya, Sucheta and Gallego, Soledad and...
-
[38]
and Prentice, R
Yang, S. and Prentice, R. , title =. Biometrics , year =
-
[39]
and Sheng, J
Qiu, P. and Sheng, J. , title =. Journal of the Royal Statistical Society: Series B (Statistical Methodology) , year =
discussion (0)
Sign in with ORCID, Apple, or X to comment. Anyone can read and Pith papers without signing in.