Recognition: 1 theorem link
· Lean TheoremCosmoDRAGoN III: Shaping the Afterlife -- How Progenitors and Environments Sculpt Radio Galaxy Remnants
Pith reviewed 2026-05-12 03:25 UTC · model grok-4.3
The pith
Simulations show jet power sets remnant spectral slopes while environment dictates brightness and morphology in radio galaxy remnants
A machine-rendered reading of the paper's core claim, the machinery that carries it, and where it could break.
Core claim
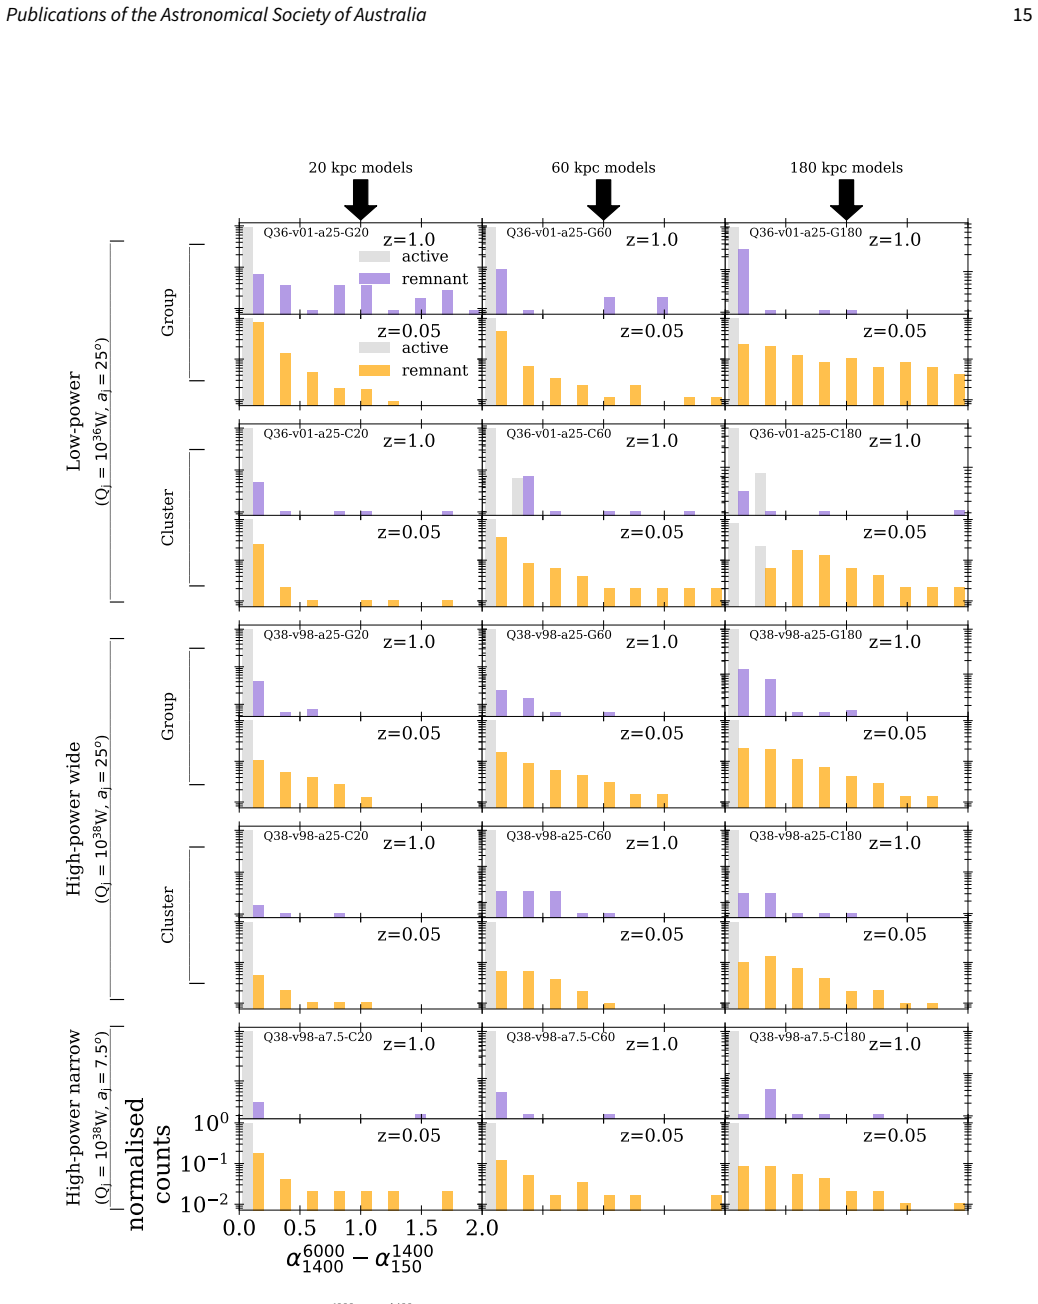
Using three-dimensional hydrodynamic simulations of fifteen radio galaxies in group and cluster environments re-gridded from cosmological runs, we find that jet power correlates with the spectral slope. As the remnant lobes evolve, surface brightness depends strongly on environment, with group remnants systematically dimmer and more amorphous than cluster remnants. Young remnants exhibit low-frequency spectral indices that overlap with active sources and follow a consistent spectral-evolution sequence in which significant curvature develops before an ultra-steep low-frequency index. The models estimate that the peak surface brightness of a low-redshift, 50 Myr-old remnant from a low-power, 1
What carries the argument
Three-dimensional hydrodynamic simulations of radio galaxy lobe evolution that track synchrotron losses and dynamical interactions within re-gridded cosmological group and cluster environments.
If this is right
- Remnants in group environments are systematically harder to detect than those in clusters due to lower surface brightness and more amorphous shapes.
- LOFAR can detect the peak surface brightness of typical low-redshift 50-Myr-old group remnants at 3-sigma, but 20-30 percent of the emission remains undetectable.
- Young remnants overlap in low-frequency spectral indices with active sources, so curvature measurements are needed to identify them reliably.
- The spectral-evolution sequence of curvature appearing before ultra-steep indices holds across different progenitor powers and environments.
- Jet power directly influences the spectral slope of the resulting remnants.
Where Pith is reading between the lines
- The environmental differences suggest that current surveys may undercount remnants in lower-density regions, affecting estimates of total AGN remnant populations.
- Linking these models to real observations could provide a way to infer typical active lifetimes of radio galaxies from their remnant properties.
- The brightness and shape dependence on environment implies that remnant visibility changes with cosmic web location, which could influence studies of how AGN feedback affects galaxy groups versus clusters.
Load-bearing premise
The hydrodynamic simulations accurately capture lobe expansion, synchrotron losses, and environmental interactions without significant numerical artifacts.
What would settle it
A sample of observed low-redshift radio sources with measured environments that shows no difference in surface brightness or spectral curvature between group and cluster remnants would contradict the simulation predictions.
Figures


read the original abstract
Identifying remnant radio-loud active galactic nuclei (AGNs) is challenging due to their diverse morphological and spectral characteristics. Using three-dimensional hydrodynamic simulations of 15 radio galaxies, we investigate how the spectral evolution of remnants depends on progenitor power, active lifetime, environment, and underlying dynamics. The simulations span low-density group and high-density cluster environments re-gridded from smooth-particle-hydrodynamic cosmological simulations. The resulting remnants exhibit a wide range of morphologies, from amorphous structures to double-lobed forms. We find that jet power correlates with the spectral slope. As the remnant lobes evolve, we find surface brightness depends strongly on environment: group remnants are systematically dimmer and more amorphous than cluster remnants, highlighting a potential observational bias against these low-surface-brightness sources. In our models, we estimate that the peak surface brightness of a low-redshift, 50 Myr-old remnant from a low-power progenitor in a 10^{13} M_sun group environment should be routinely detectable at the 3{\sigma} level with LOFAR, although 20-30% of the emission would remain undetectable within a reasonable integration time. We find young remnants exhibit low-frequency (150-1400 MHz) spectral indices that overlap with active sources, and follow a consistent and established spectral-evolution sequence: significant curvature ({\alpha}_{1400}^{6000} - {\alpha}_{150}^{1400} > 0.5) develops before an ultra-steep low-frequency index ({\alpha}_{150}^{1400} > 1.2). The results presented in this work are intended as a reference point for current and upcoming low-frequency studies of radio remnants.
Editorial analysis
A structured set of objections, weighed in public.
Referee Report
Summary. The paper uses 3D hydrodynamic simulations of 15 radio galaxy remnants, re-gridded from SPH cosmological simulations, to examine how spectral evolution depends on jet power, active lifetime, and environment (group vs. cluster). It reports that jet power correlates with spectral slope, group remnants are systematically dimmer and more amorphous than cluster ones, provides LOFAR detectability estimates for low-redshift low-power cases (3σ routine detection but 20-30% emission missed), and describes a spectral sequence in which curvature (α_{1400}^{6000} - α_{150}^{1400} > 0.5) precedes ultra-steep low-frequency indices (α_{150}^{1400} > 1.2).
Significance. If the simulation fidelity holds, the work supplies a useful forward-model reference for low-frequency remnant identification, quantifying environmental selection biases against group-hosted sources and clarifying the curvature-before-steepening sequence that overlaps with active sources at young ages. This directly informs LOFAR and SKA-era surveys.
major comments (3)
- [Methods] Simulation setup (re-gridding from SPH): the procedure for mapping cosmological density fields onto the grid is not validated against resolution or mixing tests; this directly affects the reported surface-brightness contrast between 10^{13} M_⊙ group and cluster environments, as artificial smoothing could exaggerate the dimming and amorphous morphology of low-power remnants.
- [Results] Results on spectral correlations: the claimed jet-power vs. spectral-slope relation and the specific curvature threshold (α_{1400}^{6000} - α_{150}^{1400} > 0.5 before α_{150}^{1400} > 1.2) are derived from the 15 runs without reported uncertainties, resolution convergence, or sensitivity to the adopted synchrotron-loss and magnetic-field prescriptions; these are load-bearing for the evolutionary sequence.
- [Discussion] LOFAR detectability estimates: the statement that a 50 Myr-old low-power group remnant reaches 3σ peak surface brightness (with 20-30% emission undetectable) lacks error analysis on the surface-brightness calculation or direct comparison to observed remnant samples, weakening the observational-bias conclusion.
minor comments (2)
- [Abstract] Abstract: the range of jet powers and active lifetimes spanned by the 15 simulations is not stated, making it difficult to assess how representative the reported correlations are.
- [Throughout] Notation: spectral-index symbols (α_{150}^{1400}, α_{1400}^{6000}) should be defined explicitly on first use rather than only in the abstract.
Simulated Author's Rebuttal
Thank you for the referee's thorough and constructive review. We address each major comment below and will revise the manuscript to strengthen the presentation of methods, results, and implications.
read point-by-point responses
-
Referee: [Methods] Simulation setup (re-gridding from SPH): the procedure for mapping cosmological density fields onto the grid is not validated against resolution or mixing tests; this directly affects the reported surface-brightness contrast between 10^{13} M_⊙ group and cluster environments, as artificial smoothing could exaggerate the dimming and amorphous morphology of low-power remnants.
Authors: We agree that explicit validation of the re-gridding procedure would improve confidence in the environmental contrasts. In the revised manuscript we will add a short subsection in Methods describing the mapping algorithm, mass and energy conservation checks, and resolution sensitivity tests performed on representative fields. These tests show that the reported dimming and morphological differences arise from the physical density contrasts in the parent SPH simulations rather than from artificial smoothing. We will also note the remaining limitations of the approach. revision: yes
-
Referee: [Results] Results on spectral correlations: the claimed jet-power vs. spectral-slope relation and the specific curvature threshold (α_{1400}^{6000} - α_{150}^{1400} > 0.5 before α_{150}^{1400} > 1.2) are derived from the 15 runs without reported uncertainties, resolution convergence, or sensitivity to the adopted synchrotron-loss and magnetic-field prescriptions; these are load-bearing for the evolutionary sequence.
Authors: The reported trends are observed consistently across the 15 simulations. In revision we will add quantitative measures of scatter among the runs and a brief sensitivity discussion that references the synchrotron-loss and magnetic-field choices already validated in the earlier papers of the series. We will clarify that the curvature threshold is presented as a descriptive indicator of the evolutionary sequence rather than a strict numerical boundary. Full resolution convergence for every run is computationally prohibitive, but we will explain why the adopted grid resolution is adequate based on prior convergence tests. revision: partial
-
Referee: [Discussion] LOFAR detectability estimates: the statement that a 50 Myr-old low-power group remnant reaches 3σ peak surface brightness (with 20-30% emission undetectable) lacks error analysis on the surface-brightness calculation or direct comparison to observed remnant samples, weakening the observational-bias conclusion.
Authors: We accept that additional error analysis and observational anchoring would strengthen this section. The revised manuscript will include an assessment of uncertainties in the surface-brightness calculation arising from plausible variations in magnetic-field strength and electron distribution. We will also add a short comparison to published LOFAR-detected remnant samples to support the detectability estimates and the implied selection bias against group-hosted sources. revision: yes
Circularity Check
No significant circularity in forward simulation results
full rationale
The paper derives its claims (jet-power/spectral-slope correlation, environmental dependence of remnant surface brightness and morphology, LOFAR detectability estimates, and the curvature-before-ultra-steep spectral sequence) directly from the outputs of 15 new 3D hydrodynamic simulations. These forward models start from initial conditions (progenitor power, lifetime, re-gridded cosmological environments) and evolve the system without any step that reduces by construction to a fitted parameter or self-referential definition. Self-citations to prior CosmoDRAGoN papers supply methodological context but do not justify the central results, which are independent simulation products compared against observational sequences.
Axiom & Free-Parameter Ledger
axioms (1)
- domain assumption Radio lobe evolution is governed by standard hydrodynamic equations including magnetic fields and radiative losses.
Lean theorems connected to this paper
-
IndisputableMonolith/Foundation/RealityFromDistinction.lean, IndisputableMonolith/Cost/FunctionalEquation.leanreality_from_one_distinction; washburn_uniqueness_aczel unclear?
unclearRelation between the paper passage and the cited Recognition theorem.
Using three-dimensional hydrodynamic simulations of 15 radio galaxies... post-processing pipeline... PRAiSE implementation... equipartition factor... synchrotron and inverse-Compton losses
What do these tags mean?
- matches
- The paper's claim is directly supported by a theorem in the formal canon.
- supports
- The theorem supports part of the paper's argument, but the paper may add assumptions or extra steps.
- extends
- The paper goes beyond the formal theorem; the theorem is a base layer rather than the whole result.
- uses
- The paper appears to rely on the theorem as machinery.
- contradicts
- The paper's claim conflicts with a theorem or certificate in the canon.
- unclear
- Pith found a possible connection, but the passage is too broad, indirect, or ambiguous to say the theorem truly supports the claim.
Reference graph
Works this paper leans on
-
[1]
Alexander, P., & Leahy, J. P. 1987, Monthly Notices of the Royal Astronomical Society, 225, 1–26
work page 1987
-
[2]
2012, The Astrophysical Journal, 756, 116
Antognini, J., Bird, J., & Martini, P. 2012, The Astrophysical Journal, 756, 116
work page 2012
-
[3]
Basson, J. F., & Alexander, P. 2003, Monthly Notices of the Royal Astronomical Society, 339, 353–359
work page 2003
-
[4]
Bolton, J. G., Stanley, G. J., & Slee, O. B. 1949, Nature, 164, 101–102
work page 1949
-
[5]
2016, Astronomy &; Astro- physics, 585, A29 —
Brienza, M., Godfrey, L., Morganti, R., et al. 2016, Astronomy &; Astro- physics, 585, A29 —. 2017, Astronomy &; Astrophysics, 606, A98
work page 2016
-
[6]
Brighenti, F., Mathews, W. G., & Temi, P. 2015, The Astrophysical Journal, 802, 118
work page 2015
-
[7]
Chen, Y.-H., Heinz, S., & Enßlin, T. A. 2019, Monthly Notices of the Royal Astronomical Society, 489, 1939–1949
work page 2019
-
[8]
Croston, J. H., & Hardcastle, M. J. 2014, Monthly Notices of the Royal Astronomical Society, 438, 3310–3321
work page 2014
-
[9]
2018, Monthly Notices of the Royal Astronomical Society, 480, 2898–2915
Cui, W., Knebe, A., Y epes, G., et al. 2018, Monthly Notices of the Royal Astronomical Society, 480, 2898–2915
work page 2018
-
[10]
Dutta, S., Singh, V., Chandra, C. H. I., Wadadekar, Y., & Kayal, A. 2022, Journal of Astrophysics and Astronomy, 43
work page 2022
-
[11]
English, W., Hardcastle, M. J., & Krause, M. G. H. 2019, Monthly Notices of the Royal Astronomical Society, 490, 5807
work page 2019
-
[12]
1988, Astronomy and Astrophysics, 199, 73
Giovannini, G., Feretti, L., Gregorini, L., & Parma, P. 1988, Astronomy and Astrophysics, 199, 73
work page 1988
-
[13]
Godfrey, L. E. H., Morganti, R., & Brienza, M. 2017, Monthly Notices of the Royal Astronomical Society, 471, 891
work page 2017
-
[14]
Godfrey, L. E. H., Bicknell, G. V., Lovell, J. E. J., et al. 2009, The Astrophysical Journal, 695, 707–723
work page 2009
-
[15]
2017, Monthly Notices of the Royal Astro- nomical Society, 473, 1332–1345
Guo, F., Duan, X., & Yuan, Y.-F. 2017, Monthly Notices of the Royal Astro- nomical Society, 473, 1332–1345
work page 2017
-
[16]
Hardcastle, M. J. 2018, Monthly Notices of the Royal Astronomical Society, 475, 2768
work page 2018
-
[17]
Hardcastle, M. J., Alexander, P., Pooley, G. G., & Riley, J. M. 1998, Monthly Notices of the Royal Astronomical Society, 296, 445–462
work page 1998
-
[18]
Hardcastle, M. J., & Krause, M. G. H. 2013, Monthly Notices of the Royal Astronomical Society, 430, 174
work page 2013
-
[19]
Hardcastle, M. J., W orrall, D. M., Birkinshaw, M., & Canosa, C. M. 2003, Monthly Notices of the Royal Astronomical Society, 338, 176–188
work page 2003
-
[20]
2007, Monthly Notices of the Royal Astronomical Society, 374, 787–792 Huško, F., & Lacey, C
Heath, D., Krause, M., & Alexander, P. 2007, Monthly Notices of the Royal Astronomical Society, 374, 787–792 Huško, F., & Lacey, C. G. 2023, Monthly Notices of the Royal Astronomical Society, 521, 4375–4394
work page 2007
-
[21]
Ineson, J., Croston, J. H., Hardcastle, M. J., & Mingo, B. 2017, Monthly Notices of the Royal Astronomical Society, stx189
work page 2017
-
[22]
Jaffe, W. J., & Perola, G. C. 1973, Astronomy & Astrophysics, 26, 423
work page 1973
- [23]
-
[24]
2025, Publications of the Astronomical Society of Australia
Jerrim, L., Shabala, S., Turner, R., et al. 2025, Publications of the Astronomical Society of Australia
work page 2025
-
[25]
2021, Astronomy &; Astrophysics, 653, A110
Jurlin, N., Brienza, M., Morganti, R., et al. 2021, Astronomy &; Astrophysics, 653, A110
work page 2021
-
[26]
2020, Astronomy &; Astrophysics, 638, A34
Jurlin, N., Morganti, R., Brienza, M., et al. 2020, Astronomy &; Astrophysics, 638, A34
work page 2020
-
[27]
Kaiser, C. R., & Alexander, P. 1997, Monthly Notices of the Royal Astronom- ical Society, 286, 215
work page 1997
-
[28]
Kaiser, C. R., & Cotter, G. 2002, Monthly Notices of the Royal Astronomical Society, 336, 649
work page 2002
-
[29]
R., Dennett-Thorpe, J., & Alexander, P
Kaiser, C. R., Dennett-Thorpe, J., & Alexander, P. 1997, Monthly Notices of the Royal Astronomical Society, 292, 723–732
work page 1997
-
[30]
Komissarov, S. S., & Gubanov, A. G. 1994, Astronomy & Astrophysics, 285, 27
work page 1994
-
[31]
Laing, R. A., & Bridle, A. H. 2014, Monthly Notices of the Royal Astronomical Society, 437, 3405–3441
work page 2014
-
[32]
Longair, M. S. 2010, High Energy Astrophysics (Cambridge University Press)
work page 2010
-
[33]
Mahatma, V. H., Hardcastle, M. J., Williams, W. L., et al. 2018, Monthly Notices of the Royal Astronomical Society, 475, 4557–4578
work page 2018
-
[34]
Mathews, W. G. 1971, The Astrophysical Journal, 165, 147
work page 1971
-
[35]
2012, The Astrophysical Journal Supplement Series, 198, 7
Mignone, A., Zanni, C., Tzeferacos, P., et al. 2012, The Astrophysical Journal Supplement Series, 198, 7
work page 2012
-
[36]
1957, Australian Journal of Physics, 10, 162
Mills, B., & Slee, O. 1957, Australian Journal of Physics, 10, 162
work page 1957
-
[37]
Mingo, B., Croston, J. H., Hardcastle, M. J., et al. 2019, Monthly Notices of the Royal Astronomical Society, 488, 2701–2721
work page 2019
-
[38]
Morganti, R., Jurlin, N., Oosterloo, T., et al. 2021, Galaxies, 9, 88
work page 2021
-
[39]
Mullin, L. M., Riley, J. M., & Hardcastle, M. J. 2008, Monthly Notices of the Royal Astronomical Society, 390, 595
work page 2008
-
[40]
2011, Astronomy &; Astrophysics, 526, A148
Murgia, M., Parma, P., Mack, K.-H., et al. 2011, Astronomy &; Astrophysics, 526, A148
work page 2011
-
[41]
2021, Astronomis- che Nachrichten, 342, 1171–1175
Perucho, M., López-Miralles, J., Reynaldi, V., & Labiano, A. 2021, Astronomis- che Nachrichten, 342, 1171–1175
work page 2021
-
[42]
2014, Monthly Notices of the Royal Astronomical Society, 445, 1462–1481 Planck Collaboration, Ade, P
Perucho, M., Martí, J.-M., Quilis, V., & Ricciardelli, E. 2014, Monthly Notices of the Royal Astronomical Society, 445, 1462–1481 Planck Collaboration, Ade, P. A. R., Aghanim, N., et al. 2016, A&A, 594, A13
work page 2014
-
[43]
Pope, E. C. D., Babul, A., Pavlovski, G., Bower, R. G., & Dotter, A. 2010, Monthly Notices of the Royal Astronomical Society, no
work page 2010
-
[44]
J., Seymour, N., & Hurley-Walker, N
Quici, B., Turner, R. J., Seymour, N., & Hurley-Walker, N. 2025, Monthly Notices of the Royal Astronomical Society, 537, 343–363
work page 2025
-
[45]
2021, Publications of the Astronomical Society of Australia, 38
Quici, B., Hurley-Walker, N., Seymour, N., et al. 2021, Publications of the Astronomical Society of Australia, 38
work page 2021
-
[46]
Rees, M. J. 1971, Nature, 229, 312–317
work page 1971
-
[47]
2008, Astronomy &; Astrophysics, 477, L33–L36
Revaz, Y., Combes, F., & Salomé, P. 2008, Astronomy &; Astrophysics, 477, L33–L36
work page 2008
-
[48]
2012, The Astrophysical Journal Supplement Series, 199, 27
Saripalli, L., Subrahmanyan, R., Thorat, K., et al. 2012, The Astrophysical Journal Supplement Series, 199, 27
work page 2012
-
[49]
Scheuer, P. A. G. 1974, Monthly Notices of the Royal Astronomical Society, 166, 513
work page 1974
-
[50]
S., Jurlin, N., Morganti, R., et al
Shabala, S. S., Jurlin, N., Morganti, R., et al. 2020, Monthly Notices of the Royal Astronomical Society, 496, 1706–1717
work page 2020
- [51]
-
[52]
Singh, V., Dutta, S., Wadadekar, Y., & Ishwara-Chandra, C. H. 2021, Galaxies, 9, 121 Publications of the Astronomical Society of Australia23
work page 2021
-
[53]
Stewart, G. S. C., Shabala, S, S., Turner, R. J., et al. 2025, Publications of the Astronomical Society of Australia
work page 2025
- [54]
-
[55]
Taub, A. H. 1948, Physical Review, 74, 328–334
work page 1948
-
[56]
Turner, R. J. 2018, Monthly Notices of the Royal Astronomical Society, 476, 2522–2529
work page 2018
-
[57]
Turner, R. J., Rogers, J. G., Shabala, S. S., & Krause, M. G. H. 2018, Monthly Notices of the Royal Astronomical Society, 473, 4179–4196
work page 2018
-
[58]
Turner, R. J., & Shabala, S. S. 2015, The Astrophysical Journal, 806, 59
work page 2015
-
[59]
Turner, R. J., & Stewart, G. S. 2026, Journal of High Energy Astrophysics, 53, 100596
work page 2026
-
[60]
Turner, R. J., Yates-Jones, P. M., Shabala, S. S., Quici, B., & Stewart, G. S. C. 2023, Monthly Notices of the Royal Astronomical Society, 518, 945
work page 2023
- [61]
-
[62]
Yates-Jones, P. M., Shabala, S. S., Krause, M. G. H., et al. 2023, Publications of the Astronomical Society of Australia
work page 2023
-
[63]
Yates-Jones, P. M., Turner, R. J., Shabala, S. S., & Krause, M. G. H. 2022, Monthly Notices of the Royal Astronomical Society, 511, 5225
work page 2022
-
[64]
2022, Monthly Notices of the Royal Astronomical Society, 517, 616–631
Zhang, C., Zhuravleva, I., Gendron-Marsolais, M.-L., et al. 2022, Monthly Notices of the Royal Astronomical Society, 517, 616–631
work page 2022
discussion (0)
Sign in with ORCID, Apple, or X to comment. Anyone can read and Pith papers without signing in.