Recognition: no theorem link
A tool of Hierarchical cOre ideNtification and Kinematic property AssIgnment (HONKAI) for Dense Cores
Pith reviewed 2026-05-13 04:08 UTC · model grok-4.3
The pith
Dense cores in infrared dark clouds are mostly self-gravitating yet rarely meet the conditions to form high-mass stars without later mass growth.
A machine-rendered reading of the paper's core claim, the machinery that carries it, and where it could break.
Core claim
Although many IRDC cores are self-gravitating, only a small fraction are seemingly possible to form high-mass stars. In subsequent core evolution, some further mass assembly trend may be involved to facilitate the high-mass star formation.
What carries the argument
HONKAI, the hierarchical core identification and kinematic property assignment procedure that resolves elemental components, disentangles velocities, measures properties, and generates catalogs from multi-band data.
If this is right
- Only a small fraction of IRDC cores currently satisfy conditions for high-mass star formation.
- Core mass functions in the earliest stages are steeper at high masses than in evolved regions.
- Additional mass assembly is required after the initial core stage to enable high-mass star formation.
- Many self-gravitating cores in IRDCs will need external or internal processes to increase mass before forming massive stars.
Where Pith is reading between the lines
- Star formation models for IRDCs must include continued accretion or merging after the dense core identification stage.
- Applying similar automated tools to larger IRDC samples could determine whether the small fraction of high-mass candidates is a general feature.
- Comparisons with hydrodynamic simulations of core evolution could check whether the observed mass-size deficit persists without added mass input.
Load-bearing premise
The chosen virial ratio threshold above 1 and mass-size relation cutoff accurately flag limited high-mass star formation potential, and core identification plus velocity disentanglement introduce no major biases in the statistics.
What would settle it
Direct observation of mass growth onto these cores in later evolutionary stages, or a match between the current core properties and the final stellar mass distribution without added accretion, would test the claim.
Figures


read the original abstract
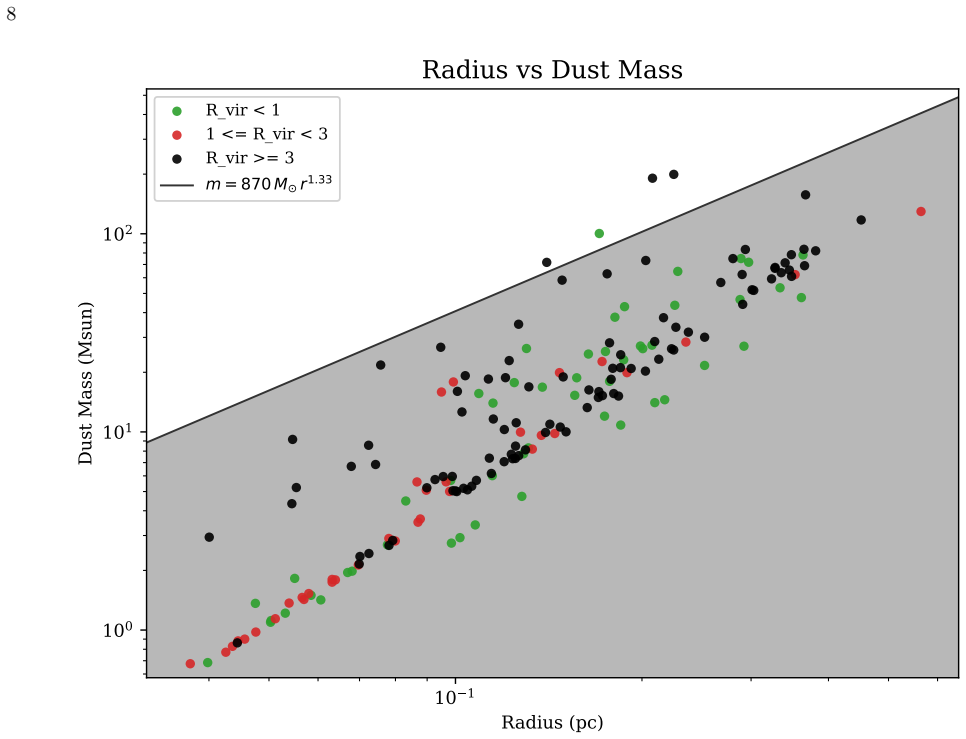
Infrared dark clouds (IRDCs) contains cold dense gas at the earliest stage of massive star and cluster formation. In studying the IRDCs, a universal and fundamental task is to resolve their internal hierarchical structures. Various packages and algorithms were developed for this purpose, but with most of them mainly focused on certain individual steps in data processing. In this work, we build a more automatic procedure for multi-band structure measurement HONKAI (Hierarchical cOre ideNtification and Kinematic property AssIgnment), which can resolve the elemental components including cores and clumps, disentangle the velocity components in spectral data, measure their physical properties, and generate a catalogue for all the measured properties. We use {\sc honkai} for a joint study towards three IRDCs observed in 850 $\mu$m dust continuum with James Clerk Maxwell Telescope (JCMT) and the $^{13}CO$ $(1-0)$ data cube with the Purple Mount Observatory 14-m telescope. 193 dense cores in 16 clumps are identified. As major dynamical properties, a large amount of the cores (136 out of 193) are measured to have large virial ratio of $R_{\rm vir}>1$, but their mass-size relation is bellow the threshold for massive star formation. Meanwhile, core mass function (CMF) also exhibits a steeper slope towards high-mass end compared to more evolved core samples. These three properties in accordance suggest that although many IRDC cores are self-gravitating, only a small fraction are seemingly possible to form high-mass stars. In subsequent core evolution, some further mass assembly trend may be involved to facilitate the high-mass star formation.
Editorial analysis
A structured set of objections, weighed in public.
Referee Report
Summary. The paper introduces HONKAI, an automated pipeline for hierarchical identification of cores and clumps, velocity disentanglement from spectral cubes, and measurement of physical properties in infrared dark clouds. Applied to JCMT 850 μm continuum and PMO 13CO(1-0) observations of three IRDCs, it reports 193 dense cores in 16 clumps. Key results are that 136 cores have R_vir >1, the mass-size relation lies below the high-mass star formation threshold, and the high-mass end of the core mass function is steeper than in more evolved samples. These are interpreted as evidence that many IRDC cores are self-gravitating yet only a small fraction can form high-mass stars, with further mass assembly possibly required in later evolution.
Significance. If the processing steps and dynamical interpretations are robust, the integrated tool could reduce subjectivity in core extraction and kinematic assignment for IRDC studies. The reported statistics on virial ratios, mass-size relations, and CMF slopes would supply useful initial-condition constraints for models of massive star formation.
major comments (2)
- [Abstract] Abstract: The central claim that 'although many IRDC cores are self-gravitating' is not supported by the reported statistic. The manuscript states that 136 of 193 cores have R_vir >1, yet the standard virial parameter α >1 indicates unbound cores (M < M_vir). No definition of R_vir, no equation for its calculation (e.g., involving velocity dispersion, radius, and mass), and no explicit self-gravitation threshold (R_vir <1 or <2) are provided. This internal tension must be resolved by stating the exact definition and classification criterion used.
- [Abstract] Abstract: The statements that the mass-size relation lies 'below the threshold for massive star formation' and that the CMF 'exhibits a steeper slope towards high-mass end' lack quantitative detail. The specific threshold value and its literature reference, the measured slope value with uncertainty, and the comparison sample(s) are not given. These omissions prevent assessment of whether the three properties are mutually consistent with the headline conclusion.
minor comments (2)
- [Abstract] Typo: 'bellow' should read 'below'.
- [Abstract] Grammar: 'Infrared dark clouds (IRDCs) contains' should be 'contain'.
Simulated Author's Rebuttal
We thank the referee for the careful and constructive review. The two major comments both concern the abstract, and we will revise it to add the requested definitions, equations, quantitative values, references, and to resolve the noted internal tension while preserving the scientific content of the manuscript.
read point-by-point responses
-
Referee: [Abstract] Abstract: The central claim that 'although many IRDC cores are self-gravitating' is not supported by the reported statistic. The manuscript states that 136 of 193 cores have R_vir >1, yet the standard virial parameter α >1 indicates unbound cores (M < M_vir). No definition of R_vir, no equation for its calculation (e.g., involving velocity dispersion, radius, and mass), and no explicit self-gravitation threshold (R_vir <1 or <2) are provided. This internal tension must be resolved by stating the exact definition and classification criterion used.
Authors: We agree that the abstract as currently worded contains an internal inconsistency and omits necessary technical details. In the revised manuscript we will (1) state the exact definition of R_vir, (2) give the equation used to compute it from velocity dispersion, radius and mass, and (3) specify the numerical threshold adopted for self-gravitation. We will then rephrase the concluding sentence so that it is unambiguously supported by the reported statistic of 136 cores with R_vir >1. If our convention for R_vir differs from the standard α (for example if R_vir is defined as the inverse), this will be made explicit; otherwise the wording will be adjusted to reflect that most cores are unbound according to the classical criterion. These changes will be implemented in the abstract and cross-referenced to the methods section. revision: yes
-
Referee: [Abstract] Abstract: The statements that the mass-size relation lies 'below the threshold for massive star formation' and that the CMF 'exhibits a steeper slope towards high-mass end' lack quantitative detail. The specific threshold value and its literature reference, the measured slope value with uncertainty, and the comparison sample(s) are not given. These omissions prevent assessment of whether the three properties are mutually consistent with the headline conclusion.
Authors: We accept that the abstract would be clearer with explicit numbers and citations. In the revised version we will insert (1) the precise mass-size threshold value together with its literature reference, (2) the measured high-mass-end CMF slope and its uncertainty, and (3) the specific comparison samples against which the slope is judged steeper. These additions will allow readers to evaluate the mutual consistency of the three reported properties with the headline interpretation. revision: yes
Circularity Check
No circularity; all reported statistics derive directly from data processing without reduction to self-defined or fitted quantities.
full rationale
The paper introduces the HONKAI pipeline to extract cores, clumps, velocities, masses, sizes, and virial ratios from JCMT 850 μm continuum maps and PMO 13CO(1-0) cubes. The central statistics—193 cores identified, 136 with R_vir > 1, mass-size relations below the high-mass threshold, and a steeper high-mass CMF—are computed outputs of this pipeline applied to the input observations. No equation in the derivation chain defines a target result in terms of a fitted parameter that is then re-labeled as a prediction, nor does any load-bearing step rely on a self-citation whose justification loops back to the present work. The interpretive claim that many cores are self-gravitating yet few can form high-mass stars follows from comparing these independently measured quantities against external literature thresholds; it does not collapse to a tautology or to quantities defined by the authors' own ansatz.
Axiom & Free-Parameter Ledger
axioms (1)
- domain assumption Standard definitions and extraction methods for dense cores from dust continuum and spectral-line data cubes
Reference graph
Works this paper leans on
-
[1]
Akaike, H. 1974, IEEE Transactions on Automatic Control, 19, 716, doi: 10.1109/TAC.1974.1100705 Astropy Collaboration, Robitaille, T. P., Tollerud, E. J., et al. 2013, A&A, 558, A33, doi: 10.1051/0004-6361/201322068 Astropy Collaboration, Price-Whelan, A. M., Sip˝ ocz, B. M., et al. 2018, AJ, 156, 123, doi: 10.3847/1538-3881/aabc4f Astropy Collaboration, ...
-
[2]
Beuther, H., Schilke, P., Menten, K. M., et al. 2002, ApJ, 566, 945, doi: 10.1086/338334
-
[3]
Bonnor, W. B. 1956, MNRAS, 116, 351, doi: 10.1093/mnras/116.3.351
-
[4]
2009, ApJS, 181, 360, doi: 10.1088/0067-0049/181/2/360
Simon, R. 2009, ApJS, 181, 360, doi: 10.1088/0067-0049/181/2/360
-
[5]
2013, A&A, 552, A40, doi: 10.1051/0004-6361/201219567
Chira, R.-A., Beuther, H., Linz, H., et al. 2013, A&A, 552, A40, doi: 10.1051/0004-6361/201219567
-
[6]
Eden, D. J., Moore, T. J. T., Plume, R., et al. 2017, MNRAS, 469, 2163, doi: 10.1093/mnras/stx874
-
[7]
J., Liu, T., Kim, K.-T., et al
Eden, D. J., Liu, T., Kim, K.-T., et al. 2019, MNRAS, 485, 2895, doi: 10.1093/mnras/stz574
-
[8]
Frenk, C. S., White, S. D. M., & Davis, M. 1983, ApJ, 271, 417, doi: 10.1086/161209
-
[9]
2013, A&A, 554, A55, doi: 10.1051/0004-6361/201220090
Hacar, A., Tafalla, M., Kauffmann, J., & Kov´ acs, A. 2013, A&A, 554, A55, doi: 10.1051/0004-6361/201220090
-
[10]
Henshaw, J. D., Longmore, S. N., Kruijssen, J. M. D., et al. 2016, MNRAS, 457, 2675, doi: 10.1093/mnras/stw121
-
[11]
Henshaw, J. D., Ginsburg, A., Haworth, T. J., et al. 2019, MNRAS, 485, 2457, doi: 10.1093/mnras/stz471
-
[12]
2010, ApJL, 723, L7, doi: 10.1088/2041-8205/723/1/L7
Kauffmann, J., & Pillai, T. 2010, ApJL, 723, L7, doi: 10.1088/2041-8205/723/1/L7
-
[13]
1990, Stellar Structure and Evolution
Kippenhahn, R., & Weigert, A. 1990, Stellar Structure and Evolution
work page 1990
-
[14]
Li, D., Velusamy, T., Goldsmith, P. F., & Langer, W. D. 2007, ApJ, 655, 351, doi: 10.1086/509736
-
[15]
2018, ARA&A, 56, 41, doi: 10.1146/annurev-astro-091916-055235
Motte, F., Bontemps, S., & Louvet, F. 2018, ARA&A, 56, 41, doi: 10.1146/annurev-astro-091916-055235
-
[16]
Peretto, N., & Fuller, G. A. 2009, A&A, 505, 405, doi: 10.1051/0004-6361/200912127
-
[17]
Pillai, T., Wyrowski, F., Menten, K. M., & Kr¨ ugel, E. 2006, A&A, 447, 929, doi: 10.1051/0004-6361:20042145
-
[18]
Rathborne, J. M., Jackson, J. M., & Simon, R. 2006, ApJ, 641, 389, doi: 10.1086/500423
-
[19]
Reid, M. A., & Wilson, C. D. 2005, ApJ, 625, 891, doi: 10.1086/429790
-
[20]
Reid, M. J., Menten, K. M., Brunthaler, A., et al. 2019, ApJ, 885, 131, doi: 10.3847/1538-4357/ab4a11
-
[21]
Goodman, A. A. 2008, ApJ, 679, 1338, doi: 10.1086/587685
-
[22]
2019, ApJ, 886, 102, doi: 10.3847/1538-4357/ab45e9
Sanhueza, P., Contreras, Y., Wu, B., et al. 2019, ApJ, 886, 102, doi: 10.3847/1538-4357/ab45e9
-
[23]
Schinnerer, E., Emsellem, E., Henshaw, J. D., et al. 2023, ApJL, 944, L15, doi: 10.3847/2041-8213/acac9e
-
[24]
2019, ApJS, 240, 9, doi: 10.3847/1538-4365/aaf1c8
Su, Y., Yang, J., Zhang, S., et al. 2019, ApJS, 240, 9, doi: 10.3847/1538-4365/aaf1c8
-
[25]
2014, MNRAS, 439, 3275, doi: 10.1093/mnras/stu127
Wang, K., Zhang, Q., Testi, L., et al. 2014, MNRAS, 439, 3275, doi: 10.1093/mnras/stu127
discussion (0)
Sign in with ORCID, Apple, or X to comment. Anyone can read and Pith papers without signing in.