Charting circumstellar chemistry of carbon-rich asymptotic giant branch stars. III. SiO and SiS abundances
Pith reviewed 2026-05-19 16:06 UTC · model grok-4.3
pith:DIR7GTUB Add to your LaTeX paper
What is a Pith Number?\usepackage{pith}
\pithnumber{DIR7GTUB}
Prints a linked pith:DIR7GTUB badge after your title and writes the identifier into PDF metadata. Compiles on arXiv with no extra files. Learn more
The pith
SiO peak abundances in most carbon-rich AGB stars are about five times higher than in the archetype IRC+10216, while SiS abundances stay similar across the sample.
A machine-rendered reading of the paper's core claim, the machinery that carries it, and where it could break.
Core claim
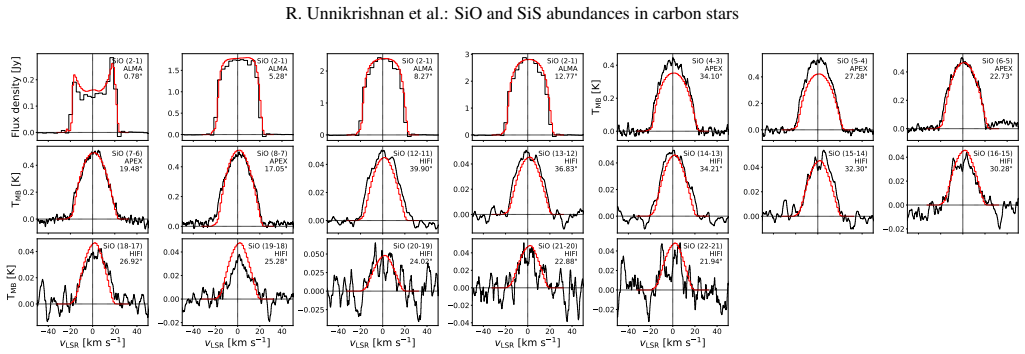
Good fits to the SiO and SiS line profiles allow derivation of peak abundances and e-folding radii for all sources except AFGL 3068. SiS peak abundances range from 2.0×10^{-6} to 4.7×10^{-6} and remain similar across the sample, while SiO peak abundances in the other stars are a factor of roughly five larger than the value found for IRC+10216. The e-folding radii increase with gas density for both molecules. Chemical models reproduce the SiO abundance profiles but over-predict the SiS e-folding radii, leading to the conclusion that the currently assumed SiS photodissociation rate in chemical models is too low.
What carries the argument
1D non-LTE radiative transfer modeling constrained by both ALMA spatial maps and single-dish spectra to recover radial abundance profiles and e-folding radii.
Load-bearing premise
Simplified one-dimensional stellar envelope models and non-LTE radiative transfer accurately recover the true radial abundance profiles despite known limitations of such approximations.
What would settle it
A direct measurement or laboratory determination showing that the SiS photodissociation rate is not lower than the value currently used in chemical models, or new observations finding SiO abundances in other carbon stars equal to the IRC+10216 value.
Figures


read the original abstract
The present understanding of C-rich AGB chemistry largely relies on observations of the archetypal carbon star IRC+10216. Current molecular abundance estimates for carbon stars are based either on single-dish spectra sampling a range of excitation conditions, or on interferometric mapping of a few lines. We aim to estimate the circumstellar abundances of SiO, SiS, and their most abundant isotopologues ($^{29}$SiO, $^{30}$SiO, $^{29}$SiS, $^{30}$SiS, and Si$^{34}$S) for a sample of five carbon stars. We derived molecular abundances using detailed 1D non-local thermodynamic equilibrium (non-LTE) radiative transfer (RT) modelling, constrained by both morphological and excitation information obtained from spatially resolved ALMA maps and single-dish observations. We further compared the derived abundances to chemical modelling results. We obtain good fits to the SiO and SiS line profiles, and derived well-constrained abundance profiles and reliable isotopic ratios for all sources except AFGL 3068. While the SiS peak abundances are very similar across the sample (2.0$\times$10$^{-6}-4.7\times$10$^{-6}$), we find that the SiO peak abundances of the rest of the stars are a factor of $\sim$5 larger than that of IRC+10216. The $e$-folding radii ($R_\mathrm{e}$) are in the range 1.3$\times$10$^{16}-7.0\times$10$^{16}$ cm for SiO and 6.0$\times$10$^{15}-1.0\times$10$^{17}$ cm for SiS. The $R_\mathrm{e}$ increases with gas density for both SiO and SiS. Chemical models reproduce the derived SiO abundance profiles well, while over-predicting the SiS $R_\mathrm{e}$ values. Our models highlight the necessity of having spatially resolved observations across a broad range of excitation conditions, while also making evident the limitations inherent in 1D RT modelling using simplified (circum)stellar models. We find that the currently assumed SiS photodissociation rate in chemical models is underestimated.
Editorial analysis
A structured set of objections, weighed in public.
Referee Report
Summary. The manuscript derives SiO, SiS, and isotopologue abundances for five carbon-rich AGB stars via 1D non-LTE radiative transfer modeling constrained by ALMA spatially resolved maps and single-dish spectra. It reports good fits and well-constrained profiles for all sources except AFGL 3068, with SiS peak abundances similar across the sample (2.0×10^{-6} to 4.7×10^{-6}), SiO peak abundances ~5 times higher than in IRC+10216 for the remaining stars, e-folding radii (R_e) of 1.3×10^{16}–7.0×10^{16} cm for SiO and 6.0×10^{15}–1.0×10^{17} cm for SiS that increase with gas density, and a conclusion that chemical models over-predict SiS R_e values, implying the assumed SiS photodissociation rate is underestimated.
Significance. If the results hold, the work provides valuable new constraints on molecular abundances and radial distributions in multiple C-rich AGB envelopes beyond the archetype IRC+10216. The combination of interferometric and single-dish data yields tighter limits on peak abundances and R_e than single-dish-only studies, and the suggestion of a revised SiS photodissociation rate would directly impact standard chemical networks for AGB chemistry. The explicit discussion of 1D modeling limitations is a strength that helps frame the reliability of the derived parameters.
major comments (2)
- [Abstract] Abstract: The claim that the SiS photodissociation rate is underestimated rests on chemical models over-predicting the observationally derived SiS R_e values (6.0×10^{15}–1.0×10^{17} cm). These R_e are recovered from 1D non-LTE RT fits that adopt simplified spherical density/temperature profiles. The abstract itself notes the limitations of such modeling for real envelopes; without a quantitative test of how azimuthal asymmetries, shocks, or unmodeled density gradients would shift the recovered R_e, the rate adjustment remains vulnerable to systematic bias.
- [Modeling section] Modeling section: The paper reports that acceptable fits could not be obtained for AFGL 3068, yet the sample-wide statements on SiS abundance similarity (2.0–4.7×10^{-6}) and the factor-of-~5 SiO enhancement relative to IRC+10216 are presented without explicit sensitivity tests excluding this source. If the poor fit for AFGL 3068 indicates that its envelope deviates strongly from the assumed 1D structure, the robustness of the cross-source trends requires clarification.
minor comments (2)
- [Notation] The notation for e-folding radius (R_e) should be used consistently in all figures, tables, and text to avoid reader confusion.
- [Results] A brief table summarizing the best-fit peak abundances, R_e, and isotopic ratios for each source would improve readability of the results.
Simulated Author's Rebuttal
We thank the referee for their constructive and detailed review. We have addressed each major comment below, revising the manuscript to improve clarity on modeling limitations and the robustness of cross-source trends while maintaining the integrity of our analysis.
read point-by-point responses
-
Referee: [Abstract] Abstract: The claim that the SiS photodissociation rate is underestimated rests on chemical models over-predicting the observationally derived SiS R_e values (6.0×10^{15}–1.0×10^{17} cm). These R_e are recovered from 1D non-LTE RT fits that adopt simplified spherical density/temperature profiles. The abstract itself notes the limitations of such modeling for real envelopes; without a quantitative test of how azimuthal asymmetries, shocks, or unmodeled density gradients would shift the recovered R_e, the rate adjustment remains vulnerable to systematic bias.
Authors: We agree that the interpretation of the SiS photodissociation rate relies on 1D-derived R_e and that unquantified systematic effects from non-spherical structures could influence the comparison with chemical models. The manuscript already highlights 1D modeling limitations in the abstract and discussion. To address the concern directly, we have revised the abstract to use more cautious language, stating that the results 'suggest' the photodissociation rate may be underestimated. We have also expanded the discussion to include a qualitative assessment of how azimuthal asymmetries and shocks (referencing prior studies on AGB envelope structures) could affect recovered R_e values, while noting that a full quantitative 3D test lies outside the scope of this 1D-focused study. revision: partial
-
Referee: [Modeling section] Modeling section: The paper reports that acceptable fits could not be obtained for AFGL 3068, yet the sample-wide statements on SiS abundance similarity (2.0–4.7×10^{-6}) and the factor-of-~5 SiO enhancement relative to IRC+10216 are presented without explicit sensitivity tests excluding this source. If the poor fit for AFGL 3068 indicates that its envelope deviates strongly from the assumed 1D structure, the robustness of the cross-source trends requires clarification.
Authors: We concur that explicit sensitivity tests would better demonstrate the robustness of the reported trends. The original text already qualifies results by excluding AFGL 3068 from the good-fit sources and specifies the SiO enhancement applies to 'the rest of the stars.' We have now added a dedicated sensitivity analysis subsection in the results, showing SiS peak abundances and SiO enhancement factors both with and without AFGL 3068. The SiS range (2.0–4.7×10^{-6}) and the factor-of-~5 SiO increase remain unchanged when AFGL 3068 is excluded. We have further elaborated on the likely cause of the poor fit for AFGL 3068, linking it to its documented complex, asymmetric envelope that may deviate more from 1D assumptions than the other sources. revision: yes
Circularity Check
No significant circularity: abundances and rate inference derived from new observational fits
full rationale
The paper's central derivation obtains SiO and SiS abundance profiles and e-folding radii by fitting 1D non-LTE radiative transfer models directly to new ALMA spatially resolved maps plus single-dish spectra. These observationally constrained profiles are then compared against independent chemical networks; the inference that the SiS photodissociation rate is underestimated follows from the mismatch between fitted R_e values and model predictions. No step reduces by construction to prior fitted constants, self-citations, or ansatzes imported from the authors' own prior work. The derivation remains self-contained against external observational benchmarks even while acknowledging modeling limitations.
Axiom & Free-Parameter Ledger
free parameters (3)
- SiO peak abundance per star
- SiS peak abundance
- e-folding radius R_e for SiO and SiS
axioms (2)
- domain assumption Circumstellar envelopes can be adequately described by 1D spherically symmetric density and temperature profiles
- domain assumption Non-LTE excitation conditions apply to the SiO and SiS transitions observed
Reference graph
Works this paper leans on
-
[1]
Agúndez, M. & Cernicharo, J. 2006, ApJ, 650, 374 Agúndez, M., Cernicharo, J., Quintana-Lacaci, G., et al. 2017, A&A, 601, A4 Agúndez, M., Fonfría, J. P., Cernicharo, J., et al. 2012, A&A, 543, A48 Agúndez, M., Martínez, J. I., de Andres, P. L., Cernicharo, J., & Martín-Gago, J. A. 2020, A&A, 637, A59 Article number, page 13 A&A proofs:manuscript no. aa58602-25
work page 2006
-
[2]
Anand, R. K., Rastogi, S., & Kumar, B. 2023, Journal of Astrophysics and As- tronomy, 44, 47
work page 2023
-
[3]
Andriantsaralaza, M., Ramstedt, S., Vlemmings, W. H. T., et al. 2021, A&A, 653, A53
work page 2021
-
[4]
Andriantsaralaza, M., Ramstedt, S., Vlemmings, W. H. T., & De Beck, E. 2022, A&A, 667, A74
work page 2022
-
[5]
Asplund, M., Grevesse, N., Sauval, A. J., & Scott, P. 2009, ARA&A, 47, 481 Astropy Collaboration, Price-Whelan, A. M., Lim, P. L., et al. 2022, ApJ, 935, 167 Astropy Collaboration, Price-Whelan, A. M., Sip˝ocz, B. M., et al. 2018, AJ, 156, 123 Astropy Collaboration, Robitaille, T. P., Tollerud, E. J., et al. 2013, A&A, 558, A33
work page 2009
-
[6]
Bieging, J. H. & Tafalla, M. 1993, AJ, 105, 576
work page 1993
-
[7]
Brunner, M., Danilovich, T., Ramstedt, S., et al. 2018, A&A, 617, A23
work page 2018
-
[8]
Cami, J., Bernard-Salas, J., Peeters, E., & Malek, S. E. 2010, Science, 329, 1180
work page 2010
-
[9]
Carlstrom, U., Olofsson, H., Johansson, L. E. B., Nguyen-Q-Rieu, & Sahai, R. 1990, in From Miras to Planetary Nebulae: Which Path for Stellar Evolution?, ed. M. O. Mennessier & A. Omont, 170
work page 1990
- [10]
-
[11]
Cernicharo, J., Teyssier, D., Quintana-Lacaci, G., et al. 2014, ApJ, 796, L21
work page 2014
- [12]
-
[13]
Cordiner, M. A. & Millar, T. J. 2009, ApJ, 697, 68
work page 2009
-
[14]
Danilovich, T., Ramstedt, S., Gobrecht, D., et al. 2018, A&A, 617, A132
work page 2018
-
[15]
Danilovich, T., Richards, A. M. S., Karakas, A. I., et al. 2019, MNRAS, 484, 494
work page 2019
- [16]
- [17]
- [18]
-
[19]
P., Schlemmer, S., Schilke, P., Stutzki, J., & Müller, H
Endres, C. P., Schlemmer, S., Schilke, P., Stutzki, J., & Müller, H. S. P. 2016, Journal of Molecular Spectroscopy, 327, 95 Fonfría, J. P., Cernicharo, J., Richter, M. J., et al. 2015, MNRAS, 453, 439 Fonfría, J. P., Fernández-López, M., Pardo, J. R., et al. 2018, ApJ, 860, 162 Fonfría Expósito, J. P., Agúndez, M., Tercero, B., Pardo, J. R., & Cernicharo,...
work page 2016
-
[20]
2015, A&A, 574, A56 González Delgado, D., Olofsson, H., Kerschbaum, F., et al
Gong, Y ., Henkel, C., Spezzano, S., et al. 2015, A&A, 574, A56 González Delgado, D., Olofsson, H., Kerschbaum, F., et al. 2003, A&A, 411, 123
work page 2015
-
[21]
H., Dinh-V-Trung, Kwok, S., et al
He, J. H., Dinh-V-Trung, Kwok, S., et al. 2008, ApJS, 177, 275
work page 2008
-
[22]
Heays, A. N., Bosman, A. D., & van Dishoeck, E. F. 2017, A&A, 602, A105 Höfner, S. & Olofsson, H. 2018, A&A Rev., 26, 1
work page 2017
-
[23]
Karakas, A. I. & Lugaro, M. 2016, ApJ, 825, 26
work page 2016
- [24]
-
[25]
L., Olofsson, H., Bergman, P., & Ramstedt, S
Maercker, M., Schöier, F. L., Olofsson, H., Bergman, P., & Ramstedt, S. 2008, A&A, 479, 779
work page 2008
-
[26]
Maes, S., Van de Sande, M., Danilovich, T., De Ceuster, F., & Decin, L. 2023, MNRAS, 522, 4654
work page 2023
- [27]
- [28]
-
[29]
Matsuura, M., Barlow, M. J., Zijlstra, A. A., et al. 2009, MNRAS, 396, 918
work page 2009
-
[30]
Millar, T. J., Herbst, E., & Bettens, R. P. A. 2000, MNRAS, 316, 195
work page 2000
-
[31]
J., Walsh, C., Van de Sande, M., & Markwick, A
Millar, T. J., Walsh, C., Van de Sande, M., & Markwick, A. J. 2024, A&A, 682, A109 Müller, H. S., Schlöder, F., Stutzki, J., & Winnewisser, G. 2005, Journal of Molecular Structure, 742, 215
work page 2024
-
[32]
Nguyen-Quang-Rieu, Deguchi, S., Izumiura, H., et al. 1988, ApJ, 330, 374
work page 1988
-
[33]
Olofsson, H., Johansson, L. E. B., Hjalmarson, A., & Nguyen-Quang-Rieu. 1982, A&A, 107, 128
work page 1982
-
[34]
R., Cernicharo, J., Tercero, B., et al
Pardo, J. R., Cernicharo, J., Tercero, B., et al. 2022, A&A, 658, A39
work page 2022
- [35]
-
[36]
Peng, T.-C., Humphreys, E. M. L., Testi, L., et al. 2013, A&A, 559, L8
work page 2013
-
[37]
Pickett, H. M., Poynter, R. L., Cohen, E. A., et al. 1998, J. Quant. Spectr. Rad. Transf., 60, 883
work page 1998
-
[38]
Preibisch, T., Ossenkopf, V ., Yorke, H. W., & Henning, T. 1993, A&A, 279, 577
work page 1993
- [39]
-
[40]
Ramstedt, S., Vlemmings, W. H. T., Doan, L., et al. 2020, A&A, 640, A133
work page 2020
-
[41]
Sahai, R., Wootten, A., & Clegg, R. E. S. 1984, ApJ, 284, 144 Schöier, F. L., Bast, J., Olofsson, H., & Lindqvist, M. 2007, A&A, 473, 871 Schöier, F. L., Olofsson, H., & Lundgren, A. A. 2006, A&A, 454, 247
work page 1984
-
[42]
A., Van de Sande, M., Millar, T
Siebert, M. A., Van de Sande, M., Millar, T. J., & Remijan, A. J. 2022, ApJ, 941, 90
work page 2022
- [43]
-
[44]
Tielens, A. G. G. M. 2005, The Physics and Chemistry of the Interstellar Medium
work page 2005
-
[45]
Tielens, A. G. G. M. 2008, ARA&A, 46, 289
work page 2008
- [46]
-
[47]
Unnikrishnan, R., Andriantsaralaza, M., De Beck, E., et al. 2025, A&A, 699, A48
work page 2025
-
[48]
Unnikrishnan, R., De Beck, E., Nyman, L. Å., et al. 2024, A&A, 684, A4 Van de Sande, M., Decin, L., Lombaert, R., et al. 2018a, A&A, 609, A63 Van de Sande, M., Gueguen, M., Danilovich, T., & Millar, T. J. 2025, MNRAS [arXiv:2511.13638] Van de Sande, M. & Millar, T. J. 2022, MNRAS, 510, 1204 Van de Sande, M., Sundqvist, J. O., Millar, T. J., et al. 2018b, ...
-
[49]
2019, A&A, 629, A146 Velilla Prieto, L., Cernicharo, J., Quintana-Lacaci, G., et al
Velilla-Prieto, L., Cernicharo, J., Agúndez, M., et al. 2019, A&A, 629, A146 Velilla Prieto, L., Cernicharo, J., Quintana-Lacaci, G., et al. 2015, ApJ, 805, L13
work page 2019
-
[50]
Woods, P. M., Schöier, F. L., Nyman, L. Å., & Olofsson, H. 2003, A&A, 402, 617
work page 2003
-
[51]
Zeichner, S. S., Aponte, J. C., Bhattacharjee, S., et al. 2023, Science, 382, 1411
work page 2023
-
[52]
0.00 0.05 0.10 29SiO (2-1) ALMA 2.29
Zinner, E., Nittler, L. R., Gallino, R., et al. 2006, ApJ, 650, 350 Article number, page 14 R. Unnikrishnan et al.: SiO and SiS abundances in carbon stars Appendix A: Observed line intensities Table A.1: SiO lines used in this work. Transition Rest Frequency [GHz] Eup [K] Telescope Integrated Intensity [Jy km s−1 for ALMA and ACA; K km s−1 for others] 151...
work page 2006
discussion (0)
Sign in with ORCID, Apple, or X to comment. Anyone can read and Pith papers without signing in.