Comprehensive Dataset and Signal Processing Framework for Phonocardiogram-Based Heart Rate and Blood Pressure Estimation
Pith reviewed 2026-05-25 03:27 UTC · model grok-4.3
The pith
Phonocardiogram signals alone can estimate heart rate via peak detection and blood pressure via multiple regression, as shown on a 15-participant dataset.
A machine-rendered reading of the paper's core claim, the machinery that carries it, and where it could break.
Core claim
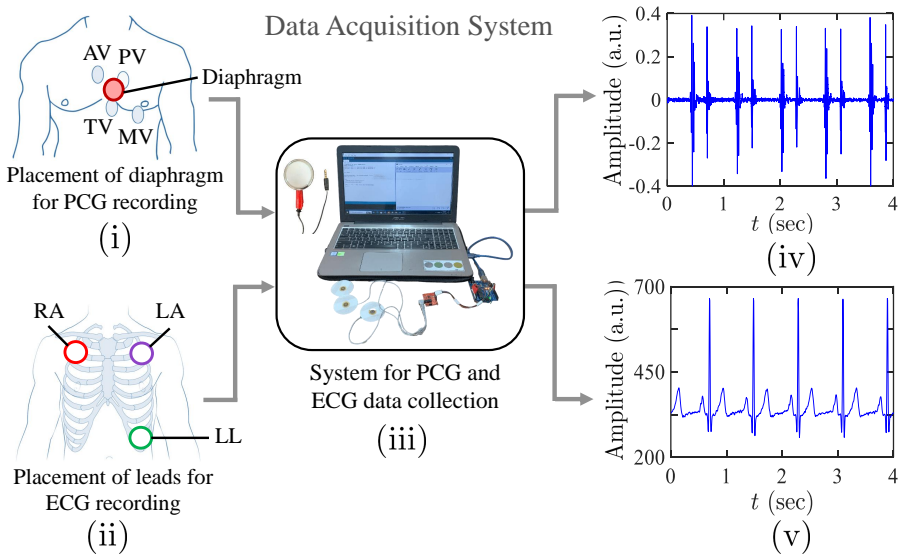
Using only phonocardiogram recordings collected from fifteen participants, the authors demonstrate that heart rate can be recovered by applying Hilbert Transform, Shannon Entropy, or WES peak detection, yielding Pearson correlations of 0.965, 0.973, and 0.955 and RMSE values of 2.467, 1.688, and 1.992 bpm respectively; the same recordings are then used to fit a semi-empirical multiple-regression model that estimates systolic blood pressure to a standard deviation of 2.10 mmHg (correlation 0.89) and diastolic blood pressure to 3.20 mmHg (correlation 0.70).
What carries the argument
The PhonoTrack pipeline that first locates heart-sound peaks with one of three detection algorithms and then feeds extracted features into a multiple-regression model for blood-pressure prediction.
If this is right
- Heart rate can be obtained from phonocardiogram signals alone at clinical accuracy using any of the three tested peak detectors.
- Systolic and diastolic pressures can be estimated from the same signals with standard deviations of 2.10 mmHg and 3.20 mmHg across the study group.
- A single low-cost sensor suffices for simultaneous heart-rate and blood-pressure tracking, removing the need for multimodal hardware.
- The reported error levels support development of portable devices intended for continuous or at-home cardiovascular monitoring.
- The fifteen-person dataset supplies a public benchmark for future phonocardiogram-based estimation algorithms.
Where Pith is reading between the lines
- Releasing the full dataset would let other groups test whether the regression coefficients transfer to different age groups or recording hardware.
- Embedding the peak-detection and regression steps in a smartphone app could turn ordinary microphones into basic vital-sign monitors.
- The same feature set might be examined for additional cardiac markers such as murmur detection or arrhythmia classification.
- Long-term recordings from the same subjects would reveal whether day-to-day blood-pressure drift remains within the reported error bounds.
Load-bearing premise
The multiple regression model fitted to features from the fifteen-participant dataset will produce reliable blood-pressure estimates for new subjects and real-world recording conditions.
What would settle it
Recording phonocardiograms from a fresh group of fifteen or more participants, applying the published regression coefficients, and obtaining standard deviations above 5 mmHg or correlations below 0.5 for either systolic or diastolic pressure.
Figures


read the original abstract
Cardiovascular diseases (CVDs) represent significant global health challenges today, necessitating regular and reliable monitoring to enable early intervention. Phonocardiogram (PCG) signals present a promising non-invasive method for assessing cardiovascular health. While recent studies have focused on estimating heart rate (HR) from PCG signals and blood pressure (BP) through multimodal combinations with other physiological data, reliable and cost-effective systems that can predict both HR and BP using only PCG signals remain largely unexplored. In this study, we proposed and developed a lab-scale cost-effective Phonocardiogram Tracking (PhonoTrack) system that can measure both HR and BP using only the PCG signal. We also introduced a corresponding dataset collected from 15 participants to evaluate the effectiveness of the proposed system. HR was determined using several peak detection methods, such as Hilbert Transform (HT), Shannon Entropy (SE), and WES, achieving notable Pearson correlation coefficients of 0.965, 0.973, and 0.955, respectively. The corresponding root mean square errors (RMSEs) were 2.467 bpm, 1.688 bpm, and 1.992 bpm for HT, SE, and WES, respectively. Additionally, we developed an advanced semi-empirical model based on multiple regression techniques to estimate systolic blood pressure (SBP) and diastolic blood pressure (DBP). This model demonstrated standard deviations of 2.10 mmHg for SBP and 3.20 mmHg for DBP across all subjects, with Pearson correlation coefficients of 0.89 and 0.70, respectively. These findings pave the way for developing a non-invasive, low-cost, and portable PhonoTrack device, positioning it as a promising solution for continuous cardiovascular monitoring settings.
Editorial analysis
A structured set of objections, weighed in public.
Referee Report
Summary. The manuscript presents the PhonoTrack system for estimating both heart rate (HR) and blood pressure (BP) from phonocardiogram (PCG) signals alone. It introduces a 15-participant dataset and evaluates three peak-detection methods (Hilbert Transform, Shannon Entropy, WES) for HR, reporting Pearson correlations of 0.965/0.973/0.955 and RMSEs of 2.467/1.688/1.992 bpm. For BP, a multiple-regression semi-empirical model is fitted to yield standard deviations of 2.10 mmHg (SBP) and 3.20 mmHg (DBP) with correlations 0.89 and 0.70 “across all subjects.”
Significance. A validated single-signal PCG method for joint HR and BP estimation would be useful for low-cost continuous monitoring. The HR component is benchmarked against an external reference and shows strong numerical agreement. The BP regression, however, supplies the novel modeling contribution; its reported metrics cannot be interpreted as evidence of generalization without out-of-sample validation.
major comments (1)
- [Abstract] Abstract (BP estimation paragraph): The reported SBP/DBP standard deviations and Pearson correlations are stated to be obtained “across all subjects” from a multiple regression model whose coefficients are free parameters fitted to the identical 15-subject dataset. No description of hold-out testing, subject-wise cross-validation, or external test set is supplied, so the figures are in-sample fit statistics whose out-of-sample behavior is unknown. This directly affects the central claim that the model produces reliable BP estimates.
minor comments (1)
- [Abstract] The abstract refers to an “advanced semi-empirical model” and “multiple regression techniques” but supplies neither the explicit regression equation nor the list of PCG-derived features used as predictors.
Simulated Author's Rebuttal
We thank the referee for the detailed review and for identifying the need to clarify the validation procedure for the blood-pressure regression model. We address the single major comment below and will revise the manuscript to strengthen the presentation of results.
read point-by-point responses
-
Referee: [Abstract] Abstract (BP estimation paragraph): The reported SBP/DBP standard deviations and Pearson correlations are stated to be obtained “across all subjects” from a multiple regression model whose coefficients are free parameters fitted to the identical 15-subject dataset. No description of hold-out testing, subject-wise cross-validation, or external test set is supplied, so the figures are in-sample fit statistics whose out-of-sample behavior is unknown. This directly affects the central claim that the model produces reliable BP estimates.
Authors: We agree that the reported SBP and DBP statistics reflect an in-sample fit of the multiple-regression coefficients to the full 15-subject dataset. The manuscript does not currently describe any hold-out, cross-validation, or external testing procedure for the blood-pressure model. In the revised manuscript we will add a subject-wise leave-one-out cross-validation analysis for the semi-empirical BP regression, report the resulting out-of-sample Pearson correlations and standard deviations, and update both the abstract and the main text to reflect these metrics. This change will directly address the concern about generalization. revision: yes
Circularity Check
BP regression reports in-sample fit metrics on n=15 dataset with no hold-out or cross-validation described
specific steps
-
fitted input called prediction
[Abstract]
"we developed an advanced semi-empirical model based on multiple regression techniques to estimate systolic blood pressure (SBP) and diastolic blood pressure (DBP). This model demonstrated standard deviations of 2.10 mmHg for SBP and 3.20 mmHg for DBP across all subjects, with Pearson correlation coefficients of 0.89 and 0.70, respectively."
The regression coefficients are fitted directly to features extracted from the identical 15-participant dataset; the reported SD and correlation values are then computed on that same dataset ('across all subjects'), so the quoted performance metrics are in-sample fit statistics rather than independent predictions.
full rationale
HR peak-detection results (HT, SE, WES) are benchmarked against an external reference signal, yielding independent correlation and RMSE values. The novel BP contribution, however, is a multiple-regression model whose coefficients are estimated on the same 15-subject PCG dataset used to compute the reported SD and Pearson r values 'across all subjects.' No subject-wise partitioning, regularization, or external test set is described, so the quoted performance numbers reduce to in-sample fit statistics.
Axiom & Free-Parameter Ledger
free parameters (1)
- multiple regression coefficients for SBP and DBP
axioms (1)
- domain assumption Phonocardiogram signals contain extractable features sufficient for accurate blood pressure estimation
Reference graph
Works this paper leans on
-
[1]
Advancements in wearable heart sounds devices for the monitoring of cardiovascular diseases,
R. u. S. Ahmad, M. S. Khan, M. E. Hilal, B. Khan, Y. Zhang, and B. L. Khoo, “Advancements in wearable heart sounds devices for the monitoring of cardiovascular diseases,” SmartMat, vol. 6, no. 1, p. e1311, 2025
work page 2025
-
[2]
Foundation models for cardiovas- cular disease detection via biosignals from digital stethoscopes,
G. Mathew, D. Barbosa, J. Prince, and S. Venkatraman, “Foundation models for cardiovas- cular disease detection via biosignals from digital stethoscopes,” npj Cardiovascular Health, vol. 1, no. 1, p. 25, 2024
work page 2024
-
[3]
A novel wearable device integrating ECGandPCGfor cardiac health monitoring,
J. Zang, Q. An, B. Li, Z. Zhang, L. Gao, and C. Xue, “A novel wearable device integrating ECGandPCGfor cardiac health monitoring,” Microsystems & Nanoengineering, vol. 11, no. 1, p. 7, 2025
work page 2025
-
[4]
A history of cardiac auscultation and some of its contrib- utors,
I. R. Hanna and M. E. Silverman, “A history of cardiac auscultation and some of its contrib- utors,” The American Journal of Cardiology, vol. 90, no. 3, pp. 259–267, 2002
work page 2002
-
[5]
A. Gudigar, U. Raghavendra, M. Maithri, J. Samanth, M. A. Inamdar, V. Vidhya, V. Jah- munah, M. A. Prabhu, R.-S. Tan, C. H. Yeong, et al., “Automated system for the detection of heart anomalies using phonocardiograms: A systematic review (2013-2023),” IEEE Access, 2024
work page 2013
-
[6]
The physiology of cardiac auscultation,
A. N. Pelech, “The physiology of cardiac auscultation,” Pediatric Clinics, vol. 51, no. 6, pp. 1515–1535, 2004
work page 2004
-
[7]
A novel cardiac auscultation monitoring system based on wireless sensing for healthcare,
H. Ren, H. Jin, C. Chen, H. Ghayvat, and W. Chen, “A novel cardiac auscultation monitoring system based on wireless sensing for healthcare,” IEEE Journal of Translational Engineering in Health and Medicine, vol. 6, pp. 1–12, 2018
work page 2018
-
[8]
A comprehensive survey on heart sound analysis in the deep learning era,
Z. Ren, Y. Chang, T. T. Nguyen, Y. Tan, K. Qian, and B. W. Schuller, “A comprehensive survey on heart sound analysis in the deep learning era,” IEEE Computational Intelligence Magazine, vol. 19, no. 3, pp. 42–57, 2024. 30
work page 2024
-
[9]
S. Ismail, I. Siddiqi, and U. Akram, “Localization and classification of heart beats in phono- cardiography signals–a comprehensive review,” EURASIP Journal on Advances in Signal Processing, vol. 2018, no. 1, pp. 1–27, 2018
work page 2018
-
[10]
Simultaneous monitoring of ballisto- cardiogram and photoplethysmogram using a camera,
D. Shao, F. Tsow, C. Liu, Y. Yang, and N. Tao, “Simultaneous monitoring of ballisto- cardiogram and photoplethysmogram using a camera,” IEEE Transactions on Biomedical Engineering, vol. 64, no. 5, pp. 1003–1010, 2016
work page 2016
-
[11]
E. Pinheiro, O. Postolache, and P. Gir˜ ao, “A survey on unobtrusive measurements of the cardiovascular function and their practical implementation in wheelchairs,” Sensors & Transducers, vol. 9, p. 182, 2010
work page 2010
-
[12]
Modern diagnostic imaging technique applications and risk factors in the medical field: a review,
S. Hussain, I. Mubeen, N. Ullah, S. S. U. D. Shah, B. A. Khan, M. Zahoor, R. Ullah, F. A. Khan, and M. A. Sultan, “Modern diagnostic imaging technique applications and risk factors in the medical field: a review,” BioMed Research International, vol. 2022, no. 1, p. 5164970, 2022
work page 2022
-
[13]
A novel approach to simultaneous phonocardiography and electrocardiography during auscultation,
S. M. Monteiro and H. P. Da Silva, “A novel approach to simultaneous phonocardiography and electrocardiography during auscultation,” IEEE Access, vol. 11, pp. 78224–78236, 2023
work page 2023
-
[14]
D. K. Ming, S. Sangkaew, H. Q. Chanh, P. T. Nhat, S. Yacoub, P. Georgiou, and A. H. Holmes, “Continuous physiological monitoring using wearable technology to inform individual manage- ment of infectious diseases, public health and outbreak responses,” International Journal of Infectious Diseases, vol. 96, pp. 648–654, 2020
work page 2020
-
[15]
Continuous health moni- toring: An opportunity for precision health,
S. S. Gambhir, T. J. Ge, O. Vermesh, R. Spitler, and G. E. Gold, “Continuous health moni- toring: An opportunity for precision health,” Science Translational Medicine, vol. 13, no. 597, p. eabe5383, 2021
work page 2021
-
[16]
A. dos Santos Silva, M. V. Correia, A. G. da Costa, and H. P. da Silva, “Towards non-intrusive blood pressure estimation using thigh ecg and ppg signals acquired from a smart toilet seat,” in 2025 IEEE 8th Portuguese Meeting on Bioengineering (ENBENG), pp. 121–124, IEEE, 2025
work page 2025
-
[17]
Blood pressure estimation based on synchronous ecg and ppg recording,
A. C. Podaru and V. David, “Blood pressure estimation based on synchronous ecg and ppg recording,” in 2020 International Conference and Exposition on Electrical And Power Engineering (EPE), pp. 640–645, IEEE, 2020
work page 2020
-
[18]
Optimized machine learning for real-time, non-invasive blood pressure mon- itoring,
N. M. Eldakhly, “Optimized machine learning for real-time, non-invasive blood pressure mon- itoring,” The Journal of Supercomputing, vol. 81, no. 7, pp. 1–42, 2025
work page 2025
-
[19]
J. Lin, S. Wang, W. Xuan, D. Chen, F. Liu, J. Chen, S. Xia, S. Dong, and J. Luo, “Portable ecg and pcg wireless acquisition system and multiscale cnn feature fusion bi-lstm network for coronary artery disease diagnosis,” Computers in Biology and Medicine, vol. 191, p. 110202, 2025. 31
work page 2025
-
[20]
M. Fynn, K. Mandana, J. Rashid, S. Nordholm, Y. Rong, and G. Saha, “Practicality meets precision: Wearable vest with integrated multi-channel pcg sensors for effective coronary artery disease pre-screening,” Computers in Biology and Medicine, vol. 189, p. 109904, 2025
work page 2025
-
[21]
Estimation of systolic blood pressure by random forest using heart sounds and a ballistocardiogram,
R. Gonzalez-Landaeta, B. Ramirez, and J. Mejia, “Estimation of systolic blood pressure by random forest using heart sounds and a ballistocardiogram,” Scientific Reports, vol. 12, no. 1, p. 17196, 2022
work page 2022
-
[22]
Preprocessing techniques for brain signal data: Noise reduction and artifact removal methods,
U. Chaudhary, “Preprocessing techniques for brain signal data: Noise reduction and artifact removal methods,” in Expanding Senses using Neurotechnology: Volume 1–Foundation of Brain-Computer Interface Technology, pp. 119–178, Springer, 2025
work page 2025
-
[23]
The PAS- CAL Classifying Heart Sounds Challenge 2011 (CHSC2011) Results
P. Bentley, G. Nordehn, M. Coimbra, and S. Mannor, “The PAS- CAL Classifying Heart Sounds Challenge 2011 (CHSC2011) Results. ” http://www.peterjbentley.com/heartchallenge/index.html
work page 2011
-
[24]
G. D. Clifford, C. Liu, B. Moody, D. Springer, I. Silva, Q. Li, and R. G. Mark, “Classification of normal/abnormal heart sound recordings: The physionet/computing in cardiology challenge 2016,” in 2016 Computing in Cardiology Conference (CinC), pp. 609–612, IEEE, 2016
work page 2016
-
[25]
An open-access simultaneous electrocardiogram and phonocardiogram database,
A. Kazemnejad, S. Karimi, P. Gordany, G. D. Clifford, and R. Sameni, “An open-access simultaneous electrocardiogram and phonocardiogram database,” Physiological Measurement, vol. 45, no. 5, p. 055005, 2024
work page 2024
-
[26]
A hardware-software system for accurate segmentation of phonocardiogram signal,
M. M. Movahedi, M. Shakerpour, S. Mousavi, A. Nori, S. H. M. Dehkordi, and H. Parsaei, “A hardware-software system for accurate segmentation of phonocardiogram signal,” Journal of Biomedical Physics & Engineering, vol. 13, no. 3, p. 261, 2023
work page 2023
-
[27]
R. Touahria, A. Hacine-Gharbi, and P. Ravier, “Feature selection algorithms highlight the importance of the systolic segment for normal/murmur pcg beat classification,” Biomedical Signal Processing and Control, vol. 86, p. 105288, 2023
work page 2023
-
[28]
Calculating blood pressure based on measured heart sounds,
L. Chen, S. F. Wu, Y. Xu, W. D. Lyman, and G. Kapur, “Calculating blood pressure based on measured heart sounds,” Journal of Computational Acoustics, vol. 25, no. 03, p. 1750014, 2017
work page 2017
-
[29]
A comprehensive overview of heart sound analysis using machine learning methods,
M. F. A. B. Hamza and N. N. A. Sjarif, “A comprehensive overview of heart sound analysis using machine learning methods,” IEEE Access, 2024
work page 2024
-
[30]
A low- cost, portable, high-throughput wireless sensor system for phonocardiography applications,
A. Sa-Ngasoongsong, J. Kunthong, V. Sarangan, X. Cai, and S. T. Bukkapatnam, “A low- cost, portable, high-throughput wireless sensor system for phonocardiography applications,” Sensors, vol. 12, no. 8, pp. 10851–10870, 2012. 32
work page 2012
-
[31]
Wearable devices for patient monitoring in the intensive care unit,
A. Angelucci, M. Greco, M. Cecconi, and A. Aliverti, “Wearable devices for patient monitoring in the intensive care unit,” Intensive Care Medicine Experimental, vol. 13, no. 1, p. 26, 2025
work page 2025
-
[32]
2013 esh/esc guidelines for the management of arterial hypertension,
G. Mancia, R. Fagard, K. Narkiewicz, J. Redon, A. Zanchetti, M. B¨ ohm, T. Christiaens, R. Cifkova, G. De Backer, A. Dominiczak, et al., “2013 esh/esc guidelines for the management of arterial hypertension,” Arterial Hypertension, vol. 17, no. 2, pp. 69–168, 2013
work page 2013
-
[33]
The japanese society of hypertension guidelines for the manage- ment of hypertension (jsh 2014),
K. Shimamoto, K. Ando, T. Fujita, N. Hasebe, J. Higaki, M. Horiuchi, Y. Imai, T. Imaizumi, T. Ishimitsu, M. Ito, et al., “The japanese society of hypertension guidelines for the manage- ment of hypertension (jsh 2014),” Hypertension Research, vol. 37, no. 4, pp. 253–390, 2014
work page 2014
-
[34]
Understanding short- term blood-pressure-variability phenotypes: from concept to clinical practice,
V. M. Chadachan, M. T. Ye, J. C. Tay, K. Subramaniam, and S. Setia, “Understanding short- term blood-pressure-variability phenotypes: from concept to clinical practice,” International journal of general medicine, pp. 241–254, 2018
work page 2018
-
[35]
Measuring blood pressure accurately,
American Heart Association, “Measuring blood pressure accurately,” 2026. [Online]. Avail- able: https://www2.heart.org/site/DocServer/Break 1 - Measure BP Accurately.pdf. Ac- cessed: Jan. 8, 2026
work page 2026
-
[36]
A. E. T. Sean Dornbush, “Physiology, heart sounds,” National Library of Medicine, 2023
work page 2023
-
[37]
An open access database for the evaluation of heart sound algorithms,
C. Liu, D. Springer, Q. Li, B. Moody, R. A. Juan, F. J. Chorro, F. Castells, J. M. Roig, I. Silva, A. E. Johnson, et al., “An open access database for the evaluation of heart sound algorithms,” Physiological Measurement, vol. 37, no. 12, p. 2181, 2016
work page 2016
-
[38]
The circor digiscope dataset: from murmur detection to murmur classification,
J. Oliveira, F. Renna, P. D. Costa, M. Nogueira, C. Oliveira, C. Ferreira, A. Jorge, S. Mattos, T. Hatem, T. Tavares,et al., “The circor digiscope dataset: from murmur detection to murmur classification,” IEEE Journal of Biomedical and Health Informatics, vol. 26, no. 6, pp. 2524– 2535, 2021
work page 2021
-
[39]
R. J. Noble, J. S. Hillis, and D. A. Rothbaum, “Electrocardiography,” in Clinical Methods: The History, Physical, and Laboratory Examinations (H. K. Walker, W. D. Hall, and J. W. Hurst, eds.), ch. 33, Boston: American Medical Association, 3 ed., 1990. Chapter 33
work page 1990
-
[40]
B. Surawicz, R. Childers, B. J. Deal, and L. S. Gettes, “Aha/accf/hrs recommendations for the standardization and interpretation of the electrocardiogram: part iii: intraventricular conduction disturbances a scientific statement from the american heart association electro- cardiography and arrhythmias committee, council on clinical cardiology; the america...
work page 2009
-
[41]
H. Rabbani, M. P. Mahjoob, E. Farahabadi, and A. Farahabadi, “R peak detection in electro- cardiogram signal based on an optimal combination of wavelet transform, hilbert transform, and adaptive thresholding,” Journal of Medical Signals & Sensors, vol. 1, no. 2, pp. 91–98, 2011
work page 2011
-
[42]
Reliable peak detection and feature extraction for wireless electrocardiograms,
S. Farrokhi, W. Dargie, and C. Poellabauer, “Reliable peak detection and feature extraction for wireless electrocardiograms,” Computers in Biology and Medicine, vol. 185, p. 109478, 2025
work page 2025
-
[43]
Comparison of wavelet types and thresholding methods on wavelet based denoising of heart sounds,
B. Ergen, “Comparison of wavelet types and thresholding methods on wavelet based denoising of heart sounds,” Journal of Signal and Information Processing, vol. 4, no. 3B, p. 164, 2013
work page 2013
-
[44]
Detection of s1 and s2 locations in phonocardiogram signals using zero frequency filter,
R. Prasad, G. Yilmaz, O. Chetelat, and M. M. Doss, “Detection of s1 and s2 locations in phonocardiogram signals using zero frequency filter,” inICASSP 2020-2020 IEEE International Conference on Acoustics, Speech and Signal Processing (ICASSP), pp. 1254–1258, IEEE, 2020
work page 2020
-
[45]
A noise-robust heart sound segmentation algorithm based on shannon energy,
Y. Arjoune, T. N. Nguyen, R. W. Doroshow, and R. Shekhar, “A noise-robust heart sound segmentation algorithm based on shannon energy,”IEEE Access, vol. 12, pp. 7747–7761, 2024
work page 2024
-
[46]
Segmentation of s1–s2 sounds in phonocardiogram records using wavelet energies,
M. Yamacli, Z. Dokur, and T. Olmez, “Segmentation of s1–s2 sounds in phonocardiogram records using wavelet energies,” in 2008 23rd International Symposium on Computer and Information Sciences, pp. 1–6, IEEE, 2008
work page 2008
-
[47]
Separation of heart sounds and heart murmurs by hilbert transform envelogram,
A. Atbi, S. Debbal, F. Meziani, and A. Meziane, “Separation of heart sounds and heart murmurs by hilbert transform envelogram,” Journal of Medical Engineering & Technology, vol. 37, no. 6, pp. 375–387, 2013
work page 2013
-
[48]
The use of the hilbert transform in ECGsignal analysis,
D. Benitez, P. Gaydecki, A. Zaidi, and A. Fitzpatrick, “The use of the hilbert transform in ECGsignal analysis,” Computers in Biology and Medicine, vol. 31, no. 5, pp. 399–406, 2001
work page 2001
-
[49]
ShannonâĂŹs energy based algorithm inECGsig- nal processing,
H. Beyramienanlou and N. Lotfivand, “ShannonâĂŹs energy based algorithm inECGsig- nal processing,” Computational and Mathematical Methods in Medicine, vol. 2017, no. 1, p. 8081361, 2017
work page 2017
-
[50]
Time-frequency analysis of phonocardiogram signals using wavelet transform: a comparative study,
B. Ergen, Y. Tatar, and H. O. Gulcur, “Time-frequency analysis of phonocardiogram signals using wavelet transform: a comparative study,” Computer Methods in Biomechanics and Biomedical Engineering, vol. 15, no. 4, pp. 371–381, 2012
work page 2012
-
[51]
Logistic regression-hsmm-based heart sound segmentation,
D. B. Springer, L. Tarassenko, and G. D. Clifford, “Logistic regression-hsmm-based heart sound segmentation,” IEEE transactions on biomedical engineering, vol. 63, no. 4, pp. 822–832, 2015
work page 2015
-
[52]
An automatic segmentation method for heart sounds,
Q. Liu, X. Wu, and X. Ma, “An automatic segmentation method for heart sounds,”Biomedical engineering online, vol. 17, no. 1, p. 106, 2018. 34
work page 2018
-
[53]
A. Strazza, A. Sbrollini, V. Di Battista, R. Ricci, L. Trillini, I. Marcantoni, M. Morettini, S. Fioretti, and L. Burattini, “Pcg-delineator: an efficient algorithm for automatic heart sounds detection in fetal phonocardiography,” in 2018 Computing in Cardiology Conference (CinC), vol. 45, pp. 1–4, IEEE, 2018
work page 2018
- [54]
-
[55]
Automated detection of heart valve disorders with time-frequency and deep fea- tures onPCGsignals,
¨O. Arslan, “Automated detection of heart valve disorders with time-frequency and deep fea- tures onPCGsignals,” Biomedical Signal Processing and Control, vol. 78, p. 103929, 2022
work page 2022
-
[56]
Classification of normal/abnormalPCGrecordings using a time–frequency approach,
H. Hazeri, P. Zarjam, and G. Azemi, “Classification of normal/abnormalPCGrecordings using a time–frequency approach,”Analog Integrated Circuits and Signal Processing, vol. 109, no. 2, pp. 459–465, 2021
work page 2021
-
[57]
R. B. Pachori, Time-frequency analysis techniques and their applications. CRC Press, 2023
work page 2023
-
[58]
Time-frequency analysis, denoising, compression, segmentation, and classification of pcg signals,
T. H. Chowdhury, K. N. Poudel, and Y. Hu, “Time-frequency analysis, denoising, compression, segmentation, and classification of pcg signals,” IEEE Access, vol. 8, pp. 160882–160890, 2020
work page 2020
-
[59]
H. Kui, J. Pan, R. Zong, H. Yang, and W. Wang, “Heart sound classification based on log Mel-frequency spectral coefficients features and convolutional neural networks,” Biomedical Signal Processing and Control, vol. 69, p. 102893, 2021
work page 2021
-
[60]
PCGclassification through spectrogram using transfer learning,
S. Ismail, B. Ismail, I. Siddiqi, and U. Akram, “PCGclassification through spectrogram using transfer learning,” Biomedical Signal Processing and Control, vol. 79, p. 104075, 2023
work page 2023
-
[61]
Time–frequency analysis of phonocardiogram signals using wavelet transform: a comparative study,
B. Ergen, Y. Tatar, and H. O. Gulcur, “Time–frequency analysis of phonocardiogram signals using wavelet transform: a comparative study,” Computer Methods in Biomechanics and Biomedical Engineering, vol. 15, no. 4, pp. 371–381, 2012
work page 2012
-
[62]
Analysis of phonocardiogram signals using wavelet trans- form,
F. Meziani, S. Debbal, and A. Atbi, “Analysis of phonocardiogram signals using wavelet trans- form,” Journal of Medical Engineering & Technology, vol. 36, no. 6, pp. 283–302, 2012
work page 2012
-
[63]
N. Giordano, S. Rosati, and M. Knaflitz, “Automated assessment of the quality of phonocar- dographic recordings through signal-to-noise ratio for home monitoring applications,” Sensors, vol. 21, no. 21, p. 7246, 2021
work page 2021
-
[64]
Accurate detection of heart rate using in-ear photoplethysmography in a clinical setting,
T. Adams, S. Wagner, M. Baldinger, I. Zellhuber, M. Weber, D. Nass, and R. Surges, “Accurate detection of heart rate using in-ear photoplethysmography in a clinical setting,” Frontiers in Digital Health, vol. 4, p. 909519, 2022
work page 2022
-
[65]
A. Coste, G. Millour, and C. Hausswirth, “A comparative study betweenECG-andPPG- based heart rate sensors for heart rate variability measurements: influence of body position, duration, sex, and age,” Sensors, vol. 25, no. 18, p. 5745, 2025. 35
work page 2025
-
[66]
N. Dia, J. Fontecave-Jallon, P.-Y. Gumery, and B. Rivet, “Fetal heart rate estimation from a single phonocardiogram signal using non-negative matrix factorization,” in 2019 41st Annual International Conference of the IEEE Engineering in Medicine and Biology Society (EMBC), pp. 5983–5986, IEEE, 2019
work page 2019
-
[67]
Wearable cuff-less blood pressure estimation at home via pulse transit time,
V. G. Ganti, A. M. Carek, B. N. Nevius, J. A. Heller, M. Etemadi, and O. T. Inan, “Wearable cuff-less blood pressure estimation at home via pulse transit time,”IEEE journal of biomedical and health informatics, vol. 25, no. 6, pp. 1926–1937, 2020
work page 1926
-
[68]
A new approach for blood pressure estimation based on phonocardiogram,
T. Omari and F. Bereksi-Reguig, “A new approach for blood pressure estimation based on phonocardiogram,” Biomedical engineering letters, vol. 9, no. 3, pp. 395–406, 2019
work page 2019
-
[69]
D. N. Damani, D. S. B. Sundaram, S. Damani, A. Kapoor, A. M. Arruda-Olson, and S. P. Arunachalam, “Investigation of synchronized acquisition of electrocardiogram and phonocar- diogram signals towards electromechanical profiling of the heart,”Biomed Sci Instrum, vol. 57, p. 2, 2021
work page 2021
-
[70]
F. L. Loro, R. Martins, J. B. Ferreira, C. L. P. de Araujo, L. R. Prade, C. B. Both, J. C. N. Nobre, M. B. Monteiro, and P. Dal Lago, “Validation of a wearable sensor prototype for measuring heart rate to prescribe physical activity: cross-sectional exploratory study,” JMIR Biomedical Engineering, vol. 9, p. e57373, 2024. 36
work page 2024
discussion (0)
Sign in with ORCID, Apple, or X to comment. Anyone can read and Pith papers without signing in.