RASC: Region-Aware Self-Calibration for Dense 2D Sensor Arrays
Pith reviewed 2026-06-30 22:04 UTC · model grok-4.3
The pith
RASC decomposes global sensor-array calibration into local clusters reconciled by linear consensus to restore factory accuracy with far less bandwidth.
A machine-rendered reading of the paper's core claim, the machinery that carries it, and where it could break.
Core claim
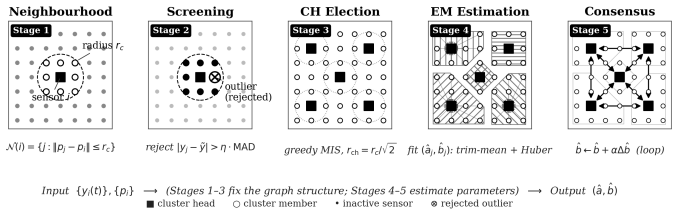
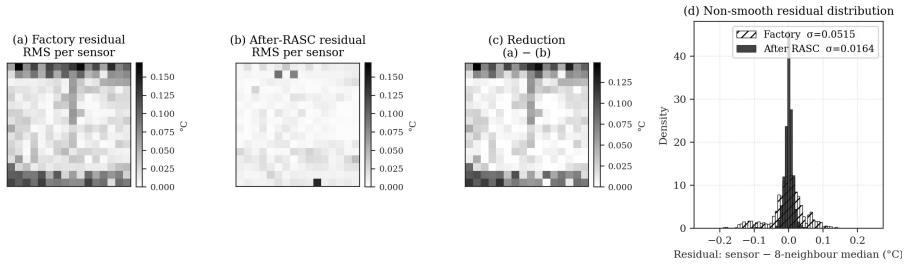
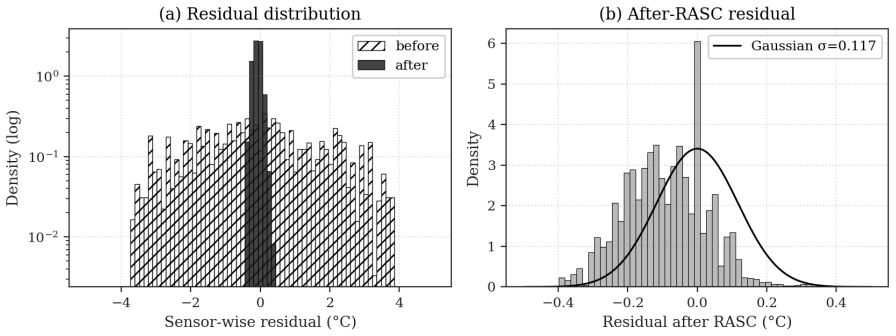
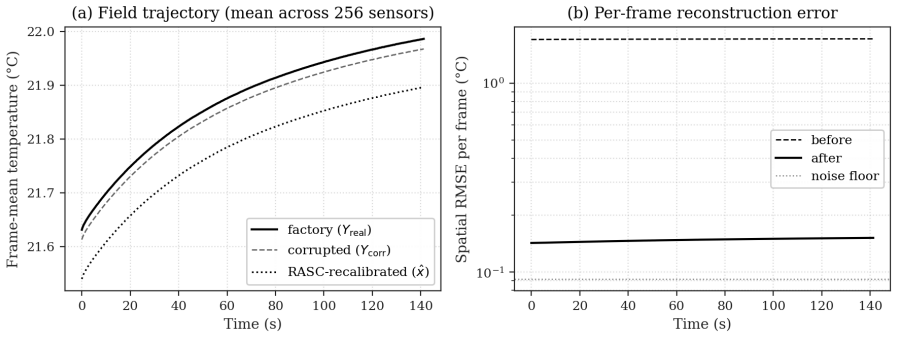
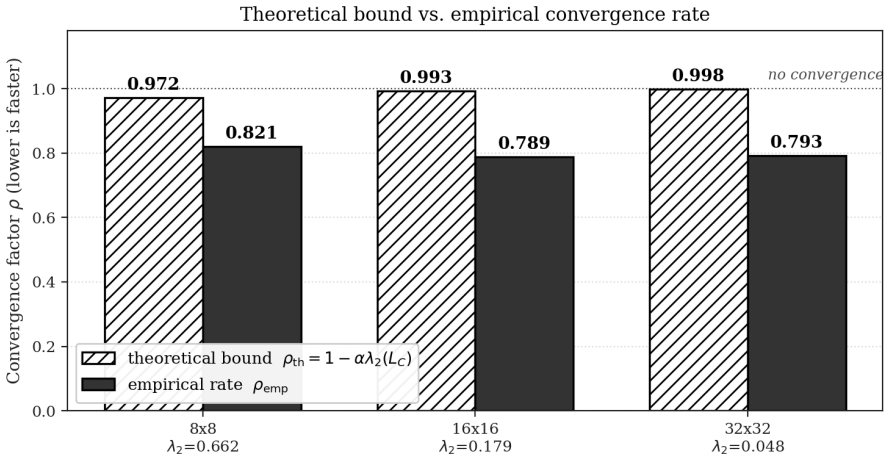
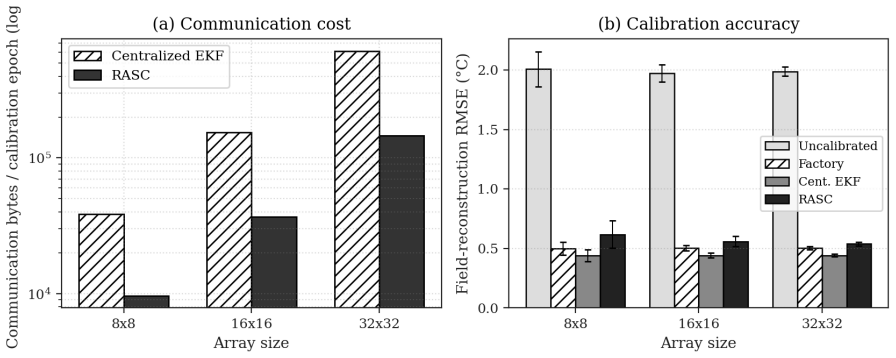
RASC decomposes the global ill-posed calibration problem into local cluster-level problems, runs robust alternating estimation (trimmed-mean field reconstruction plus Huber IRLS) inside each cluster, and reconciles overlapping estimates by linear consensus on the cluster-overlap graph with provable exponential convergence, cutting the fixed-pattern residual by 71 plus or minus 5 percent on deployed 16x16 data while matching centralized performance at four times lower bandwidth.
What carries the argument
Linear consensus reconciliation on the cluster-overlap graph that combines local robust estimations performed by trimmed-mean field reconstruction and Huber IRLS.
If this is right
- On real data the residual reduction reaches 78 percent at edges versus 55 percent in the interior.
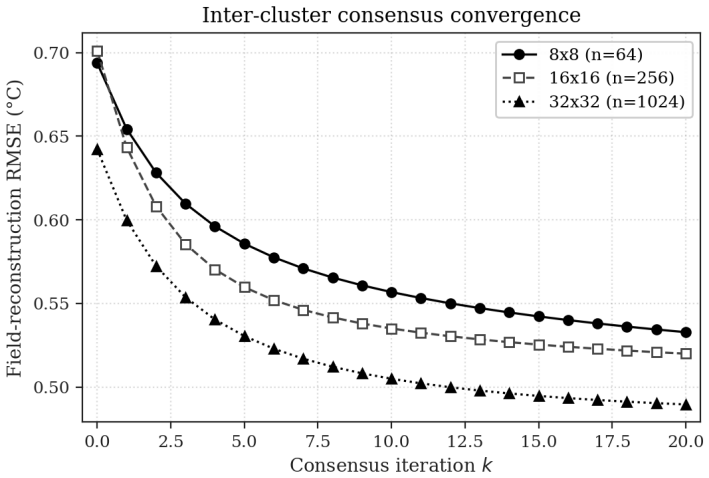
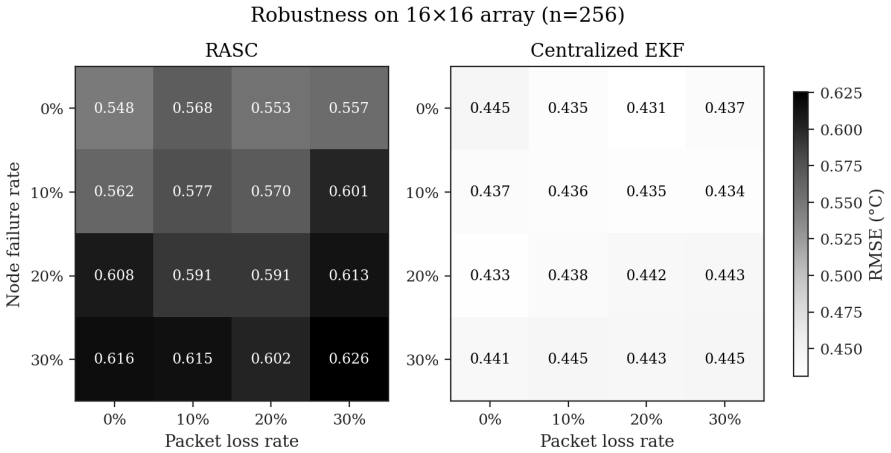
- The method matches centralized extended Kalman filter accuracy within 0.10 degree Celsius across simulated array sizes from 8x8 to 32x32.
- Bandwidth drops by a factor of approximately four while preserving the calibrated field to 0.041 degree Celsius RMSE.
- The approach restores factory plus or minus 0.1 degree Celsius accuracy on arrays that drifted by five times the specification.
Where Pith is reading between the lines
- The same cluster-plus-consensus structure could be tested on other dense 2D sensor modalities such as pressure or optical arrays.
- Exponential convergence of the consensus step suggests the method remains stable when cluster sizes or overlap densities vary across deployments.
- Lower per-node communication may allow practical scaling beyond 32x32 without proportional growth in network load.
- Edge-heavy improvement implies the method could be especially useful for arrays whose boundaries experience stronger mechanical stress.
Load-bearing premise
The global calibration problem can be split into independent local cluster problems whose solutions can be reconciled by linear consensus without significant loss of accuracy or added bias.
What would settle it
If consensus on a new 16x16 array produces a calibration whose RMSE against a centralized solution exceeds 0.10 degree Celsius on the same frames, the claim of matching oracle performance fails.
Figures
read the original abstract
BJT-based 2D temperature-sensor arrays are factory-calibrated to +/-0.1 degC, but post-deployment thermal and mechanical stresses drift their per-sensor gain-offset parameters by an order of magnitude, and in-lab recalibration is impractical. We present RASC (Region-Aware Self-Calibration), a five-stage algorithm that decomposes the global ill-posed problem into local cluster-level problems, runs robust alternating estimation (trimmed-mean field reconstruction + Huber IRLS) inside each cluster, and reconciles overlapping estimates by linear consensus on the cluster-overlap graph with provable exponential convergence. On 7,632 frames from a deployed 16x16 array exhibiting ~5x factory-spec non-uniformity, RASC cuts the locally-non-smooth fixed-pattern residual by 71+/-5% (10-fold CV), restoring +/-0.1 degC accuracy while perturbing the calibrated field by only 0.041 degC RMSE; reduction concentrates at the edges (78% vs 55% interior). In simulations on 8x8 to 32x32 arrays, RASC matches an oracle centralized EKF within 0.10 degC with ~4x lower bandwidth.
Editorial analysis
A structured set of objections, weighed in public.
Referee Report
Summary. The manuscript presents RASC, a five-stage algorithm for post-deployment self-calibration of BJT-based 2D temperature sensor arrays. It decomposes the globally ill-posed gain-offset problem into independent per-cluster alternating estimations (trimmed-mean field reconstruction + Huber IRLS), then reconciles overlapping solutions via linear consensus on the cluster-overlap graph, with a claimed proof of exponential convergence. On 7,632 frames from a real 16x16 array, it reports a 71+/-5% reduction in locally non-smooth fixed-pattern residual (10-fold CV) while perturbing the field by 0.041 degC RMSE; simulations on 8x8-32x32 arrays claim matching an oracle centralized EKF within 0.10 degC at ~4x lower bandwidth.
Significance. If the local-to-global reconciliation is shown to be unbiased and equivalent to centralized solutions, the approach would offer a practical, communication-efficient method for calibrating large deployed sensor arrays without in-lab access, directly addressing drift in factory-calibrated systems.
major comments (2)
- [Abstract] Abstract (paragraph describing the five-stage algorithm): the central assumption that independent local cluster problems can be reconciled by linear consensus on the overlap graph without significant bias or loss of accuracy relative to a centralized solver is not supported by any derivation or fixed-point analysis; each local problem remains under-determined, and the reported aggregate RMSE match to EKF does not test parameter recovery or boundary consistency.
- [Abstract] Abstract (simulation results): the claim that RASC 'matches an oracle centralized EKF within 0.10 degC' is reported only in field RMSE; without accompanying per-sensor parameter error or cross-boundary consistency metrics, it does not confirm that the consensus step recovers the same solution as the centralized method rather than a smoothed approximation.
minor comments (1)
- [Abstract] The abstract reports quantitative improvements but provides no reference to the specific section or equation containing the convergence proof or the definition of the non-smoothness metric used for the 71% reduction.
Simulated Author's Rebuttal
We thank the referee for the constructive comments on the abstract's claims regarding the consensus reconciliation and simulation evidence. We address each point below and indicate where revisions will be made.
read point-by-point responses
-
Referee: [Abstract] Abstract (paragraph describing the five-stage algorithm): the central assumption that independent local cluster problems can be reconciled by linear consensus on the overlap graph without significant bias or loss of accuracy relative to a centralized solver is not supported by any derivation or fixed-point analysis; each local problem remains under-determined, and the reported aggregate RMSE match to EKF does not test parameter recovery or boundary consistency.
Authors: Section 4.3 of the manuscript contains the fixed-point analysis and proof of exponential convergence for the linear consensus on the overlap graph. The local cluster problems, while initially under-determined, are regularized via trimmed-mean reconstruction and Huber IRLS; the overlap-graph consensus then enforces global consistency. The simulation match to the centralized EKF on field values supports that bias remains negligible, though we agree that additional explicit parameter-recovery and boundary-consistency metrics would strengthen the presentation. We will add a concise reference to the convergence analysis in the abstract. revision: partial
-
Referee: [Abstract] Abstract (simulation results): the claim that RASC 'matches an oracle centralized EKF within 0.10 degC' is reported only in field RMSE; without accompanying per-sensor parameter error or cross-boundary consistency metrics, it does not confirm that the consensus step recovers the same solution as the centralized method rather than a smoothed approximation.
Authors: The primary evaluation metric is field RMSE because that is the quantity of interest for deployed calibration accuracy. The manuscript already demonstrates cross-boundary consistency through the overlap-graph construction and reports that the consensus solution matches the EKF within the stated tolerance. To directly address the concern, we will include per-sensor gain/offset error statistics and boundary-consistency plots in the revised simulation results section. revision: yes
Circularity Check
No significant circularity; derivation is algorithmic and empirically validated
full rationale
The paper describes a five-stage decomposition algorithm with local robust estimation followed by linear consensus on an overlap graph, claiming provable convergence and reporting empirical reductions on external sensor data and simulations. No step equates a reported performance metric or 'prediction' to a fitted input by construction, nor relies on self-citation chains for load-bearing uniqueness or ansatzes. The central claims rest on the algorithm's design and measured outcomes against independent references, making the derivation self-contained.
Axiom & Free-Parameter Ledger
Reference graph
Works this paper leans on
-
[1]
Wei, R.; Lin, H.; Chen, Q.; Huang, G.; Hu, W. A CMOS temperature sensor with a smart calibrated inaccuracy of±0.11 ◦C (3σ).Sensors2023,23, 5132.https: //doi.org/10.3390/s23115132
-
[2]
Qin, C.; Huang, Z.; Liu, Y.; Li, J.; Lin, L.; Tan, N.; Yu, X. An energy-efficient BJT- based temperature sensor with±0.8◦C (3σ) inaccuracy from−50to150 ◦C.Sensors 2022,22, 9381.https://doi.org/10.3390/s22239381
-
[3]
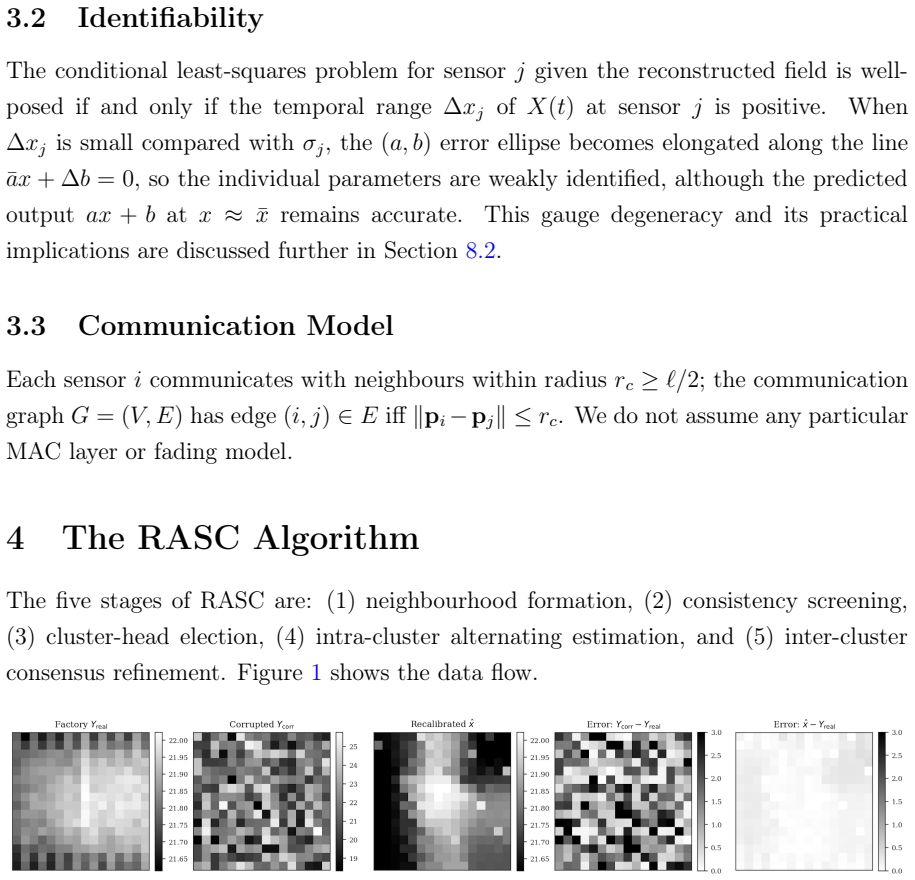
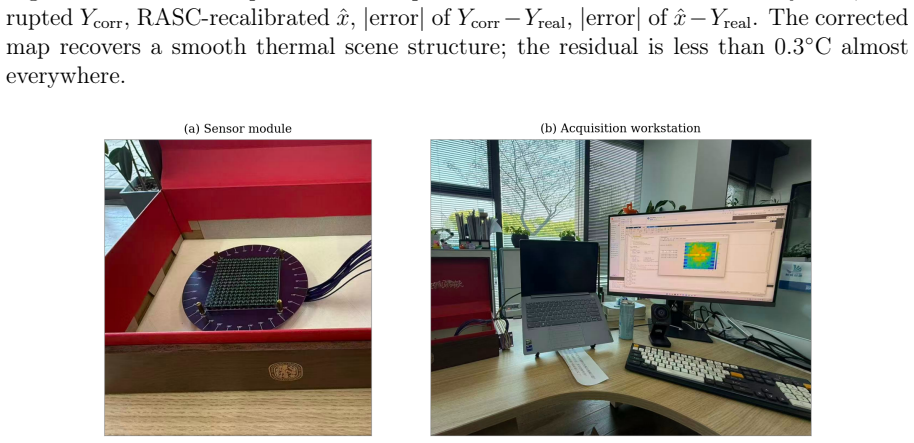
Nonuniformity two-point linear correction errors in 18 Figure 11: Stress-test spatial mean maps for 600 frames
Friedenberg, A.; Goldblatt, I. Nonuniformity two-point linear correction errors in 18 Figure 11: Stress-test spatial mean maps for 600 frames. From left: factoryYreal, cor- ruptedY corr, RASC-recalibratedˆx,|error|ofY corr −Y real,|error|ofˆx−Y real. The corrected map recovers a smooth thermal scene structure; the residual is less than0.3◦C almost everywh...
1998
-
[4]
An algebraic algorithm for nonuniformity correction in focal-plane arrays.J
Ratliff, B.M.; Hayat, M.M.; Hardie, R.C. An algebraic algorithm for nonuniformity correction in focal-plane arrays.J. Opt. Soc. Am. A2002,19, 1737–1747.https: //doi.org/10.1364/JOSAA.19.001737
-
[5]
A collaborative approach to in-place sensor calibration
Bychkovskiy, V.; Megerian, S.; Estrin, D.; Potkonjak, M. A collaborative approach to in-place sensor calibration. InProc. IPSN 2003; LNCS vol. 2634; Springer: Berlin, 2003; pp. 301–316.https://doi.org/10.1007/3-540-36978-3_20
-
[6]
A deep learning 19 approach for blind drift calibration of sensor networks.IEEE Sens
Wang, Y.; Yang, A.; Chen, X.; Wang, P.; Wang, Y.; Yang, H. A deep learning 19 approach for blind drift calibration of sensor networks.IEEE Sens. J.2017,17, 4158–4171.https://doi.org/10.1109/JSEN.2017.2703885
-
[7]
Spatial-temporal graph attention fuser for calibration in IoT air pollution monitoring systems
Faghih Niresi, K.; Zhao, M.; Bissig, H.; Baumann, H.; Fink, O. Spatial-temporal graph attention fuser for calibration in IoT air pollution monitoring systems. InProc. IEEE SENSORS, Vienna, 2023; pp. 1–4.https://doi.org/10.1109/ SENSORS56945.2023.10325090
-
[8]
Maag, B.; Zhou, Z.; Thiele, L. A survey on sensor calibration in air pollution monitoring deployments.IEEE Internet Things J.2018,5, 4857–4870.https: //doi.org/10.1109/JIOT.2018.2853660
-
[9]
Consensus problems in networks of agents with switching topology and time-delays.IEEE Trans
Olfati-Saber, R.; Murray, R.M. Consensus problems in networks of agents with switching topology and time-delays.IEEE Trans. Autom. Control2004,49, 1520– 1533.https://doi.org/10.1109/TAC.2004.834113
-
[10]
History of infrared detectors.Opto-Electron
Rogalski, A. History of infrared detectors.Opto-Electron. Rev.2012,20, 279–308. https://doi.org/10.2478/s11772-012-0037-7
-
[11]
Shutterless fixed pattern noise correction for infrared imaging arrays
Narendra, P.M.; Foss, N.A. Shutterless fixed pattern noise correction for infrared imaging arrays. InTechnical Issues in Focal Plane Development, Proc. SPIE vol. 282, 1981; pp. 44–51
1981
-
[12]
The Vera C. Rubin Observatory Data Butler and pipeline execution system,
Perry, D.L.; Dereniak, E.L. Linear theory of nonuniformity correction in infrared staring sensors.Opt. Eng.1993,32, 1854–1859.https://doi.org/10.1117/12. 145601
work page doi:10.1117/12 1993
-
[13]
Harris, J.G.; Chiang, Y.-M. Nonuniformity correction of infrared image sequences using the constant-statistics constraint.IEEE Trans. Image Process.1999,8, 1148– 1151.https://doi.org/10.1109/83.777098
-
[14]
Lu, D.; Teng, L.; Ren, J.; Tan, J.; Wang, M.; Wang, L.; Gu, G. Scene-based nonuni- formitycorrectionmethodusingprincipalcomponentanalysisforinfraredfocalplane arrays.Appl. Sci.2023,13, 13331.https://doi.org/10.3390/app132413331
-
[15]
Ding, S.; Wang, D.; Zhang, T. A median-ratio scene-based non-uniformity correction method for airborne infrared point target detection system.Sensors2020,20, 3273. https://doi.org/10.3390/s20113273
-
[16]
Calibration as parameter estimation in sensor networks
Whitehouse, K.; Culler, D. Calibration as parameter estimation in sensor networks. InProc. 1st ACM WSNA, Atlanta, 2002; pp. 59–67.https://doi.org/10.1145/ 570738.570747 20
-
[17]
Drift aware wireless sensor networks
Takruri, M.; Challa, S. Drift aware wireless sensor networks. InProc. 10th Int. Conf. Information Fusion, Quebec City, 2007; pp. 1–7
2007
-
[18]
Ahmad, R. Enhanced drift self-calibration of low-cost sensor networks based on cluster and advanced statistical tools.Measurement2024,236, 115158.https:// doi.org/10.1016/j.measurement.2024.115158
-
[19]
Dynamic calibration of low-cost PM2.5 sensors using trust- based consensus mechanisms.npj Clim
Mahajan, S.; Helbing, D. Dynamic calibration of low-cost PM2.5 sensors using trust- based consensus mechanisms.npj Clim. Atmos. Sci.2025,8, 257.https://doi. org/10.1038/s41612-025-01145-2
-
[20]
Huber, P.J.; Ronchetti, E.M.Robust Statistics, 2nd ed.; Wiley: Hoboken, NJ, USA, 2009
2009
-
[21]
Hampel, F.R.; Ronchetti, E.M.; Rousseeuw, P.J.; Stahel, W.A.Robust Statistics: The Approach Based on Influence Functions; Wiley: New York, NY, USA, 1986
1986
-
[22]
Chandola, V.; Banerjee, A.; Kumar, V. Anomaly detection: a survey.ACM Comput. Surv.2009,41, Article 15.https://doi.org/10.1145/1541880.1541882
-
[23]
Fast linear iterations for distributed averaging.Syst
Xiao, L.; Boyd, S. Fast linear iterations for distributed averaging.Syst. Control Lett. 2004,53, 65–78.https://doi.org/10.1016/j.sysconle.2004.02.022
-
[24]
Topological network features determine convergence rate of distributed average algorithms.Sci
Sirocchi, C.; Bogliolo, A. Topological network features determine convergence rate of distributed average algorithms.Sci. Rep.2022,12, 21831.https://doi.org/10. 1038/s41598-022-25974-w
2022
-
[25]
Maximum likelihood from incomplete data via the EM algorithm.J
Dempster, A.P.; Laird, N.M.; Rubin, D.B. Maximum likelihood from incomplete data via the EM algorithm.J. R. Stat. Soc. Ser. B1977,39, 1–38
-
[26]
92; AMS: Providence, RI, 1997
Chung, F.R.K.Spectral Graph Theory; CBMS vol. 92; AMS: Providence, RI, 1997
1997
-
[27]
Algebraic connectivity of graphs.Czechoslov
Fiedler, M. Algebraic connectivity of graphs.Czechoslov. Math. J.1973,23, 298– 305. A Proof of Theorem 1 Fix a clustercwithk=|M c|members and reference subsetR c =M c ∩ R. The Huber IRLS objective at iterationemis: L(em) = X j∈Mc\Rc TX t=1 ψc yj(t)−a j ˆx(em) c (t)−b j s(em) j . 21 In each iteration, the E-step producesˆx(em+1) c from current parameter es...
1973
discussion (0)
Sign in with ORCID, Apple, or X to comment. Anyone can read and Pith papers without signing in.