Small and Complex II: Characterizing the Disk and Stellar Envelope of Edge-on z sim 0 Massive Compact Galaxies
Pith reviewed 2026-06-29 23:53 UTC · model grok-4.3
The pith
Massive compact galaxies show smaller but proportionally scaled bulges, disks and envelopes, with surviving disks weakening dry minor merger models for envelope growth.
A machine-rendered reading of the paper's core claim, the machinery that carries it, and where it could break.
Core claim
MCGs host more compact bulges and envelopes as well as shorter and thicker disks than a mass-matched control sample of non-compact S0 galaxies; component sizes are coupled across the sample; median bulge-to-total and disk-to-total flux fractions are similar; MCGs and relic galaxies follow the same component size-mass relations.
What carries the argument
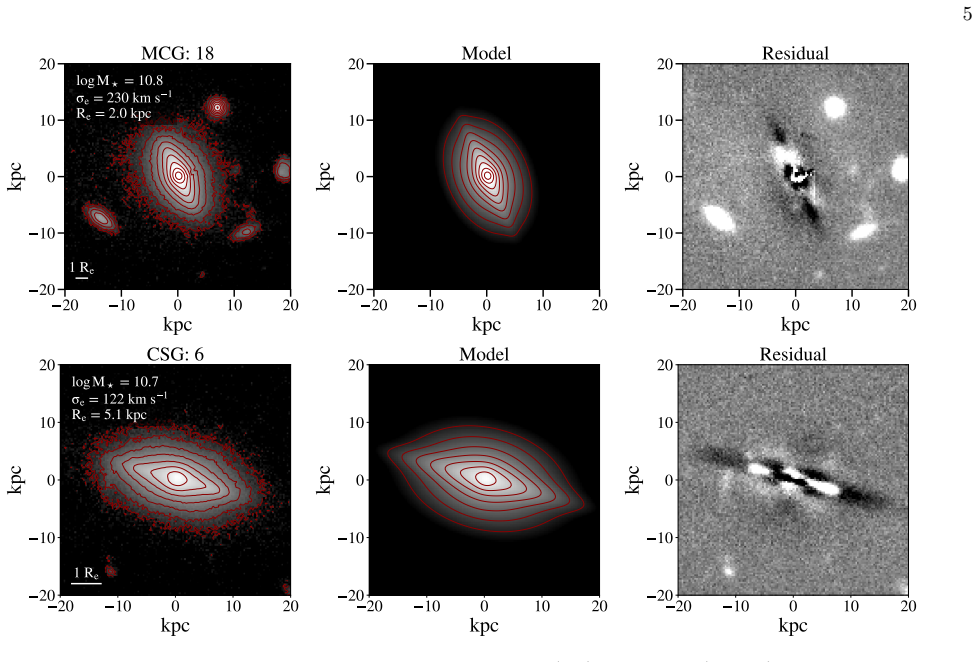
Three-component photometric decomposition of edge-on images that separates bulge, disk and stellar envelope and measures their effective radii, scale lengths, ellipticities and flux fractions.
If this is right
- Bulge, disk and envelope sizes are smaller in MCGs than in control galaxies but scale together.
- Substantial disk components survive in MCGs, with median D/T approximately 0.4.
- Envelope ellipticities range from 0 to 0.7, with MCG envelopes rounder on average.
- MCGs and relic galaxies occupy the same region in component size-mass space.
- Dry minor mergers are disfavored as the dominant envelope-building process.
Where Pith is reading between the lines
- If size coupling is physical, any envelope-growth channel must preserve inner-component scaling and disk structure.
- Kinematic or stellar-population data would be needed to decide whether intermediate-ellipticity envelopes are halos or thick disks.
- Extending the same decomposition to higher-redshift compact galaxies could test whether the structural family persists across cosmic time.
Load-bearing premise
The three-component photometric model can be fitted to edge-on galaxy images without large degeneracies or systematic biases that would alter the measured sizes, ellipticities or flux fractions.
What would settle it
Re-fitting the same images with altered model assumptions or additional components that removes the observed size coupling or drops the disk light fraction below 20 percent would falsify the central claim.
Figures
read the original abstract
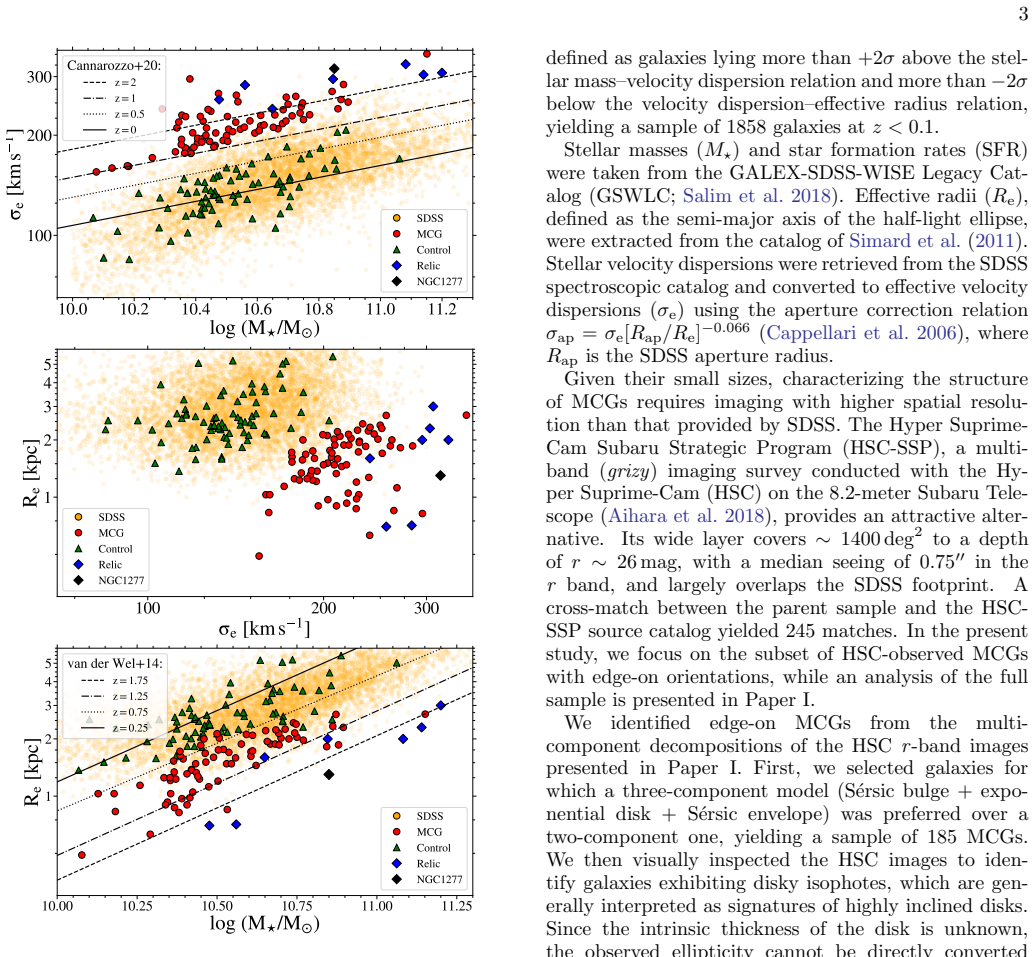
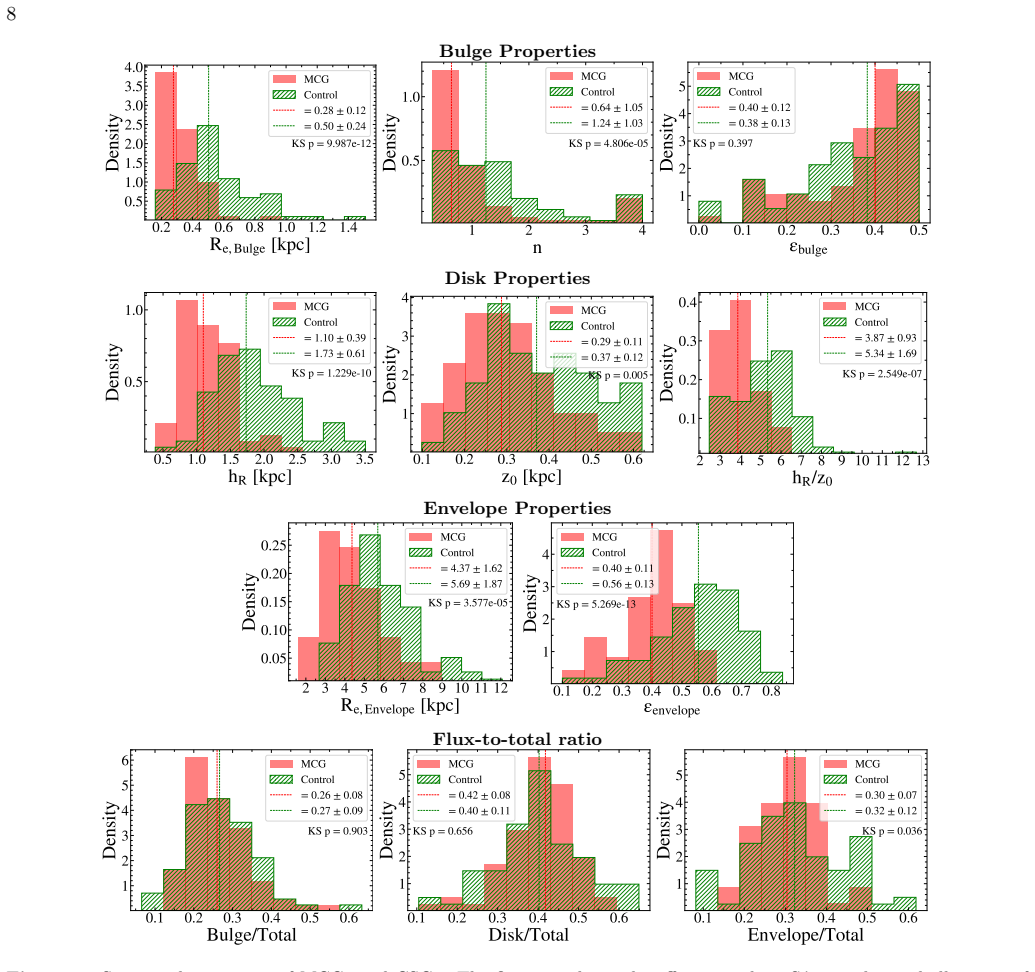
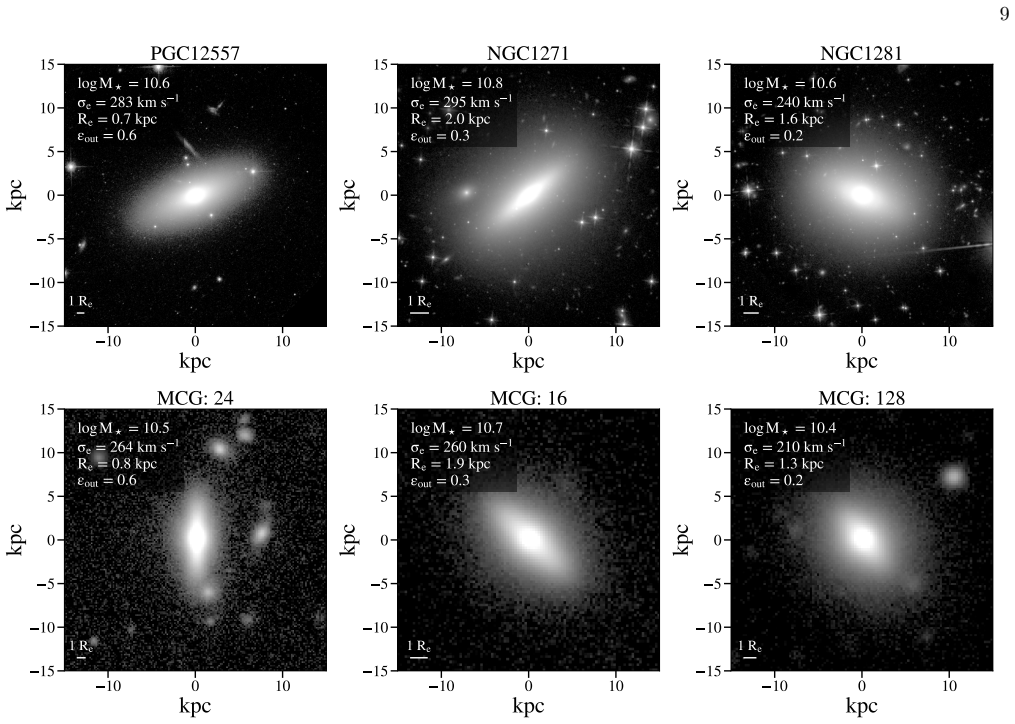
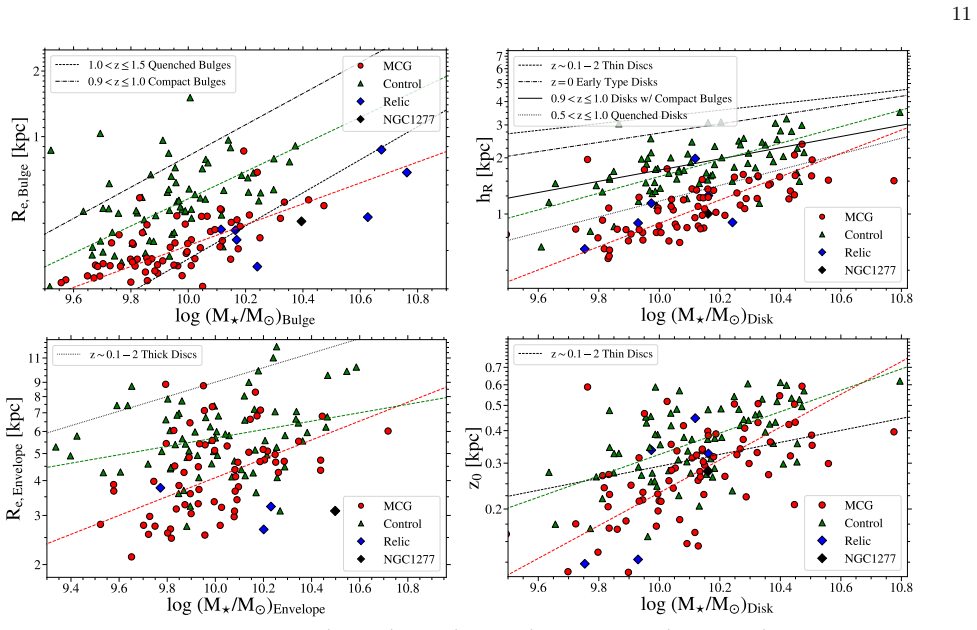
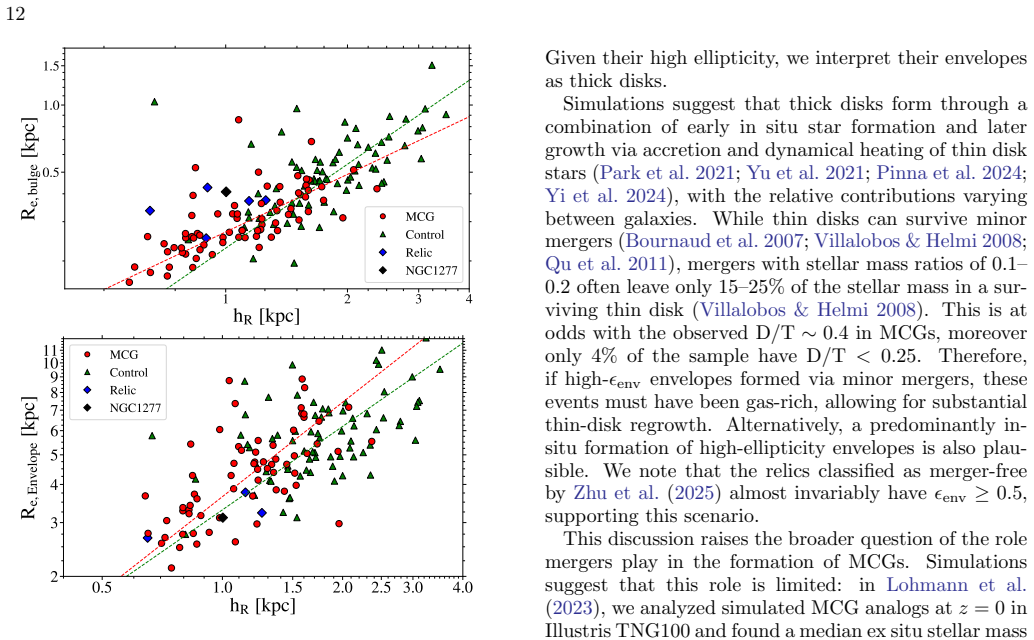
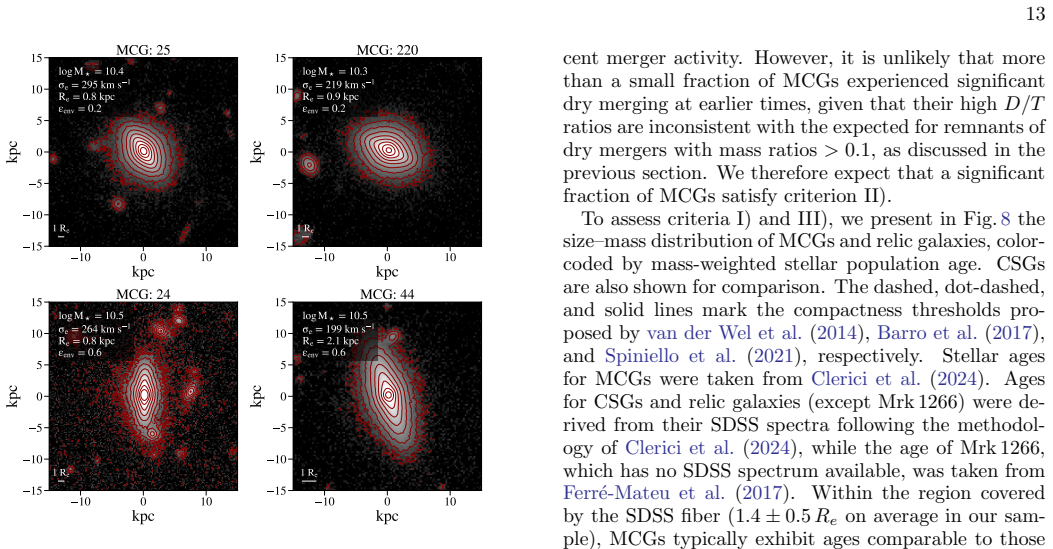
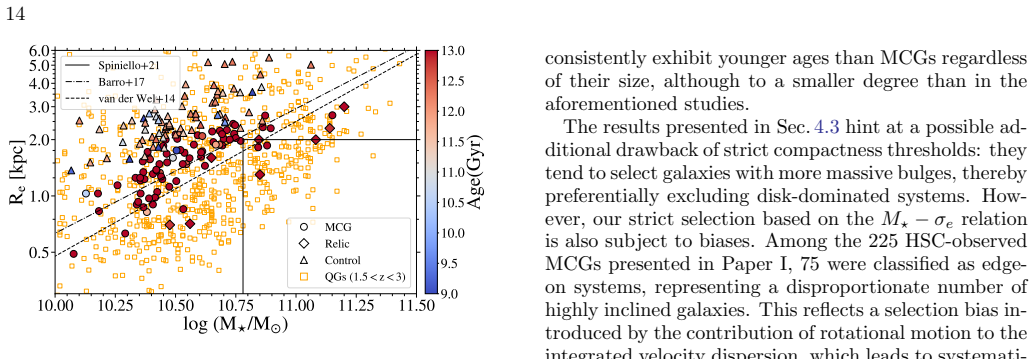
We present multi-component photometric decompositions of $r$-band Hyper Suprime-Cam images for a sample of 75 edge-on massive compact galaxies (MCGs) at $z < 0.1$, selected as $+2\sigma$ outliers in the stellar mass-velocity dispersion relation and $-2\sigma$ outliers in the velocity dispersion-size relation. MCGs are composed of compact bulges and disks embedded within stellar envelopes of unclear physical nature. Comparing MCGs to a mass- and redshift-matched control sample of non-compact edge-on S0 galaxies with a similar three-component structure, we find that the smaller sizes of MCGs are not driven by a single component. MCGs host more compact bulges and envelopes ($R_\mathrm{e,bulge} \sim 0.3$ versus $0.5$kpc; $R_\mathrm{e,env} \sim 4.4$ versus $5.7$kpc), as well as shorter and thicker disks ($h_R \sim 1.1$ versus $1.7$kpc; $h_R/z_0 \sim 3.9$ versus $5.3$). The sizes of the structural components are coupled, suggesting their formation processes are linked. Median bulge- and disk-to-total flux fractions are similar in both samples, with $B/T \sim 0.3$ and $D/T \sim 0.4$. Envelope ellipticities span $\epsilon_\mathrm{env} \sim 0$-$0.7$, with MCGs exhibiting rounder envelopes. Low- and high-ellipticity envelopes are broadly consistent with stellar halos and thick disks, respectively. However, the nature of intermediate ellipticity envelopes remains ambiguous from photometry alone. The coupling between component sizes, together with the survival of a substantial disk component, argues against dry minor mergers as the dominant envelope-building mechanism. A comparison with 8 relic galaxies reveals that MCGs and relics share similar bulge-disk-envelope structures and follow the same component size-mass relations, consistent with belonging to a common structural family.
Editorial analysis
A structured set of objections, weighed in public.
Referee Report
Summary. The paper reports three-component (bulge+disk+envelope) photometric decompositions of HSC r-band images for 75 edge-on massive compact galaxies (MCGs) at z<0.1. It finds that MCGs have systematically smaller bulges (R_e,bulge ~0.3 vs 0.5 kpc), shorter/thicker disks (h_R ~1.1 vs 1.7 kpc), and smaller envelopes (R_e,env ~4.4 vs 5.7 kpc) than a mass-matched control sample of edge-on S0s, with coupled component sizes, similar B/T~0.3 and D/T~0.4, rounder envelopes in MCGs, and structural similarity to 8 relic galaxies. The authors argue that size coupling plus disk survival disfavors dry minor mergers as the dominant envelope-building process.
Significance. If the decompositions hold, the work supplies direct observational evidence that structural components in MCGs are linked in size and that a substantial disk persists, thereby constraining envelope formation channels and placing MCGs and relics in a common structural family. The sample comparison and quantitative size-mass relations are strengths of the analysis.
major comments (3)
- [Methods (photometric decomposition)] Methods section on photometric decomposition: no mock-galaxy recovery tests, convergence diagnostics, or alternative modeling (e.g., two-component runs) are described to bound degeneracies between the exponential disk scale length h_R, envelope R_e,env, and their ellipticities in edge-on projections. All reported size differences, flux fractions, and the merger-mechanism inference rest on these parameters.
- [Results (size and ellipticity comparisons)] Results (component size and ellipticity comparisons): the median values (R_e,bulge 0.3 vs 0.5 kpc; h_R 1.1 vs 1.7 kpc; envelope ellipticities 0–0.7) and the claim of coupled sizes lack reported uncertainties or degeneracy bounds, so it is unclear whether the differences exceed possible systematic biases from the edge-on geometry.
- [Discussion] Discussion of merger mechanism: the argument that size coupling plus disk survival disfavors dry minor mergers inherits the same unquantified systematic risk as the underlying fits; an explicit test (e.g., how much bias would be needed to erase the reported differences) is absent.
minor comments (2)
- Notation for scale lengths (h_R, z_0) and effective radii should be defined once in the text and used consistently in all tables and figures.
- The relic-galaxy comparison sample size (N=8) is small; a brief statement on how selection effects were assessed would improve clarity.
Simulated Author's Rebuttal
We thank the referee for their constructive comments, which identify key areas where additional validation will strengthen the analysis of our photometric decompositions. We address each major comment below and will revise the manuscript accordingly.
read point-by-point responses
-
Referee: Methods section on photometric decomposition: no mock-galaxy recovery tests, convergence diagnostics, or alternative modeling (e.g., two-component runs) are described to bound degeneracies between the exponential disk scale length h_R, envelope R_e,env, and their ellipticities in edge-on projections. All reported size differences, flux fractions, and the merger-mechanism inference rest on these parameters.
Authors: We agree that the Methods section would benefit from explicit validation. In the revised manuscript, we will add mock-galaxy recovery tests tailored to edge-on projections, report convergence diagnostics from the fitting procedure, and include two-component model comparisons to quantify potential degeneracies between the disk and envelope parameters. revision: yes
-
Referee: Results (component size and ellipticity comparisons): the median values (R_e,bulge 0.3 vs 0.5 kpc; h_R 1.1 vs 1.7 kpc; envelope ellipticities 0–0.7) and the claim of coupled sizes lack reported uncertainties or degeneracy bounds, so it is unclear whether the differences exceed possible systematic biases from the edge-on geometry.
Authors: We will revise the Results section to include uncertainties on all median values and size comparisons, derived from bootstrap resampling and fit error propagation. We will also add a discussion of possible systematic biases from edge-on geometry and assess whether they could account for the observed differences and size coupling. revision: yes
-
Referee: Discussion of merger mechanism: the argument that size coupling plus disk survival disfavors dry minor mergers inherits the same unquantified systematic risk as the underlying fits; an explicit test (e.g., how much bias would be needed to erase the reported differences) is absent.
Authors: We will expand the Discussion to include an explicit sensitivity analysis quantifying the level of systematic bias in component sizes that would be required to erase the reported differences. This will directly test the robustness of the inference against dry minor mergers. revision: yes
Circularity Check
No circularity: empirical photometric measurements and sample comparisons
full rationale
The paper reports direct results from fitting three-component models to HSC images of edge-on galaxies and comparing the resulting sizes, ellipticities, and flux fractions to a control sample and to relics. No derivation, equation, or prediction is presented that reduces by construction to its own inputs; the central claims (size coupling, disk survival, disfavoring dry minor mergers) follow from the measured quantities themselves rather than from any self-referential step or self-citation chain. The work is therefore self-contained against external benchmarks.
Axiom & Free-Parameter Ledger
axioms (1)
- domain assumption Photometric decomposition into bulge, disk, and envelope components can be performed reliably on edge-on galaxy images without major degeneracies affecting size and ellipticity measurements.
Reference graph
Works this paper leans on
-
[1]
Abolfathi, B., Aguado, D. S., Aguilar, G., et al. 2018, ApJS, 235, 42, doi: 10.3847/1538-4365/aa9e8a Aguerri, J. A. L., Elias-Rosa, N., Corsini, E. M., & Mu˜ noz-Tu˜ n´ on, C. 2005, A&A, 434, 109, doi: 10.1051/0004-6361:20041743 Aihara, H., Armstrong, R., Bickerton, S., et al. 2018, PASJ, 70, S8, doi: 10.1093/pasj/psx081 Anderson, J. 2016, Empirical Model...
-
[2]
A., da Cunha, E., Kendrew, S., et al
http://www.jstatsoft.org/v42/i08/ Hodge, J. A., da Cunha, E., Kendrew, S., et al. 2025, ApJ, 978, 165, doi: 10.3847/1538-4357/ad9a52 Jiang, F., van Dokkum, P., Bezanson, R., & Franx, M. 2012, ApJL, 749, L10, doi: 10.1088/2041-8205/749/1/L10 Kurinchi-Vendhan, S., Farcy, M., Hirschmann, M., & Valentino, F. 2024, MNRAS, 534, 3974, doi: 10.1093/mnras/stae2297...
-
[3]
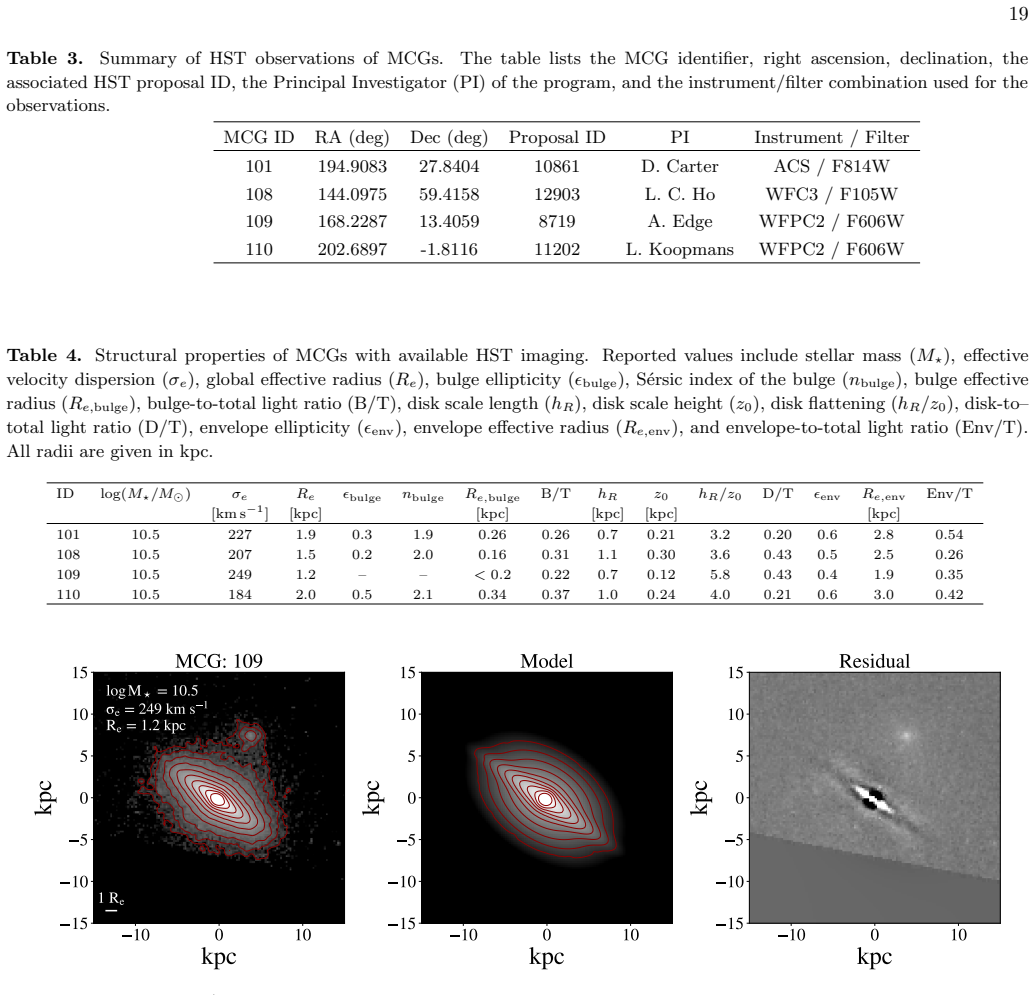
APPENDIX A.MCGS WITH HST IMAGING Of the 1858 SDSS MCGs in the Clerici et al
The bulge of this galaxy was fitted with a point source, which gives an upper limit of∼0.2 kpc forR e,bulge. APPENDIX A.MCGS WITH HST IMAGING Of the 1858 SDSS MCGs in the Clerici et al. (2024) sample, four have HST archival imaging available. In table 3 we list the Proposal ID, PI, instrument and filter of these observations. We performed multi-component ...
2024
discussion (0)
Sign in with ORCID, Apple, or X to comment. Anyone can read and Pith papers without signing in.