Aircraft and Fleet Sizing for Regional Air Mobility: College Town Case Studies
Pith reviewed 2026-06-29 21:00 UTC · model grok-4.3
The pith
Larger aircraft and fleets do not always improve profitability in regional air mobility for college towns.
A machine-rendered reading of the paper's core claim, the machinery that carries it, and where it could break.
Core claim
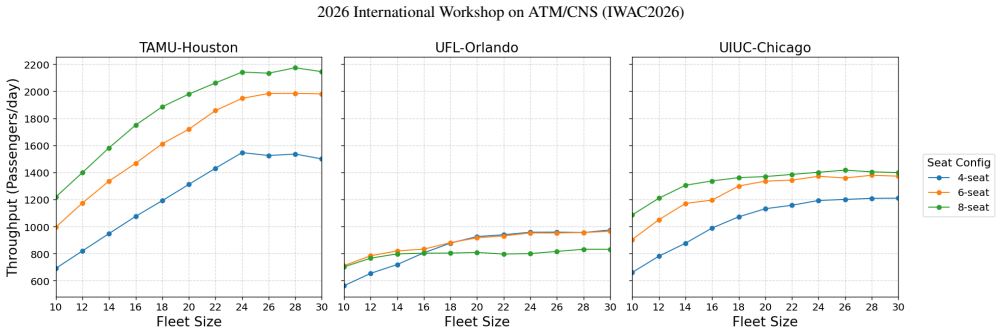
Using a joint supply-demand optimization framework that integrates a binary logit discrete choice model into a task assignment formulation, the study simultaneously determines market share, fare, and flight schedule for regional air mobility. Across three U.S. college town corridors and configurations from 4 to 8 seats with fleet sizes from 12 to 30, larger aircraft and fleets do not improve profitability universally. Larger aircraft are preferred only where economies of scale are favorable and demand is sufficient and directionally balanced. In these case studies the 4-seat configuration is best in imbalanced markets while the 6-seat configuration is best in balanced or dense markets.
What carries the argument
Joint supply-demand optimization framework that integrates a binary logit discrete choice model into a task assignment formulation to set market share, fare, and schedule together.
If this is right
- Larger aircraft improve profitability only when demand is sufficient and directionally balanced.
- The 4-seat configuration yields higher profits than larger options in imbalanced markets.
- The 6-seat configuration yields higher profits than other options in balanced or dense markets.
- Fleet size interacts with aircraft configuration so that simply adding aircraft does not raise profits across all markets.
Where Pith is reading between the lines
- Operators could first measure directional demand balance in a corridor before selecting aircraft size rather than assuming scale always pays.
- The same optimization structure could be tested on other short-haul markets with similar imbalance patterns to see whether the 4-seat preference generalizes.
- Adding time-varying factors such as weather or maintenance into the task assignment step might alter the preferred fleet sizes even in balanced markets.
Load-bearing premise
The binary logit discrete choice model accurately captures passengers' mode choice between regional air mobility and driving across the origin-destination pairs in the three corridors.
What would settle it
If observed ridership and mode shares from the three corridors diverge from the shares predicted by the binary logit model under the same fares and schedules, the profitability rankings by aircraft size would shift.
Figures
read the original abstract
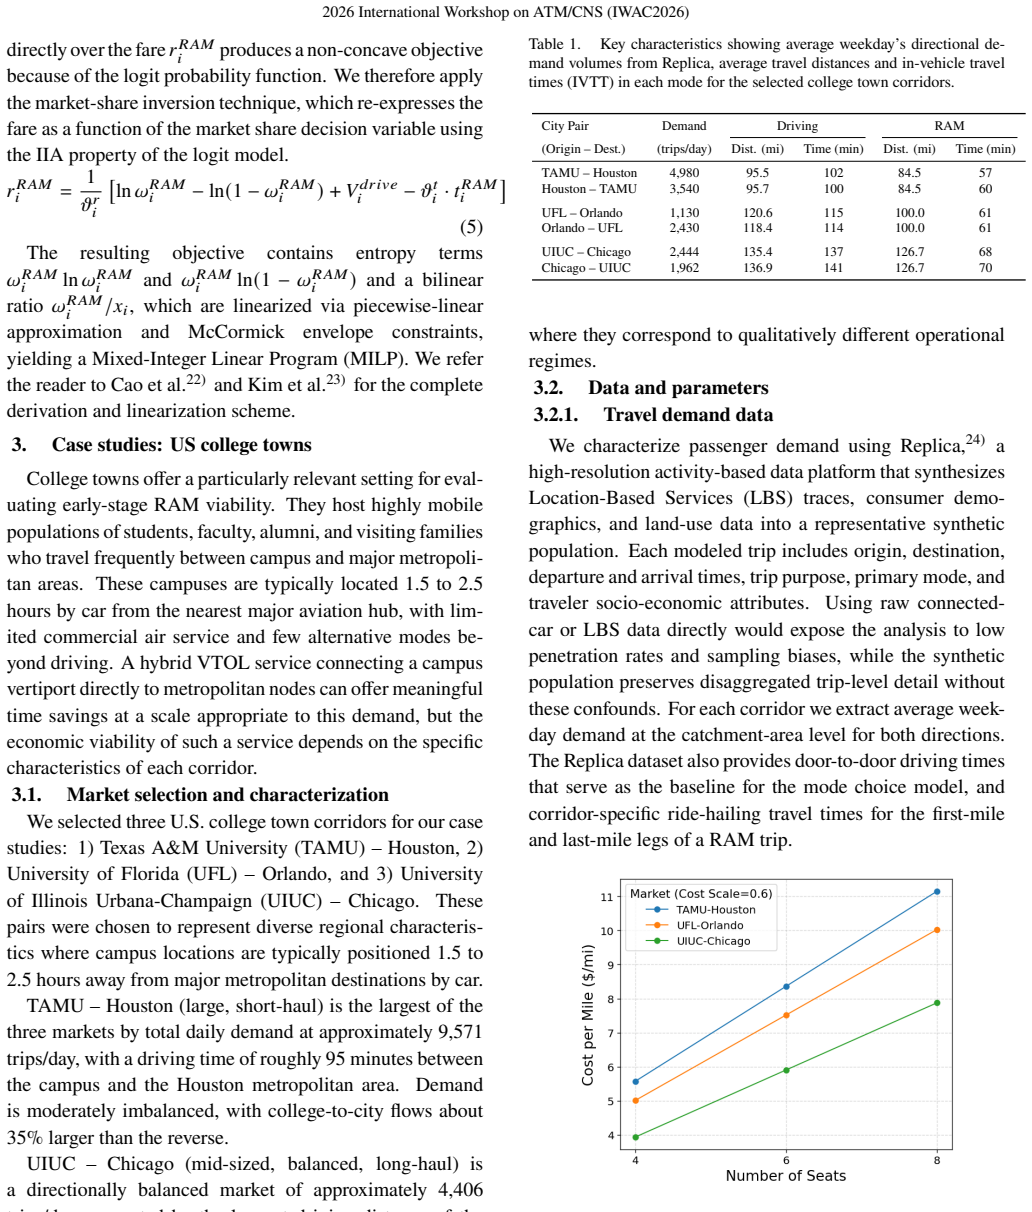
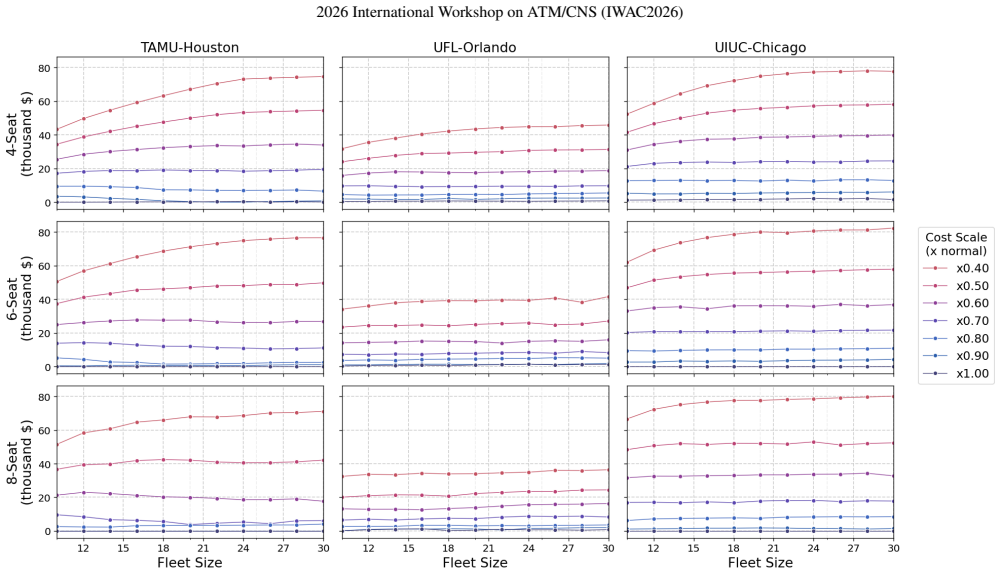
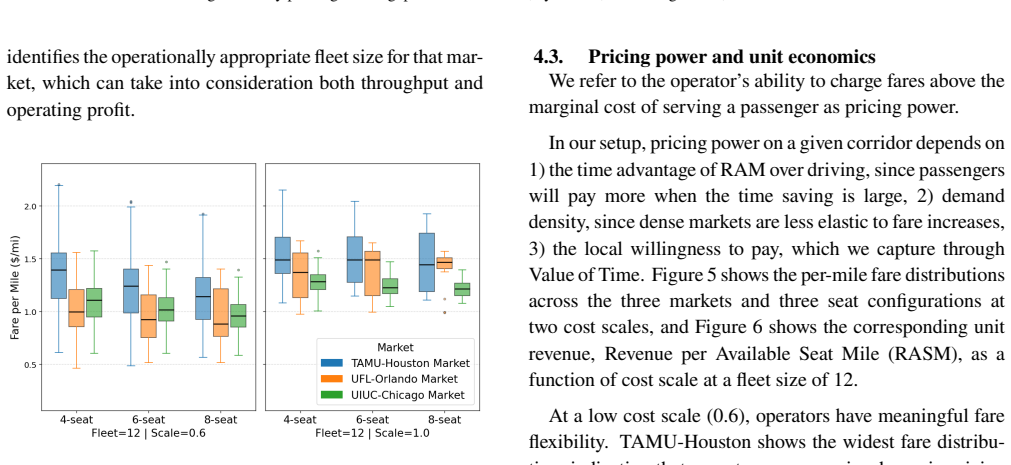
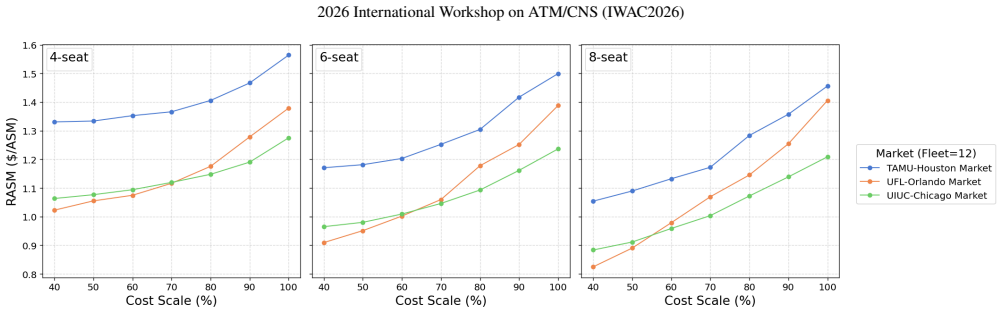
We examine how aircraft seat configuration interacts with daily operation in Regional Air Mobility by applying a joint supply-demand optimization framework that simultaneously determines market share, fare, and flight schedule. The framework integrates a binary logit discrete choice model into a task assignment formulation, capturing passengers' mode choice between Regional Air Mobility and driving across spatiotemporal origin-destination pairs. We evaluate three U.S. college town corridors under 4-, 6-, and 8-seat configurations across cost scales from 0.4 to 1.0 and fleet sizes from 12 to 30 aircraft. Profitability and throughput serve as primary performance metrics, and we analyze pricing power, operating cost, and revenue to explain performance variation across markets. We find that larger aircraft configurations and fleet sizes do not improve profitability universally. Larger aircraft are preferred where economies of scale are favorable and demand is sufficient and directionally balanced. The best configuration in these case studies is the 4-seat in imbalanced markets and the 6-seat in balanced or dense markets.
Editorial analysis
A structured set of objections, weighed in public.
Referee Report
Summary. The paper claims that a joint supply-demand optimization framework integrating a binary logit discrete choice model for mode choice between Regional Air Mobility and driving shows that larger aircraft seat configurations (6- or 8-seat) and fleet sizes (12-30) do not improve profitability universally across three U.S. college town corridors; instead, 4-seat aircraft are preferred in imbalanced markets while 6-seat are better in balanced or dense markets, with profitability and throughput evaluated over cost scales 0.4-1.0.
Significance. If the mode-choice model is valid for the corridors, the results provide context-specific guidance on aircraft and fleet sizing for Regional Air Mobility, emphasizing demand balance and economies of scale. The joint optimization approach that simultaneously solves for market share, fares, and schedules is a methodological contribution that could inform similar supply-demand problems in transportation systems.
major comments (2)
- [Model Formulation and Integration] The binary logit discrete choice model is described as integrated into the task assignment formulation to generate market shares across spatiotemporal OD pairs, yet the manuscript provides no parameter values, estimation procedure, data sources for the college-town corridors, or any goodness-of-fit/validation metrics. This assumption is load-bearing for the central claim because all reported profitability rankings, pricing power, and configuration preferences (4-seat vs. 6-seat) are downstream of the resulting choice probabilities.
- [Results and Discussion] The abstract and results sections state that profitability and throughput are evaluated across stated ranges of cost scales and fleet sizes, but supply no sensitivity analysis or error bounds on the logit-driven outputs; without this, it is unclear whether the reported preference ordering (4-seat in imbalanced markets, 6-seat in balanced/dense) is robust to plausible variation in value-of-time or unobserved heterogeneity parameters.
minor comments (2)
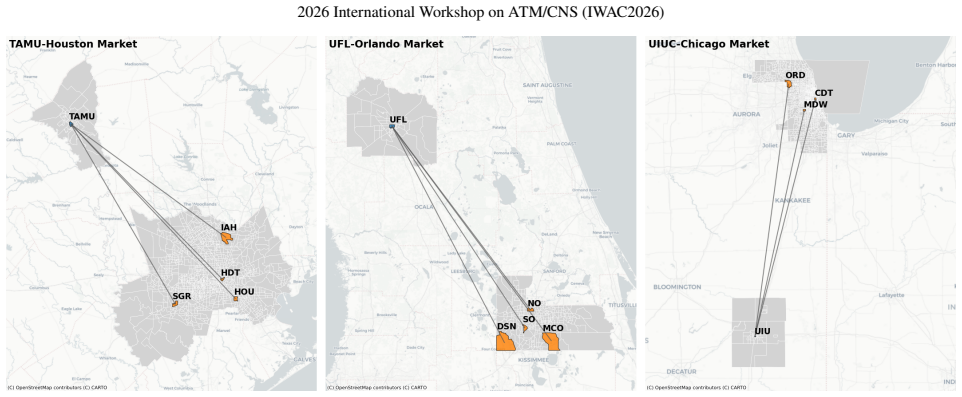
- [Introduction and Case Studies] The three corridors are referred to only generically in the abstract; naming them and providing basic demand statistics (e.g., daily OD volumes or directional balance metrics) in §2 or a table would improve reproducibility.
- [Methodology] Notation for the integrated optimization (e.g., decision variables for task assignment and logit utilities) should be defined in a single table or appendix to aid readers.
Simulated Author's Rebuttal
We thank the referee for the constructive comments, which highlight important aspects of model transparency and robustness. We address each major comment below and will revise the manuscript to incorporate the requested details and analyses.
read point-by-point responses
-
Referee: The binary logit discrete choice model is described as integrated into the task assignment formulation to generate market shares across spatiotemporal OD pairs, yet the manuscript provides no parameter values, estimation procedure, data sources for the college-town corridors, or any goodness-of-fit/validation metrics. This assumption is load-bearing for the central claim because all reported profitability rankings, pricing power, and configuration preferences (4-seat vs. 6-seat) are downstream of the resulting choice probabilities.
Authors: We agree that additional detail on the binary logit model is necessary for reproducibility and to substantiate the downstream results. In the revised manuscript, we will include the specific parameter values, describe the estimation procedure and data sources used for the college-town corridors, and report goodness-of-fit and validation metrics for the choice model. revision: yes
-
Referee: The abstract and results sections state that profitability and throughput are evaluated across stated ranges of cost scales and fleet sizes, but supply no sensitivity analysis or error bounds on the logit-driven outputs; without this, it is unclear whether the reported preference ordering (4-seat in imbalanced markets, 6-seat in balanced/dense) is robust to plausible variation in value-of-time or unobserved heterogeneity parameters.
Authors: We concur that sensitivity analysis is needed to assess robustness. The revised manuscript will add sensitivity analyses varying value-of-time and unobserved heterogeneity parameters, along with associated error bounds or confidence intervals on the logit outputs, to confirm the stability of the reported configuration preferences. revision: yes
Circularity Check
No significant circularity; results derive from explicit optimization under stated model assumptions.
full rationale
The paper applies a joint supply-demand optimization embedding a binary logit mode-choice model to compute market shares, fares, and schedules for varying aircraft sizes and fleet sizes, then reports profitability and throughput metrics. No quoted step shows a prediction or result that reduces by construction to its own inputs (e.g., no parameter fitted to a data subset then re-predicted as a related output, no self-definitional loop, no load-bearing self-citation chain, and no renaming of known results). The logit integration is presented as a modeling framework whose parameters and data sources are not detailed here, but this is a standard modeling assumption rather than a tautological reduction; outputs depend on inputs in the usual forward-computation sense. The derivation chain remains self-contained as a simulation study and does not meet any enumerated circularity pattern.
Axiom & Free-Parameter Ledger
free parameters (2)
- cost scales (0.4 to 1.0)
- fleet sizes (12 to 30)
axioms (1)
- domain assumption Binary logit model accurately represents mode choice between RAM and driving
Reference graph
Works this paper leans on
-
[1]
Antcliff, K., Borer, N., Sartorius, S., Saleh, P., Rose, R., Gariel, M., Oldham, J., Courtin, C., Bradley, M., Roy, S., Lynch, B., Guiang, A., Stith, P., Sun, D., Ying, S., and Patterson, M.:Regional Air Mobility: Leveraging Our National Investments to Energize the American Travel Experience, 2021
2021
-
[2]
A., Moore, K
Roy, S., Crossley, W. A., Moore, K. T., Gray, J. S., and Martins, J. R.:Next generation aircraft design considering airline operations and economics, 2018
2018
-
[3]
Rasmidatta, I.:Mode choice models for long distance travel in United States of America, The University of Texas at Arlington, 2006
2006
-
[4]
Moeckel, R., Fussell, R., and Donnelly, R.:Mode choice modeling for long-distance travel, Transportation Letters, Vol. 7, No. 1, 2015, pp. 35–46
2015
-
[5]
Cao, S., Jiang, X., Onat, E. B., Zou, B., Hansen, M., Sengupta, R., and Chakrabarty, A.:Fleet Size and Spill for UAM Operation under Uncertain Demand, 2024 (arXiv:2407.00947 [cs, eess])
-
[6]
T., Leonard, C., German, B
Roy, S., Kotwicz Herniczek, M. T., Leonard, C., German, B. J., and Garrow, L. A.:Flight Scheduling and Fleet Sizing for an Airport Shuttle Air Taxi Service, Journal of Air Transportation, Vol. 30, No. 2, 2022, pp. 49–58
2022
-
[7]
T., German, B
Kotwicz Herniczek, M. T., German, B. J., and Preis, L.:Fleet and Vertiport Sizing for an Urban Air Mobility Commuting Service, Trans- portation Research Record, Vol. 2678, No. 8, 2024, pp. 443–469
2024
-
[8]
Husemann, M., Kirste, A., and Stumpf, E.:Analysis of cost-efficient urban air mobility systems: Optimization of operational and config- urational fleet decisions, European Journal of Operational Research, Vol. 317, No. 3, 2024, pp. 678–695
2024
-
[9]
2673, No
Fu, M., Rothfeld, R., and Antoniou, C.:Exploring Preferences for Transportation Modes in an Urban Air Mobility Environment: Munich Case Study, Transportation Research Record, Vol. 2673, No. 10, 2019, pp. 427–442
2019
-
[10]
F., Balac, M., and Axhausen, K
Ilahi, A., Belgiawan, P. F., Balac, M., and Axhausen, K. W.:Under- standing travel and mode choice with emerging modes; a pooled SP and RP model in Greater Jakarta, Indonesia, Transportation Research Part A: Policy and Practice, Vol. 150, 2021, pp. 398–422
2021
-
[11]
A., German, B
Boddupalli, S.-S., Garrow, L. A., German, B. J., and Newman, J. P.: Mode choice modeling for an electric vertical takeoff and landing (eVTOL) air taxi commuting service, Transportation Research Part A: Policy and Practice, Vol. 181, 2024, pp. 104000
2024
-
[12]
150, 2024, pp
Coppola, P., De Fabiis, F., and Silvestri, F.:Urban Air Mobility (UAM): Airport shuttles or city-taxis?, Transport Policy, Vol. 150, 2024, pp. 24–34
2024
-
[13]
C., and Postorino, M
Brunelli, M., Ditta, C. C., and Postorino, M. N.:SP surveys to estimate Airport Shuttle demand in an Urban Air Mobility context, Transport Policy, Vol. 141, 2023, pp. 129–139
2023
-
[14]
and Park, Y.:Exploring economic feasibility for airport shuttle service of urban air mobility (UAM), Transportation Research Part A: Policy and Practice, Vol
Hae Choi, J. and Park, Y.:Exploring economic feasibility for airport shuttle service of urban air mobility (UAM), Transportation Research Part A: Policy and Practice, Vol. 162, 2022, pp. 267–281
2022
-
[15]
Y., Payan, A
Justin, C. Y., Payan, A. P., and Mavris, D.:Demand modeling and operations optimization for advanced regional air mobility, 2021
2021
-
[16]
Justin, C. Y. and Mavris, D. N.:Regional Air Mobility Market Study, 2022
2022
-
[17]
188, 2024, pp
Lv, D., Zhang, W., Wang, K., Hao, H., and Yang, Y.:Urban Aerial Mobility for airport shuttle service, Transportation Research Part A: Policy and Practice, Vol. 188, 2024, pp. 104202
2024
-
[18]
Jin, Z., Ng, K. K., Zhang, C., Wu, L., and Li, A.:Integrated optimisa- tion of strategic planning and service operations for urban air mobility systems, Transportation Research Part A: Policy and Practice, Vol. 183, 2024, pp. 104059
2024
-
[19]
and Stumpf, E.: Modeling and Analysis of Dynamic Pricing Potential for Urban Air Mobility Operations,AIAA AVIATION FORUM AND ASCEND 2024, 2024
Kirste, A. and Stumpf, E.: Modeling and Analysis of Dynamic Pricing Potential for Urban Air Mobility Operations,AIAA AVIATION FORUM AND ASCEND 2024, 2024
2024
-
[20]
11, 2009, pp
Dong, L., Kouvelis, P., and Tian, Z.:Dynamic Pricing and Inventory Control of Substitute Products, Manufacturing & Service Operations Management, Vol. 11, 2009, pp. 317–339
2009
-
[21]
and Huh, W.:Pricing Multiple Products with the Multinomial Logit and Nested Logit Models: Concavity and Implications, Manufac- turing & Service Operations Management, Vol
Li, H. and Huh, W.:Pricing Multiple Products with the Multinomial Logit and Nested Logit Models: Concavity and Implications, Manufac- turing & Service Operations Management, Vol. 13, 2011, pp. 549–563
2011
-
[22]
Cao, S., Park, J. H., Duarte, J., Kumar, R., Sengupta, R., and Hansen, M.:Joint Supply-Demand Control of Urban Air Mobility Operations with Variable Pricing: A Case Study of Airport Access Market at JFK, 2025 (SSRN preprint, available at https://ssrn.com/abstract=6521194)
2025
-
[23]
Kim, Y., Duan, N., Zardini, G., Samaranayake, S., and Wischik, D.: Strategic Pricing and Routing to Maximize Profit in Congested Roads Considering Interactions With Travelers, IEEE Transactions on Control of Network Systems, Vol. 12, No. 2, 2025, pp. 1638–1650
2025
-
[24]
Accessed via https://studio.replicahq.com/)
Replica:Seasonal Trip Tables, Replica Mobility Model, 2026 (Mod- eled, synthetic dataset. Accessed via https://studio.replicahq.com/)
2026
-
[25]
Onat, E., Bulusu, V., Chakrabarty, A., Hansen, M., Sengupta, R., and Sridhar, B.:Evaluating eVTOL Network Performance and Fleet Dynamics through Simulation-Based Analysis, 2024
2024
-
[26]
Yedavalli, P., Peng, X., Burak Onat, E., Sengupta, R., Waddell, P., and Bulusu, V.:Assessing the Value of Urban Air Mobility through Metropolitan-Scale Microsimulation: A Case Study of the San Fran- cisco Bay Area, AIAA Aviation 2021, 2021
2021
-
[27]
Rimjha, M., Hotle, S., Trani, A., Hinze, N., Smith, J., and Dollyhigh, S.:Urban Air Mobility: Airport Ground Access Demand Estimation, 2021
2021
-
[28]
U.S. Department of Transportation, Bureau of Transportation Statistics:Transportation Economic Trends: Household Spend- ing on Transportation,https://data.bts.gov/stories/s/ Transportation-Economic-Trends-Transportation-Spen/ bzt6-t8cd/, 2021 (Accessed: May 1, 2026)
2021
-
[29]
Parkopedia:Global Parking Index 2022, 2022. 8
2022
discussion (0)
Sign in with ORCID, Apple, or X to comment. Anyone can read and Pith papers without signing in.