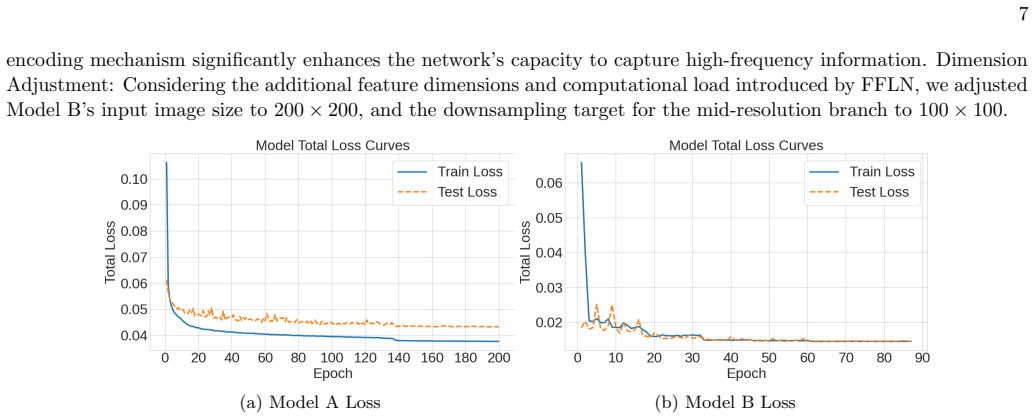
Machine Learning-based Separation of the He I 10830{AA} Chromospheric Signal: Quantitative Analysis of Chromosphere-Corona Intensity in the Quiet Sun
Pith reviewed 2026-06-29 20:49 UTC · model grok-4.3
The pith
Machine learning separates the He I 10830Å chromospheric signal from photospheric background to quantify its negative correlation with EUV intensities in the quiet Sun.
A machine-rendered reading of the paper's core claim, the machinery that carries it, and where it could break.
Core claim
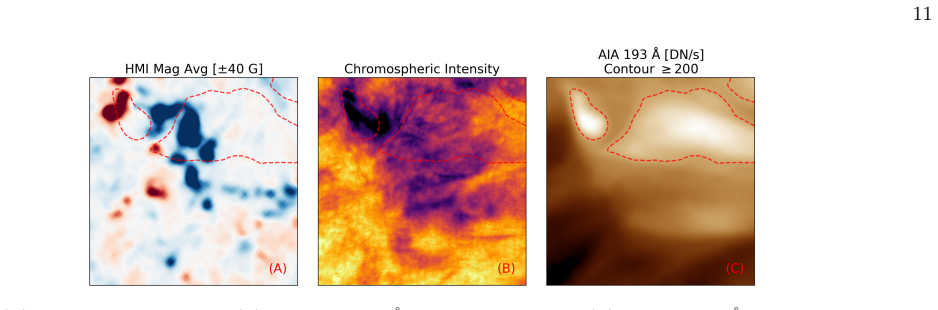
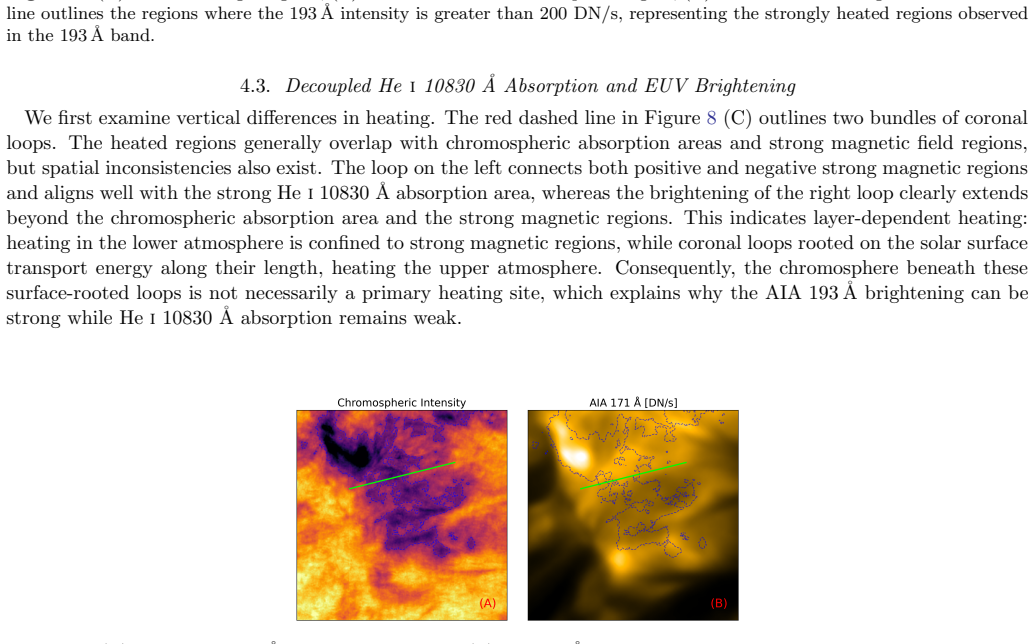
After CNN-based removal of the photospheric background, the quiet-Sun He I 10830Å chromospheric component shows a strong negative spatial correlation with EUV radiation (R approx -0.84 in 304Å) and significant layered coupling; strong absorption regions align with strong magnetic fields while 171Å enhancements extend to field edges and mixed-polarity zones, quantifying radiation-intensity relations and heating differences between unipolar and mixed-polarity fields.
What carries the argument
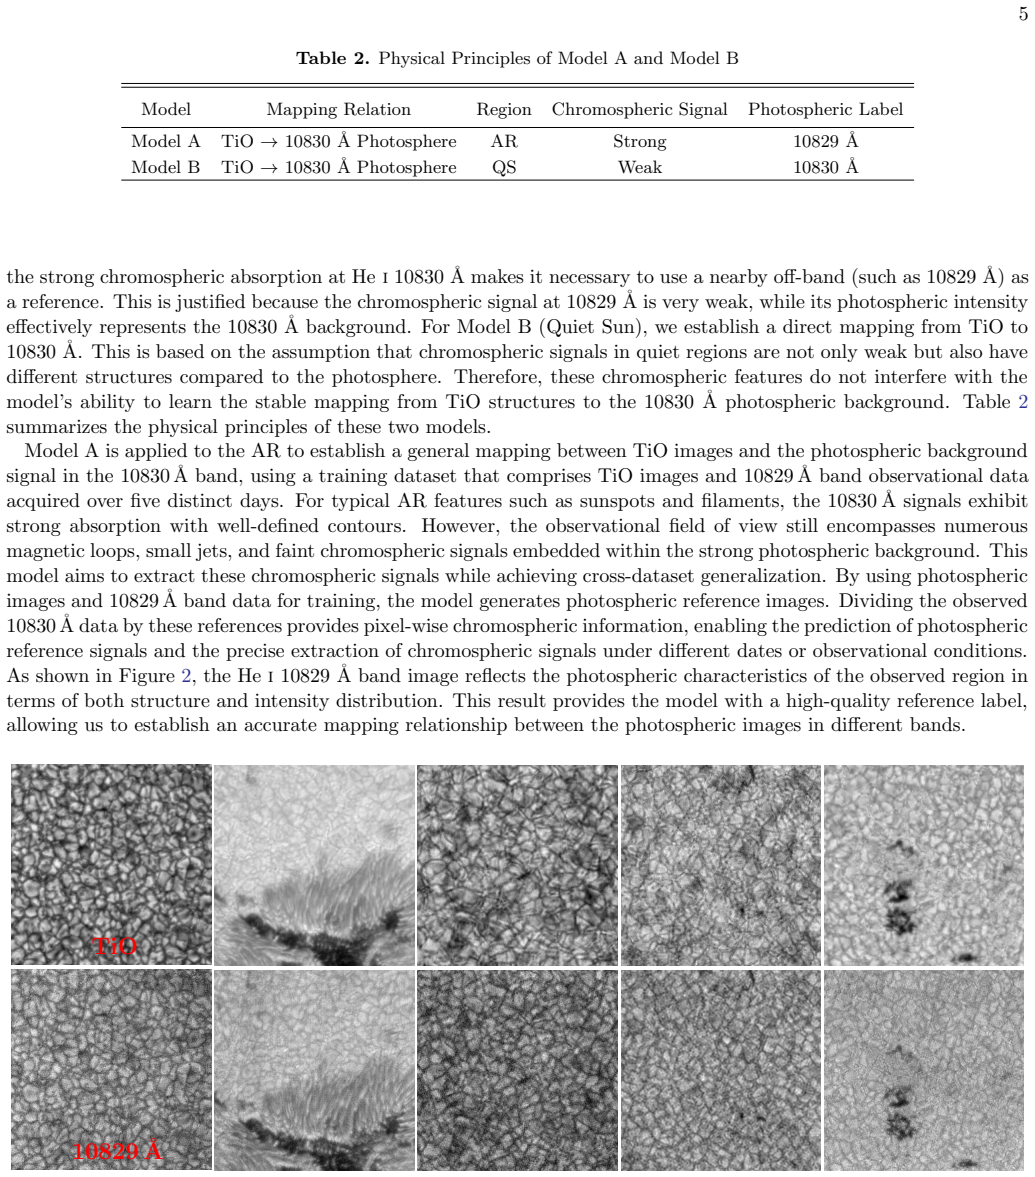
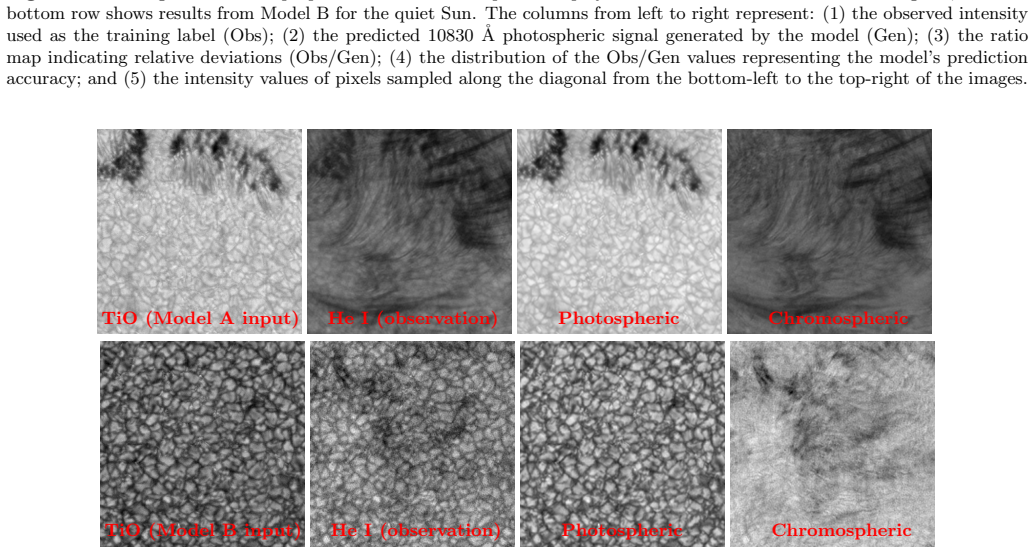
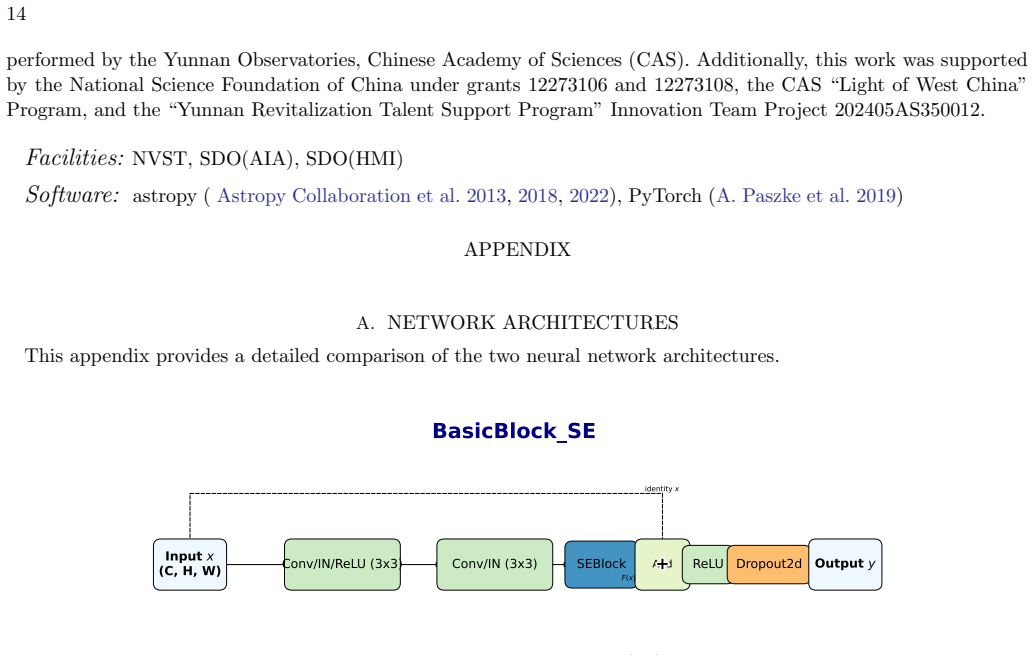
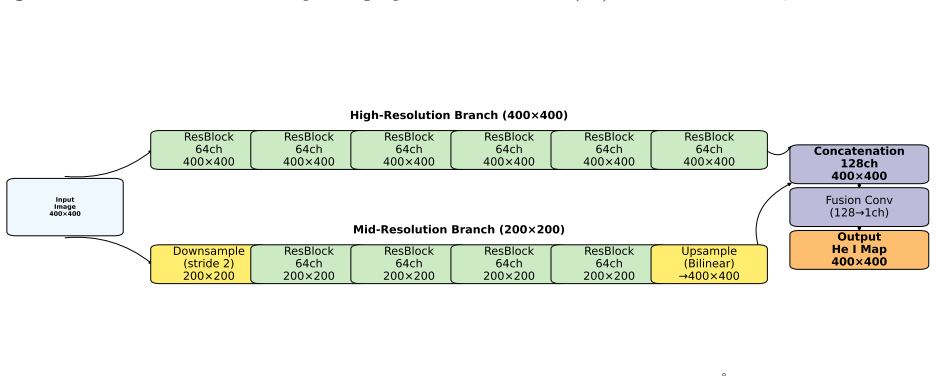
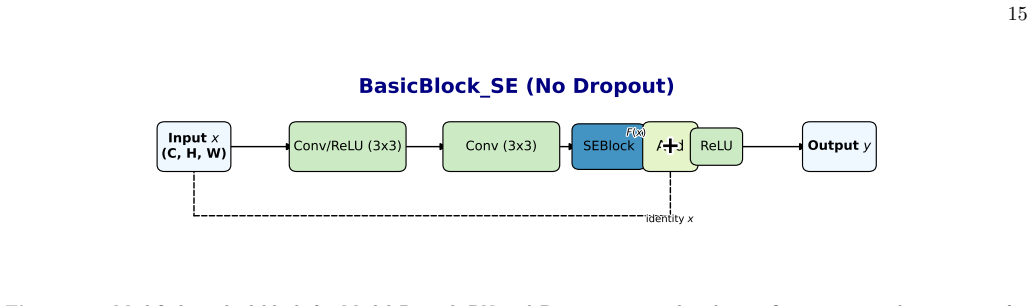
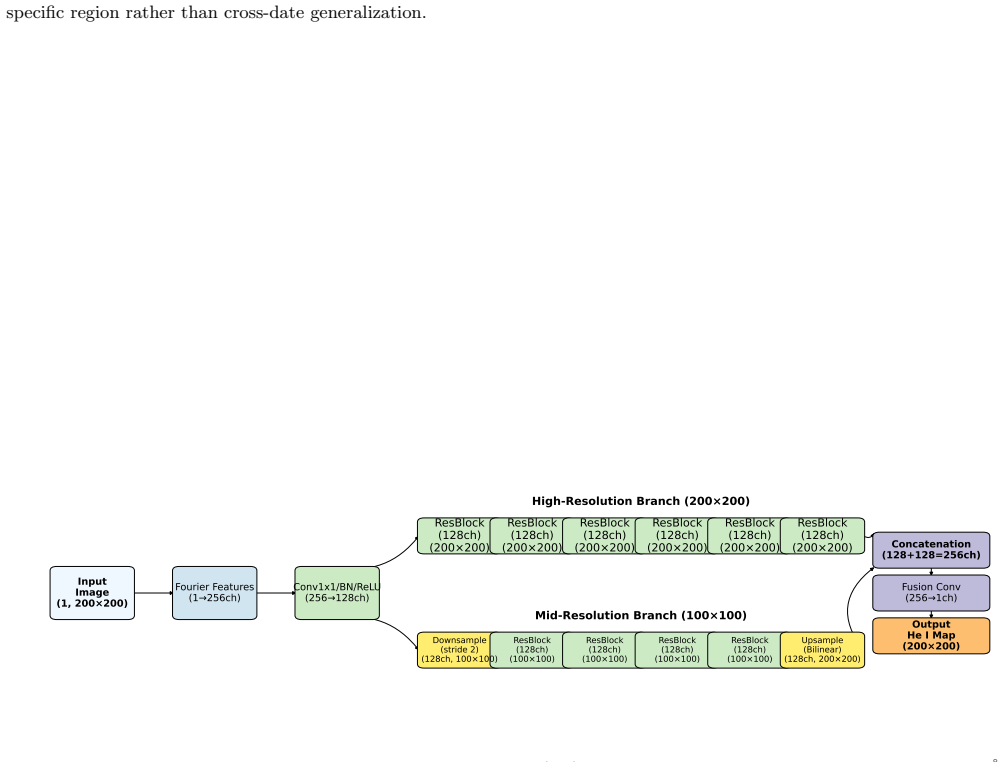
Two CNN models that infer the He I 10830Å photospheric background from TiO and cross-band inputs, followed by an exponential absorption model to isolate the pure chromospheric component.
If this is right
- The cleaned He I intensities can be used directly to measure chromosphere-corona intensity relationships in the quiet Sun.
- Strong He I 10830Å absorption areas coincide with strong magnetic fields.
- 171Å radiative enhancements reach the edges of strong magnetic fields and mixed-polarity regions.
- The quantified intensity relations distinguish heating characteristics between unipolar and mixed-polarity magnetic configurations.
Where Pith is reading between the lines
- The same separation technique could be tested on other optically thin lines that suffer photospheric contamination to check whether similar anticorrelation patterns appear.
- If the anticorrelation holds, models of coronal heating must account for suppression or modulation of EUV emission in regions of strong chromospheric absorption.
- The polarity-dependent differences suggest that future multi-height observations should separate unipolar and mixed-polarity patches when mapping energy transport.
Load-bearing premise
The CNN models recover the true photospheric background in quiet-Sun regions without introducing spatially correlated residuals that would bias the later correlation measurements with EUV bands.
What would settle it
Repeating the correlation analysis after subtracting the photospheric background with an independent, non-ML method and obtaining substantially weaker or positive correlations with the same EUV channels would falsify the reported layered-coupling result.
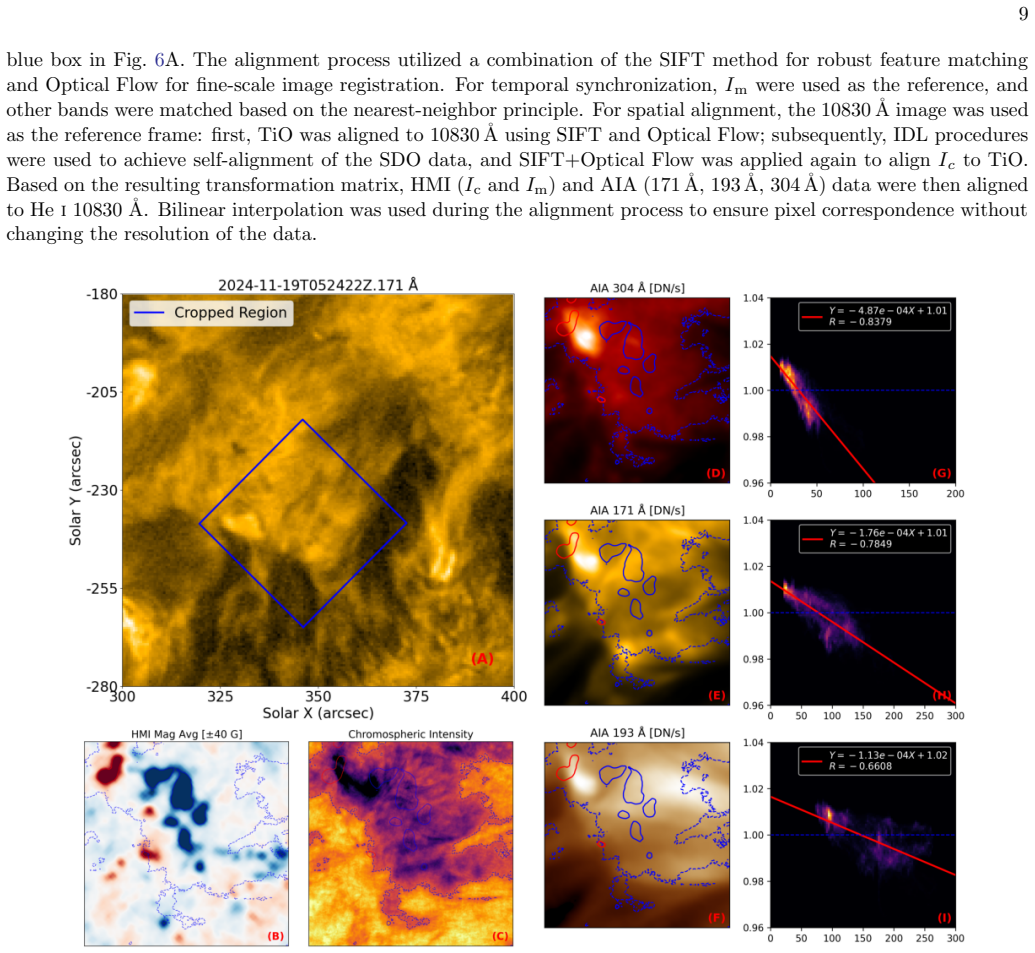
Figures
read the original abstract
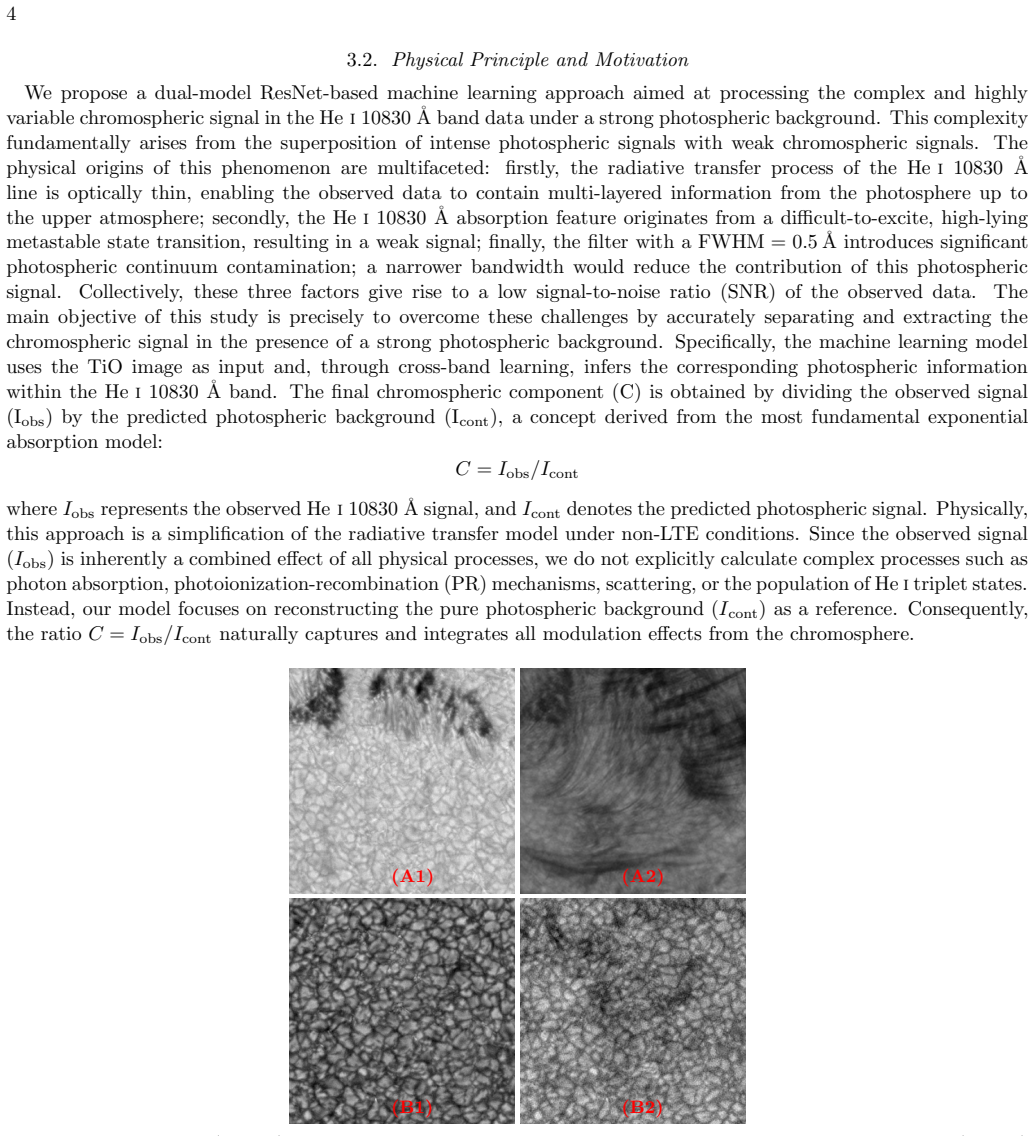
The He I 10830{\AA} line, a crucial optically thin chromospheric line, is frequently used to study coronal heating and vertical coupling across the chromosphere-corona interface. However, its images are severely contaminated by the strong photospheric background signal, hindering the analysis of fine chromospheric structures. Given the morphological differences between the Active Region (AR) and the Quiet Sun (QS), we proposed separating the He I 10830{\AA} chromospheric signal using two deep learning CNN models. Our model utilizes TiO images and cross-band learning to infer the He I 10830{\AA} photospheric background. The output is combined with an exponential absorption model to achieve quantitative analysis of the pure chromospheric component. Joint analysis of Solar Dynamics Observatory (SDO) data and the separated QS structures reveals a strong spatial negative correlation between chromospheric He I 10830{\AA} intensities(R approx -0.84 in 304{\AA} ), and significant layered coupling with EUV (171, 193, and 304{\AA}) radiation. Furthermore, strong He I 10830{\AA} absorption areas are highly correlated with regions of strong magnetic fields, while 171{\AA} radiative enhancement areas extend to the strong magnetic field edges and the mixed-polarity regions. These findings quantify the radiation intensity relationship between He I 10830{\AA} and EUV bands in the Quiet Sun. It also demonstrates the differences in heating characteristics between unipolar and mixed-polarity magnetic fields.
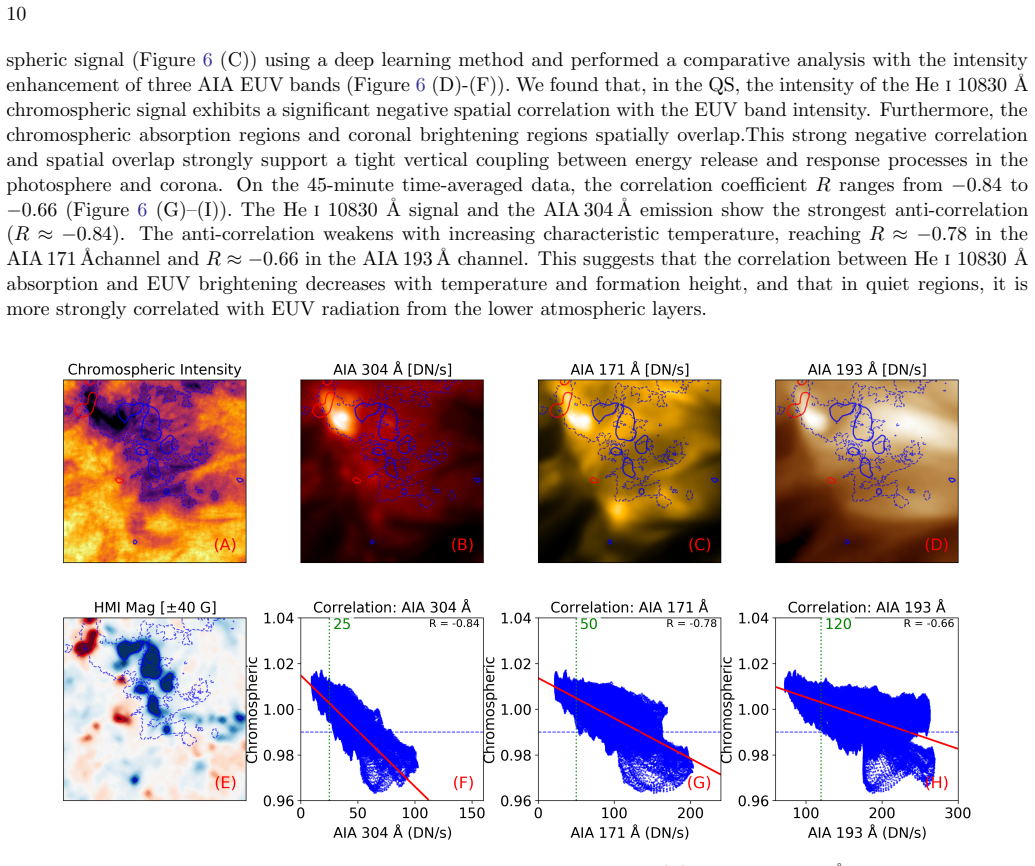
Editorial analysis
A structured set of objections, weighed in public.
Referee Report
Summary. The manuscript proposes two CNN models, trained on TiO images and cross-band inputs from SDO data, to separate the photospheric background from He I 10830Å observations in active regions and quiet Sun. An exponential absorption model is applied to the separated signal to enable quantitative analysis of the chromospheric component. The central claims are a strong negative spatial correlation (R ≈ −0.84) between the isolated quiet-Sun He I 10830Å intensities and 304Å EUV, plus layered coupling to 171Å/193Å bands, correlations with magnetic field strength, and differences in heating between unipolar and mixed-polarity regions.
Significance. If the CNN separation is shown to be free of spatially correlated residuals with respect to the EUV bands, the quantitative correlation results would supply useful observational constraints on chromosphere-corona coupling and differential heating in the quiet Sun. The work illustrates an ML route to multi-layer signal disentanglement but currently lacks the validation steps needed to support those constraints.
major comments (3)
- [Abstract] Abstract: the reported correlation R ≈ −0.84 is given without error bars, cross-validation statistics, or residual maps, preventing assessment of whether the central quantitative claim is supported by the data.
- [Abstract] Abstract: the parameters of the exponential absorption model are not stated, so it is impossible to judge the quantitative analysis of the pure chromospheric component or to reproduce the intensity relationships.
- [Separation procedure (CNN models)] Separation procedure (CNN models): no independent validation (synthetic data tests, radiative-transfer forward modeling, or residual–EUV cross-correlation statistics) is described to demonstrate that CNN-inferred photospheric residuals are spatially white with respect to the 171/193/304Å bands used in the correlation step; this assumption is load-bearing for the reported R value and layered-coupling results.
Simulated Author's Rebuttal
We thank the referee for the constructive feedback emphasizing validation and reproducibility. We address each major comment below and commit to revisions that strengthen the quantitative claims without overstating the current manuscript content.
read point-by-point responses
-
Referee: [Abstract] Abstract: the reported correlation R ≈ −0.84 is given without error bars, cross-validation statistics, or residual maps, preventing assessment of whether the central quantitative claim is supported by the data.
Authors: We agree that additional statistical support is needed. The revised manuscript will report the correlation with uncertainty estimates obtained via spatial bootstrapping over multiple quiet-Sun patches and will include cross-validation across independent observation dates. A supplementary figure will display residual maps together with their cross-correlation coefficients against the 304 Å, 171 Å and 193 Å bands. revision: yes
-
Referee: [Abstract] Abstract: the parameters of the exponential absorption model are not stated, so it is impossible to judge the quantitative analysis of the pure chromospheric component or to reproduce the intensity relationships.
Authors: The exponential absorption model and its fitted coefficients are given in Section 3.2, yet we accept that they should be summarized for immediate reference. The revision will state the key parameters (absorption coefficient and characteristic length) directly in the abstract and will add a compact table listing all model coefficients. revision: yes
-
Referee: [Separation procedure (CNN models)] Separation procedure (CNN models): no independent validation (synthetic data tests, radiative-transfer forward modeling, or residual–EUV cross-correlation statistics) is described to demonstrate that CNN-inferred photospheric residuals are spatially white with respect to the 171/193/304Å bands used in the correlation step; this assumption is load-bearing for the reported R value and layered-coupling results.
Authors: We acknowledge the absence of explicit residual–EUV cross-correlation tests in the submitted version. The revised manuscript will include these statistics, showing that the residuals lack significant spatial correlation with the EUV bands. While synthetic-data and full radiative-transfer forward-modeling validations were not performed (owing to the lack of suitable multi-layer training simulations), the added empirical residual analysis directly addresses the load-bearing assumption for the reported correlations. revision: partial
Circularity Check
No significant circularity detected
full rationale
The paper trains two CNN models on AR and QS data to infer the photospheric background component of He I 10830Å images from TiO and cross-band inputs, subtracts this background, and applies an exponential absorption model to isolate the chromospheric signal. The headline quantitative result (spatial correlation R ≈ −0.84 with 304 Å and layered coupling with 171/193 Å) is then computed directly as a statistical measure on the separated QS maps. No equation, definition, or step in the provided text reduces this measured correlation to the CNN training inputs, to a fitted parameter renamed as a prediction, or to a self-citation chain. The derivation remains self-contained; the correlation is an independent post-processing statistic on the output maps rather than a quantity forced by construction.
Axiom & Free-Parameter Ledger
free parameters (1)
- exponential absorption scale factor
axioms (1)
- domain assumption The photospheric background in He I 10830Å can be accurately predicted from TiO images via CNN cross-band learning without introducing spatially structured errors.
Reference graph
Works this paper leans on
-
[1]
S., & Jones, H
Andretta, V., Giampapa, M. S., & Jones, H. P. 1995, Irish Astronomical Journal, 22, 177
1995
-
[2]
Andretta, V., & Jones, H. P. 1997, ApJ, 489, 375, doi: 10.1086/304760 Astropy Collaboration, Robitaille, T. P., Tollerud, E. J., et al. 2013, A&A, 558, A33, doi: 10.1051/0004-6361/201322068 Astropy Collaboration, Price-Whelan, A. M., Sip˝ ocz, B. M., et al. 2018, AJ, 156, 123, doi: 10.3847/1538-3881/aabc4f Astropy Collaboration, Price-Whelan, A. M., Lim, ...
-
[3]
H., Fontenla, J
Avrett, E. H., Fontenla, J. M., & Loeser, R. 1994, in In: Infrared Solar Physics, Vol. 154, 35–47
1994
-
[4]
2008, ApJ, 677, 742, doi: 10.1086/528680
Collados, M. 2008, ApJ, 677, 742, doi: 10.1086/528680
-
[5]
Chitta, L. P., Peter, H., Solanki, S. K., et al. 2017, ApJS, 229, 4, doi: 10.3847/1538-4365/229/1/4 De Pontieu, B., Tarbell, T., & Erd´ elyi, R. 2003, ApJ, 590, 502, doi: 10.1086/374928
-
[6]
Goode, P. R., & Cao, W. 2013, SoPh, 287, 315, doi: 10.1007/s11207-013-0235-6
-
[7]
Handy, B. N., Acton, L. W., Kankelborg, C. C., et al. 1999, SoPh, 187, 229, doi: 10.1023/A:1005166902804
-
[8]
2021, RAA, 21, 105, doi: 10.1088/1674-4527/21/4/105
Hashim, P., Hong, Z.-X., Ji, H.-S., et al. 2021, RAA, 21, 105, doi: 10.1088/1674-4527/21/4/105
-
[9]
2024, ApJ, 964, 157, doi: 10.3847/1538-4357/ad2e9d
Hashim, P., Xu, F., Wang, Y., et al. 2024, ApJ, 964, 157, doi: 10.3847/1538-4357/ad2e9d
-
[10]
Deep residual learning for image recognition
He, K., Zhang, X., Ren, S., & Sun, J. 2016, in 2016 IEEE Conference on Computer Vision and Pattern Recognition (CVPR), 1, doi: 10.1109/CVPR.2016.90
-
[11]
2022, ApJ, 928, 153, doi: 10.3847/1538-4357/ac590c
Hong, Z., Wang, Y., & Ji, H. 2022, ApJ, 928, 153, doi: 10.3847/1538-4357/ac590c
-
[12]
2017, RAA, 17, 25, doi: 10.1088/1674-4527/17/3/25
Hong, Z.-X., Yang, X., Wang, Y., et al. 2017, RAA, 17, 25, doi: 10.1088/1674-4527/17/3/25
-
[13]
Ji, H., Cao, W., & Goode, P. R. 2012, ApJL, 750, L25, doi: 10.1088/2041-8205/750/1/L25
-
[14]
Neupert, W. M. 1993, ApJ, 406, 346, doi: 10.1086/172444
-
[15]
2025, A&A, 696, A3, doi: 10.1051/0004-6361/202453355
Leenaarts, J., van Noort, M., de la Cruz Rodr´ ıguez, J., et al. 2025, A&A, 696, A3, doi: 10.1051/0004-6361/202453355
-
[16]
The Atmospheric Imaging Assembly (AIA) on the Solar Dynamics Observatory (SDO).Sol
Lemen, J. R., Title, A. M., Akin, D. J., et al. 2012, SoPh, 275, 17, doi: 10.1007/s11207-011-9776-8
-
[17]
2016, ApJ, 826, 217, doi: 10.3847/0004-637X/826/2/217
Li, Z., Fang, C., Guo, Y., et al. 2016, ApJ, 826, 217, doi: 10.3847/0004-637X/826/2/217
-
[18]
Libbrecht, T., Bjørgen, J. P., Leenaarts, J., et al. 2021, A&A, 652, A146, doi: 10.1051/0004-6361/202039788
-
[19]
Leenaarts, J., & Ramos, A. A. 2017, A&A, 598, A33, doi: 10.1051/0004-6361/201629266
-
[20]
2022, Research in Astronomy and Astrophysics, 22, 095005, doi: 10.1088/1674-4527/ac7cba
Liu, H., Jin, Z., Xiang, Y., & Ji, K. 2022, Research in Astronomy and Astrophysics, 22, 095005, doi: 10.1088/1674-4527/ac7cba
-
[21]
2014, RAA, 14, 705, doi: 10.1088/1674-4527/14/6/009
Liu, Z., Xu, J., Gu, B.-Z., et al. 2014, RAA, 14, 705, doi: 10.1088/1674-4527/14/6/009
-
[22]
Lowe, D. G. 1999, in Proceedings of the Seventh IEEE International Conference on Computer Vision (ICCV), 1150–1157, doi: 10.1109/ICCV.1999.790410
-
[23]
Lowe, D. G. 2004, International Journal of Computer Vision, 60, 91, doi: 10.1023/B:VISI.0000029664.99615.94
-
[24]
2024, RAA, 24, 055008, doi: 10.1088/1674-4527/ad37f4
Meng, W.-J., Xu, F.-Y., & Jin, Z.-Y. 2024, RAA, 24, 055008, doi: 10.1088/1674-4527/ad37f4
-
[25]
Parker, E. N. 1988, ApJ, 330, 474, doi: 10.1086/166485
-
[26]
PyTorch: An Imperative Style, High-Performance Deep Learning Library
Paszke, A., Gross, S., Massa, F., et al. 2019, arXiv e-prints, arXiv:1912.01703, doi: 10.48550/arXiv.1912.01703
work page internal anchor Pith review Pith/arXiv arXiv doi:10.48550/arxiv.1912.01703 2019
-
[27]
Pesnell, W. D., Thompson, B. J., & Chamberlin, P. C. 2012, SoPh, 275, 3, doi: 10.1007/s11207-011-9841-3
-
[28]
Scharmer, G. B., Bjelksjo, K., Korhonen, T. K., Lindberg, B., & Petterson, B. 2003, in Society of Photo-Optical Instrumentation Engineers (SPIE) Conference Series, Vol. 4853, Innovative Telescopes and Instrumentation for Solar Astrophysics, ed. S. L. Keil & S. V. Avakyan, 341–350, doi: 10.1117/12.460377
-
[29]
Schou, J., Scherrer, P. H., Bush, R. I., et al. 2012, SoPh, 275, 229, doi: 10.1007/s11207-011-9842-2
-
[30]
Tancik, M., Srinivasan, P. P., Mildenhall, B., et al. 2020, arXiv e-prints, arXiv:2006.10739, doi: 10.48550/arXiv.2006.10739
-
[31]
Tripathi, D., Mason, H. E., Del Zanna, G., & Young, P. R. 2010, A&A, 518, A42, doi: 10.1051/0004-6361/200913883 Trujillo Bueno, J., ˇStˇ ep´ an, J., & Belluzzi, L. 2012, ApJL, 746, L9, doi: 10.1088/2041-8205/746/1/L9
-
[32]
Vernazza, J. E., Avrett, E. H., & Loeser, R. 1981, ApJS, 45, 635, doi: 10.1086/190731
-
[33]
2025, ApJ, 982, 161, doi: 10.3847/1538-4357/adbaec
Wang, Y., Ji, K., Jin, Z., & Liu, H. 2025, ApJ, 982, 161, doi: 10.3847/1538-4357/adbaec
-
[34]
2023, A&A, 672, A173, doi: 10.1051/0004-6361/202244607
Wang, Y., Zhang, Q., Hong, Z., et al. 2023, A&A, 672, A173, doi: 10.1051/0004-6361/202244607
-
[35]
2021, ApJ, 913, 59, doi: 10.3847/1538-4357/abf2b9
Wang, Y., Zhang, Q., & Ji, H. 2021, ApJ, 913, 59, doi: 10.3847/1538-4357/abf2b9
-
[36]
2016, ApJL, 820, L13, doi: 10.3847/2041-8205/820/1/L13
Wang, Y.-M. 2016, ApJL, 820, L13, doi: 10.3847/2041-8205/820/1/L13
-
[37]
Wiese, W. L., & Fuhr, J. R. 2009, Journal of Physical and Chemical Reference Data, 38, 565, doi: 10.1063/1.3077727
-
[38]
Xu, Y., Yang, X., Kerr, G. S., et al. 2022, ApJL, 924, L18, doi: 10.3847/2041-8213/ac447c 17
-
[39]
2016, PhD thesis, New Jersey Institute of Technology
Zeng, Z. 2016, PhD thesis, New Jersey Institute of Technology
2016
-
[40]
2013, ApJL, 769, L33, doi: 10.1088/2041-8205/769/2/L33
Zeng, Z., Cao, W., & Ji, H. 2013, ApJL, 769, L33, doi: 10.1088/2041-8205/769/2/L33
-
[41]
Zeng, Z., Chen, B., Ji, H., Goode, P. R., & Cao, W. 2016, ApJL, 819, L3, doi: 10.3847/2041-8205/819/1/L3
discussion (0)
Sign in with ORCID, Apple, or X to comment. Anyone can read and Pith papers without signing in.