The transitional Type Ibn/IIn SN 2022pda, with pre-explosion outbursts and a double-peaked light curve
Pith reviewed 2026-06-29 20:48 UTC · model grok-4.3
The pith
SN 2022pda is powered by circumstellar interaction from two pre-explosion mass ejection events and represents a transitional supernova between types IIn and Ibn.
A machine-rendered reading of the paper's core claim, the machinery that carries it, and where it could break.
Core claim
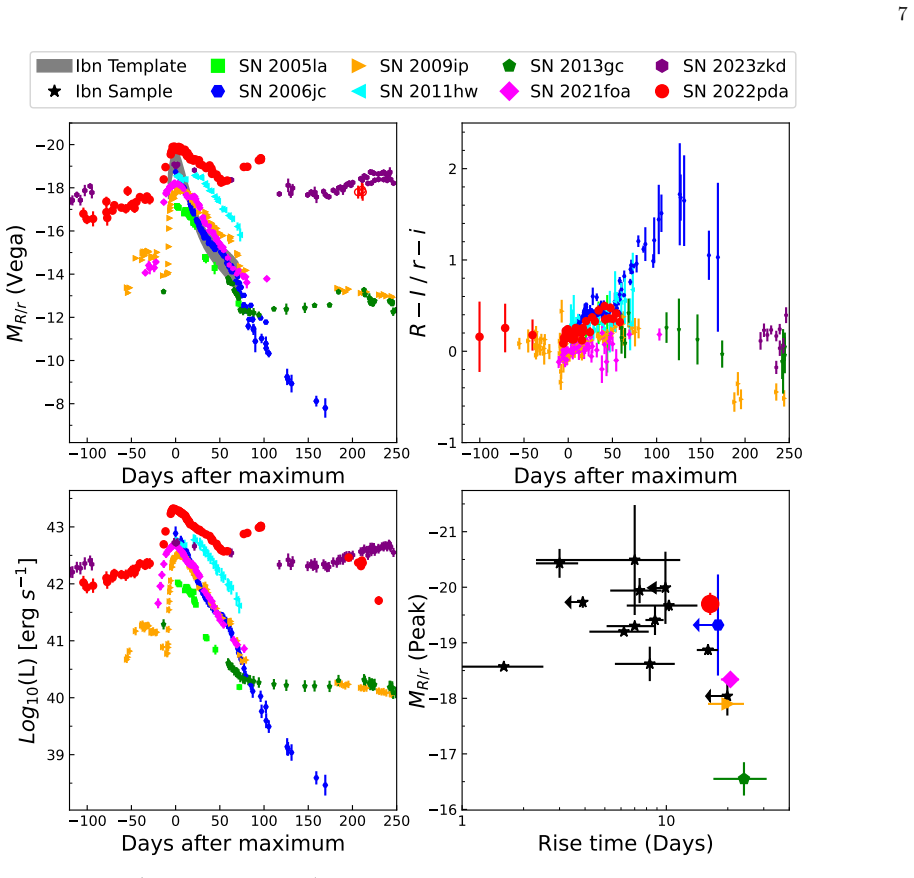
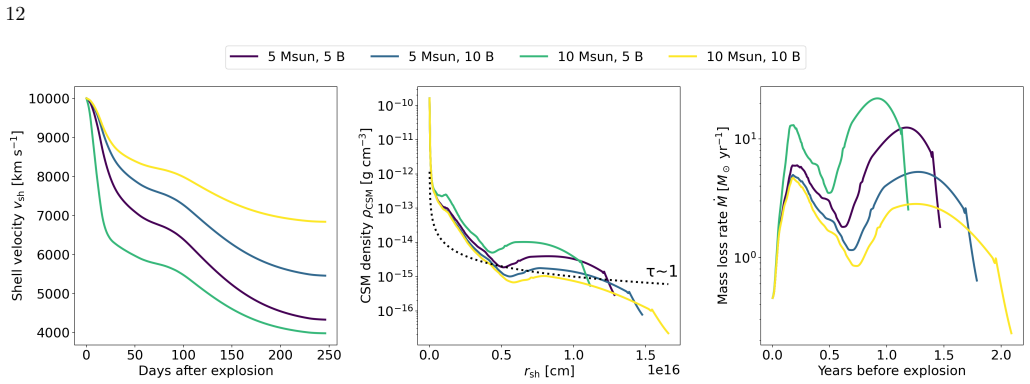
Shock-driven model fits to the bolometric light curve suggest that the SN is powered by interaction with a massive CSM with enhanced mass loss rates ∼5 M⊙ yr−1, expelled during two events occurred ∼1 and ∼0.2 years before the explosion. The overall SN evolution indicates that SN 2022pda is a transitional event between a H-rich SN IIn (SN 2009ip-like) and a He-rich SN Ibn. Our findings suggest that the progenitor was likely a Luminous Blue Variable transitioning towards a Wolf--Rayet stage.
What carries the argument
Shock interaction with circumstellar material (CSM) ejected in two discrete pre-explosion events, used to model the bolometric light curve and explain the double-peaked shape.
If this is right
- The progenitor experienced two distinct episodes of enhanced mass loss shortly before core collapse.
- The supernova's spectral evolution bridges characteristics of SN IIn and SN Ibn.
- Precursor activity is directly linked to the mass ejection events that shape the subsequent light curve.
- Late-time spectra indicate persistent interaction with the circumstellar material.
Where Pith is reading between the lines
- Multiple discrete mass-loss events may be common in the final stages of massive star evolution leading to interacting supernovae.
- The transitional nature could help identify the evolutionary sequence from LBVs to WR stars through supernova observations.
- Similar double-peaked light curves in other events might indicate analogous binary or episodic mass loss histories.
Load-bearing premise
The observed light curve shape and spectral features arise entirely from shock interaction with circumstellar material expelled in two discrete pre-explosion events, with no significant contribution from radioactive decay or central engine activity.
What would settle it
A late-time light curve that deviates from the interaction model prediction, such as showing a radioactive decay tail inconsistent with the fitted parameters, or spectra lacking the expected narrow line profiles from CSM interaction would falsify the model.
Figures
read the original abstract
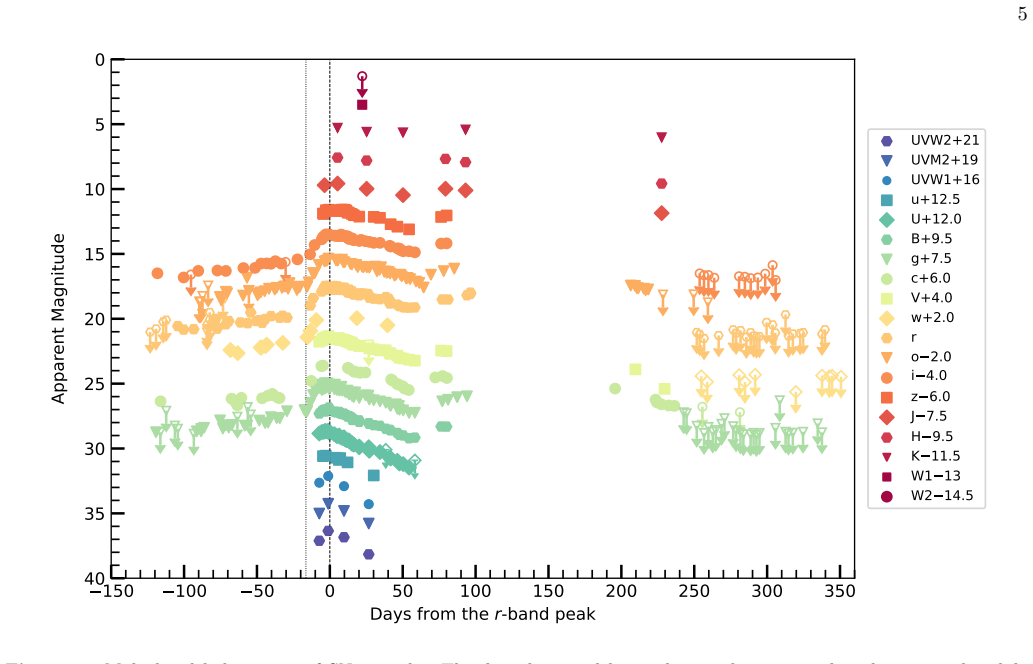
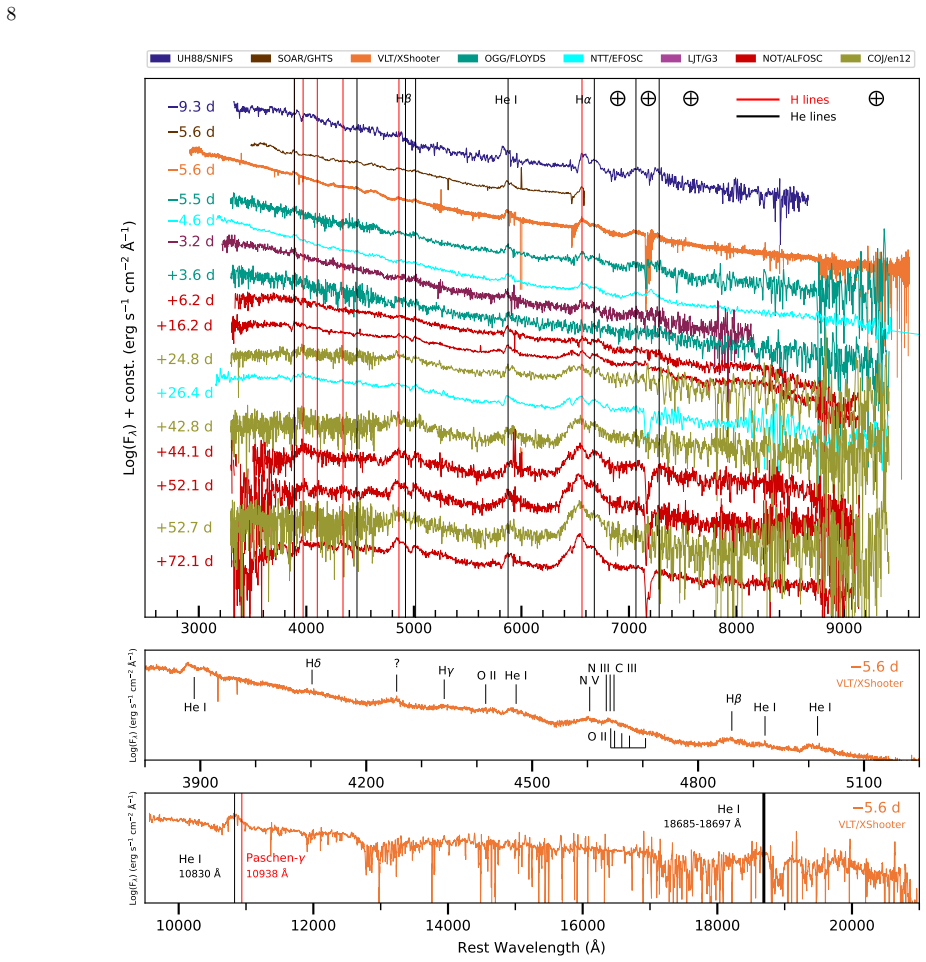
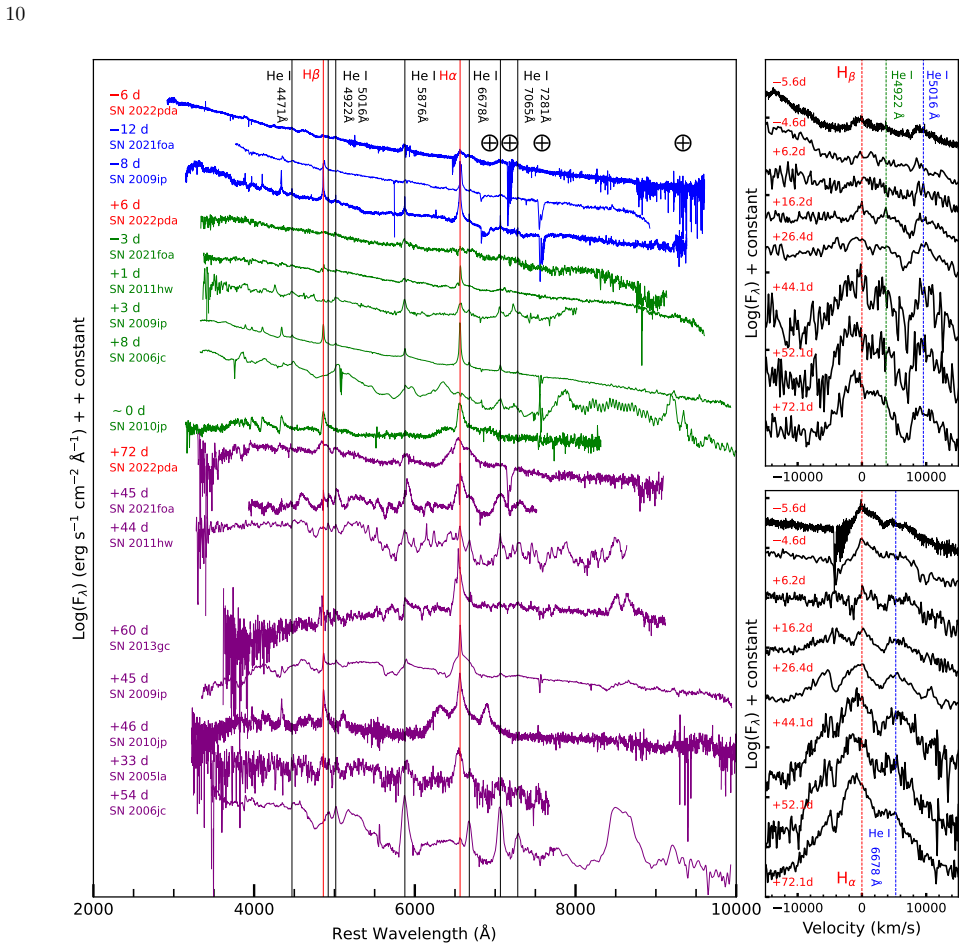
We report the results of a photometric and spectroscopic follow-up campaign of the unusual interacting supernova (SN) 2022pda. Precursor variability lasting $\sim 100$ days is observed before the explosion. The SN light curve has a double peak shape. It reached a first maximum of $M_{\rm{r}} = -19.6 \pm 0.2$\,mag, followed by an initial two-month decline and a second, broad peak lasting about six months. The early spectra show a blue continuum with dominant H and He emission lines. A high-resolution pre-maximum spectrum shows that the profile of the \Hei~$\lambda$5876 line consists of a moderately narrow ($\sim 1900$ \kms) P~Cygni absorption superposed on a broader ($\sim 3300$ \kms) component. In the blue region, several spectral features are identified, including C {\sc iii}/N {\sc iii}/O {\sc ii} blends. Two broad bumps at 4600--5200 \AA, 6400--6800~\AA\ regions reveal a complex profile, which are likely due to blends of H, He, and other emission lines. Late-time spectra are still dominated by prominent and broad H and He lines in emission. Shock-driven model fits to the bolometric light curve suggest that the SN is powered by interaction with a massive CSM with enhanced mass loss rates $\sim 5$ \msun yr$^{-1}$, expelled during two events occurred $\sim 1$ and $\sim 0.2$ years before the explosion. The overall SN evolution indicates that SN\,2022pda is a transitional event between a H-rich SN IIn (SN\,2009ip-like) and a He-rich SN Ibn. Our findings suggest that the progenitor was likely a Luminous Blue Variable transitioning towards a Wolf--Rayet stage.
Editorial analysis
A structured set of objections, weighed in public.
Referee Report
Summary. The paper reports photometric and spectroscopic observations of the interacting supernova SN 2022pda, including ~100 days of pre-explosion precursor variability and a double-peaked light curve reaching Mr = -19.6 ± 0.2 mag. Early spectra show a blue continuum with H and He emission lines (including a P Cygni profile on He I λ5876 with narrow ~1900 km/s and broad ~3300 km/s components), while late-time spectra remain dominated by broad H and He lines. Shock-interaction modeling of the bolometric light curve is used to argue that the event is powered by CSM interaction from two discrete pre-explosion mass-loss episodes at ~5 M⊙ yr⁻¹ occurring ~1 yr and ~0.2 yr before explosion, classifying SN 2022pda as transitional between H-rich Type IIn (e.g., SN 2009ip-like) and He-rich Type Ibn, with an LBV progenitor evolving toward a Wolf-Rayet stage.
Significance. If the modeling is robust and alternatives are excluded, the result would add a well-observed example of episodic mass loss in massive stars and strengthen the observational link between Type IIn and Ibn classes, with implications for progenitor channels in stellar evolution.
major comments (2)
- [Abstract] Abstract (modeling paragraph): the statement that 'shock-driven model fits to the bolometric light curve suggest' powering by CSM interaction with two discrete events at ~5 M⊙ yr⁻¹ supplies neither the model equations, the fitted parameters (CSM density profile, shock velocity, etc.), uncertainties on the mass-loss rate, χ² values, nor any explicit comparison runs that include a 56Ni component. This is load-bearing for the claim that the two-event timing and LBV-to-WR interpretation are required.
- [Abstract] Abstract (modeling paragraph): the central assumption that radioactive decay and central-engine contributions are negligible is not tested; a modest 56Ni mass (~0.05–0.1 M⊙) could plausibly affect the second peak or late-time tail, rendering the derived CSM mass and event timings non-unique.
minor comments (2)
- [Abstract] Abstract: the mass-loss rate is quoted as ∼5 M⊙ yr⁻¹ without error bars or range, in contrast to the magnitude which includes ±0.2.
- [Abstract] Abstract: the precise method used to extract the two mass-loss event timings (~1 yr and ~0.2 yr) from the light-curve shape is not stated.
Simulated Author's Rebuttal
We thank the referee for their constructive comments on the modeling claims in the abstract. We respond point-by-point below and will incorporate revisions to address the concerns about transparency and testing of assumptions.
read point-by-point responses
-
Referee: [Abstract] Abstract (modeling paragraph): the statement that 'shock-driven model fits to the bolometric light curve suggest' powering by CSM interaction with two discrete events at ~5 M⊙ yr⁻¹ supplies neither the model equations, the fitted parameters (CSM density profile, shock velocity, etc.), uncertainties on the mass-loss rate, χ² values, nor any explicit comparison runs that include a 56Ni component. This is load-bearing for the claim that the two-event timing and LBV-to-WR interpretation are required.
Authors: The full shock-interaction modeling, including the semi-analytic equations, assumed CSM density profile (wind-like, s=2), shock velocities, mass-loss rate with uncertainties, χ² values, and explicit comparison to 56Ni-inclusive runs, is presented in the dedicated light-curve modeling section of the manuscript. The abstract is space-constrained and therefore summarizes only the principal result. We will revise the manuscript to add a concise reference to the key fitted parameters within the abstract and to expand the main-text discussion of the 56Ni comparison runs for greater transparency. revision: yes
-
Referee: [Abstract] Abstract (modeling paragraph): the central assumption that radioactive decay and central-engine contributions are negligible is not tested; a modest 56Ni mass (~0.05–0.1 M⊙) could plausibly affect the second peak or late-time tail, rendering the derived CSM mass and event timings non-unique.
Authors: We acknowledge that an explicit test of a modest 56Ni contribution was not shown. In the revised manuscript we will add a short modeling subsection (or supplementary figure) demonstrating that inclusion of 0.05–0.1 M⊙ of 56Ni does not reproduce the observed double-peaked morphology or late-time tail as well as the two-episode CSM-interaction model, thereby supporting the robustness of the derived timings and mass-loss rates. revision: yes
Circularity Check
Shock-interaction model fits assume CSM powering; mass-loss rate and 'suggestion' of interaction are fitted outputs by construction
specific steps
-
fitted input called prediction
[Abstract]
"Shock-driven model fits to the bolometric light curve suggest that the SN is powered by interaction with a massive CSM with enhanced mass loss rates ∼5 M⊙ yr−1, expelled during two events occurred ∼1 and ∼0.2 years before the explosion."
The paper selects shock-driven interaction models, fits them to the observed bolometric light curve, and then presents the resulting mass-loss rate and the conclusion of interaction powering as a 'suggestion' from the data. Because the models are constructed to assume interaction as the sole power source, both the fitted parameter (~5 M⊙ yr⁻¹) and the powering-mechanism claim are outputs of the model assumptions rather than independent tests.
full rationale
The paper's strongest claim—that the SN is powered by CSM interaction with two pre-explosion mass-loss episodes at ~5 M⊙ yr⁻¹—rests entirely on fitting shock-driven models to the bolometric light curve. The abstract explicitly states that these fits 'suggest' the powering mechanism and rates, but the models presuppose interaction dominance with no demonstrated comparison to 56Ni or engine contributions. This makes the derived rates and the transitional LBV-to-WR interpretation direct consequences of the model choice and fitting process rather than independent evidence. The derivation chain therefore reduces the central inference to the input assumptions of the chosen models.
Axiom & Free-Parameter Ledger
free parameters (1)
- enhanced mass loss rate =
~5 solar masses per year
axioms (1)
- domain assumption The supernova luminosity is powered by shock interaction with circumstellar material
Reference graph
Works this paper leans on
-
[1]
doi: 10.1111/j.1365-2966.2012.20768.x
Anderson, J. P., Habergham, S. M., James, P. A., & Hamuy, M. 2012, MNRAS, 424, 1372, doi: 10.1111/j.1365-2966.2012.21324.x Anupama, G. C., Sahu, D. K., Gurugubelli, U. K., et al. 2009, MNRAS, 392, 894, doi: 10.1111/j.1365-2966.2008.14129.x Astropy Collaboration, Robitaille, T. P., Tollerud, E. J., et al. 2013, A&A, 558, A33, doi: 10.1051/0004-6361/2013220...
-
[2]
Log of photometric observations of SN 2022pda. Code Diameter Telescope Instrument Site m TRAPPIST 0.60 TRAPPIST-S Telescope FLI ProLine ESO La Silla Observatory, La Silla, Chile Moravian 0.67/0.92 Schmidt Telescope Moravian Osservatorio Astronomico di Asiago, Asiago, Italy fa01∗ 1.00 LCO (CPT site) Sinistro LCO node at South African Astronomical Observato...
2013
-
[3]
Date MJD Phasea Telescope+Instrument Grism/Grating+Slit Spectral range Resolution Exp
Log of spectroscopic observations of SN 2022pda. Date MJD Phasea Telescope+Instrument Grism/Grating+Slit Spectral range Resolution Exp. time (days) ( ˚A) ( ˚A) (s) 20220925 59847.4−9.3 UH88+SNIFS B/R+? 3400-9100 R=1000 2700 20220929 59851.1−5.6 SOAR+GHTSRED 400 M1+1.0” 3700-7000 6 1800 20220929 59851.1−5.6 VLT+X-Shooter UVB/VIS/NIR+1.0” 3100-24800 R=5400/...
1986
-
[4]
for image subtraction with PSF matching. The instrumental magnitudes of the SN are measured through the PSF-fitting technique, and calibrated against the catalogues of the Landolt (1992), Pan-STARRS, and the Two Micron All Sky Survey (2MASS; Skrutskie et al. 2006). We retrieved the Single Exposure frames by the NEOWISE-Reactivation mission (Wright et al. ...
1992
-
[5]
The WISE magnitudes were calibrated against the WISE All-Sky Data Release catalog (Cutri et al
Then, we co-added them into a single image and performed the template-subtraction using images acquired on May 2014 (8 years before the explosion) as templates. The WISE magnitudes were calibrated against the WISE All-Sky Data Release catalog (Cutri et al. 2012). Swift/UVOT ultraviolet (UV) and optical photometry were retrieved from the NASA Swift Data Ar...
2014
-
[6]
were produced from the public Forced Photometry server 11 (Shingles et al. 2021). Pan-STARRS (PS1+PS2) data were obtained through forced photometry on template-subtracted images following the similar method as in ATLAS dataset: in both cases we stacked all measurements on a given day into a single measurement (for details of the Pan-STARRS transient surve...
2021
-
[7]
was obtained with the University of Hawaii 2.2m telescope (UH88) plus the Supernova Integral Field Spectrograph (SNIFS) mounted on Mauna Kea, Hawaii, USA. The spectroscopic follow-up observations were carried out at the following facilities, including the X-Shooter spectrograph mounted on the 8.2m Very Large Telescope (VLT) at the ESO Paranal observatory,...
2023
-
[8]
The spectra were reduced using routine iraf tasks or with dedicated pipelines for specific instruments such as Foscgui12, PESSTO pipeline (Smartt et al
with a global telescope network located at different sites: the FLOYDS (en06) spectrograph on the OGG 2m telescope at Haleakala Observatory, Maui, USA and the FLOYDS (en12) spectrograph on the COJ 2m telescope at Siding Spring Observatory, NSW, Australia, which are part of the Global Supernova Project (GSP). The spectra were reduced using routine iraf tas...
2015
-
[9]
Then, one-dimensional (1D) spectra were optimally extracted from the two-dimensional (2D) images
The different tools follow a standard manner: As a preliminary reduction, raw images were corrected for bias, overscan, trimming and flat fielding. Then, one-dimensional (1D) spectra were optimally extracted from the two-dimensional (2D) images. The wavelength calibration was performed using the arc-lamp spectra, while the flux of SN spectra was 7 ecsnoop...
discussion (0)
Sign in with ORCID, Apple, or X to comment. Anyone can read and Pith papers without signing in.