A Comparative Analysis of Clustering Algorithms for Characterizing Surface Ocean Variability in the Western Mediterranean
Pith reviewed 2026-06-29 14:51 UTC · model grok-4.3
The pith
K-means and Self-Organizing Maps identify four distinct seasonal clusters in western Mediterranean sea surface temperatures that remain after removing the annual cycle.
A machine-rendered reading of the paper's core claim, the machinery that carries it, and where it could break.
Core claim
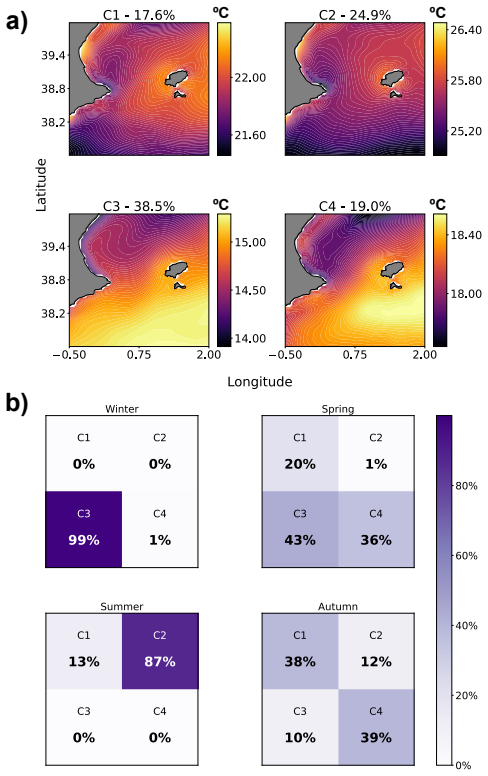
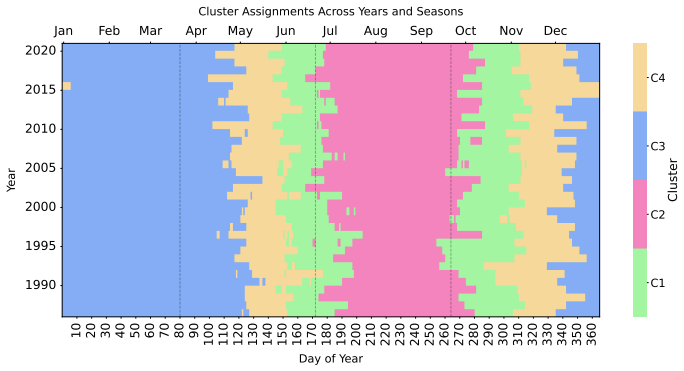
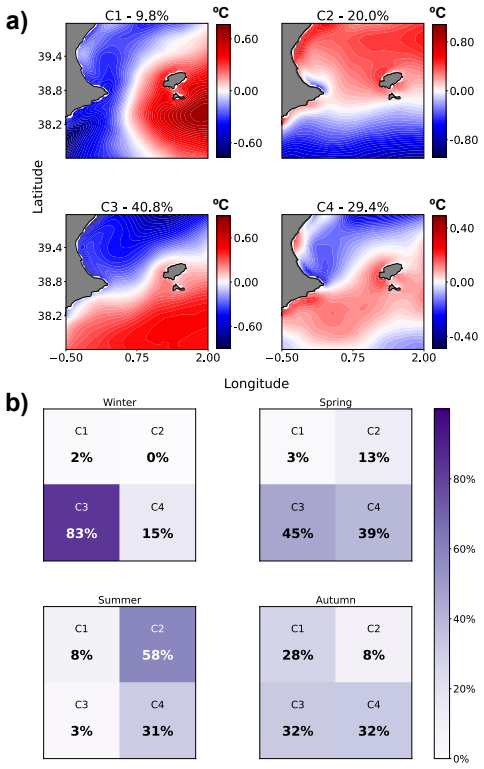
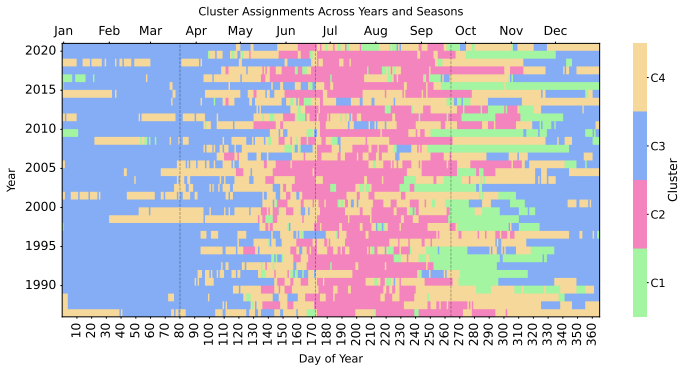
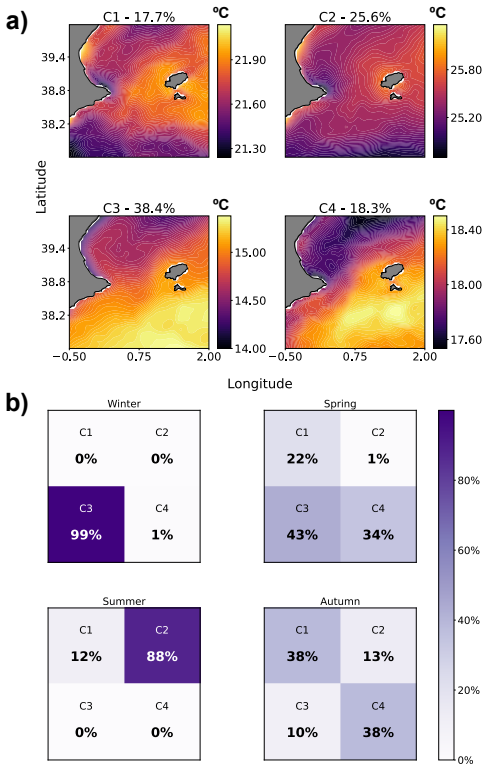
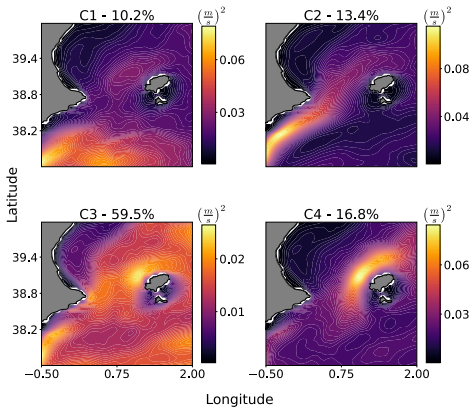
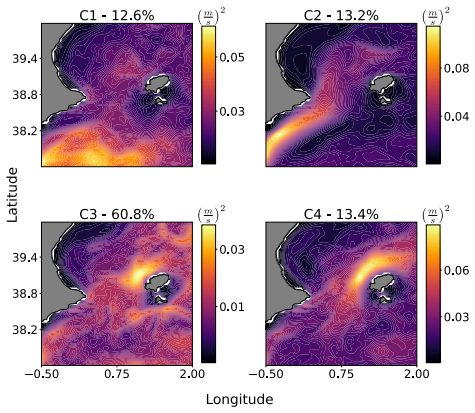
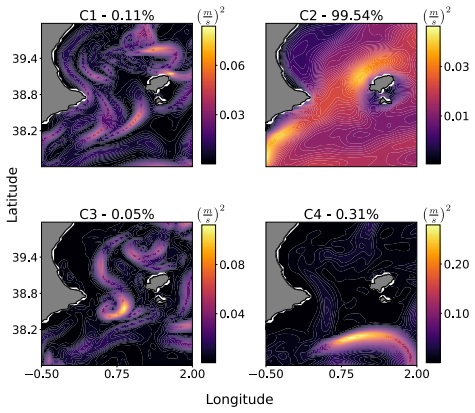
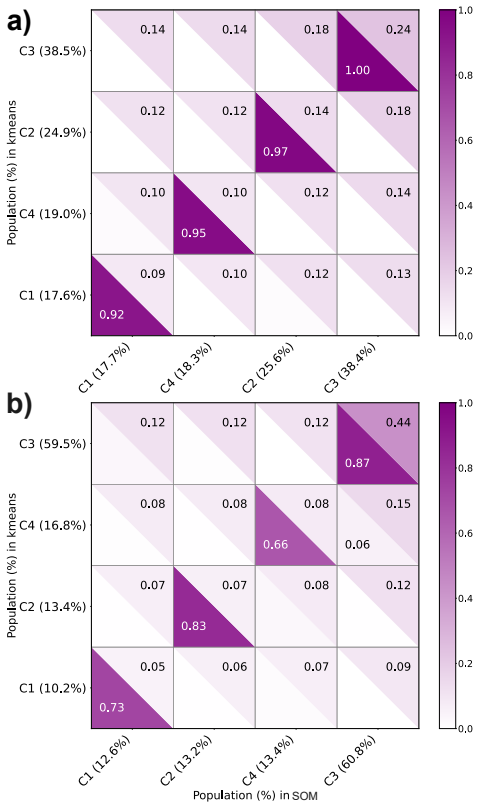
K-means and Self-Organizing Maps consistently delineate four distinct clusters of sea surface temperature configurations, aligned with the seasons even after removing the annual cycle, which indicates the persistence of seasonal structures beyond a mean effect in the temperature field. The study of surface kinetic energy reveals more complex circulation regimes where K-means and Self-Organizing Maps classify dominant large-scale patterns robustly while InfoMap uncovers finer-scale features such as localized jets and eddies.
What carries the argument
Clustering techniques (K-means, Self-Organizing Maps, and InfoMap) applied to daily snapshots of sea surface temperature and kinetic energy to identify regional patterns.
If this is right
- K-means and Self-Organizing Maps produce coherent classifications of temperature patterns across methods.
- Four clusters align with seasons for sea surface temperature even without the annual cycle.
- Kinetic energy patterns are more complex and show finer details with InfoMap.
- InfoMap serves as a complement that can detect anomalies and extreme events in the flow field.
Where Pith is reading between the lines
- Similar clustering could help identify persistent structures in other marginal seas or ocean basins.
- The identified clusters may link to specific transport properties or biogeochemical processes in the region.
- These methods could be tested on model output to see if the same seasonal clusters appear in simulations.
Load-bearing premise
That the clusters found by the algorithms represent physically meaningful and recurrent dynamical structures in the ocean rather than depending mainly on the algorithm choice or data handling steps.
What would settle it
A test showing that the four clusters disappear or change when using different spatial domains, preprocessing, or when compared to independent oceanographic observations of seasonal regimes would challenge the main result.
Figures
read the original abstract
Understanding regional dynamical structures in the sea is fundamental to characterize energy transfer and transport properties, with implications in physical and biogeochemical modeling and characterization. In this work, we study the potential of clustering techniques to identify regional patterns, persistent or recurrent configurations, out of daily snapshots of sea surface temperature and kinetic energy in a region of the western Mediterranean Sea. From the methodological perspective, we use different clustering techniques: K-means, Self-Organizing Maps and InfoMap to verify if the patterns found are coherent across methods. Our results show that K-means and Self-Organizing Maps consistently delineate four distinct clusters of sea surface temperature configurations, aligned with the seasons even after removing the annual cycle, which indicates the persistence of seasonal structures beyond a mean effect in the temperature field. The study of surface kinetic energy, characterized by higher spatial and temporal variability, reveals more complex circulation regimes. While K-means and Self-Organizing Maps provide a robust and convergent classification of the dominant large-scale energy patterns, InfoMap uncovers finer-scale features such as localized jets and eddies. InfoMap, in particular, provides a complementary perspective to the partition-based methods, validating subtle yet significant hydrodynamic structures and acting as an anomaly detector for extreme events.
Editorial analysis
A structured set of objections, weighed in public.
Referee Report
Summary. The manuscript applies K-means, Self-Organizing Maps (SOM), and InfoMap clustering algorithms to daily sea surface temperature (SST) and kinetic energy (KE) fields from the western Mediterranean Sea. It reports that K-means and SOM consistently identify four clusters in both raw and annual-cycle-removed SST data that align with seasonal configurations, while KE exhibits more complex regimes where InfoMap additionally detects finer-scale features such as localized jets and eddies; the work positions the cross-method agreement as evidence for persistent structures beyond mean effects.
Significance. If the qualitative alignments hold under quantitative scrutiny, the comparative framework demonstrates complementary strengths of partition-based versus network-based clustering for characterizing regional ocean variability, with direct relevance to energy transfer and modeling applications noted in the abstract.
major comments (1)
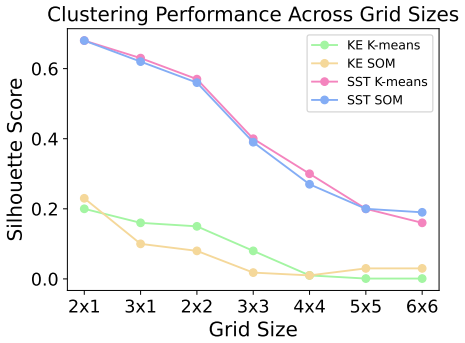
- [Results] Results section (and abstract): the central claim that K-means and SOM 'consistently delineate four distinct clusters... aligned with the seasons even after removing the annual cycle' rests entirely on qualitative description of cluster-season correspondence; no quantitative validation metrics, inter-method agreement indices (e.g., adjusted Rand index), silhouette scores, or error estimates on the detrended fields are reported, leaving the persistence claim without measurable support.
minor comments (1)
- [Methods] Methods: while the choice of k=4 is stated for both K-means and SOM, the rationale or sensitivity analysis for this number of clusters (a free parameter) should be expanded for reproducibility.
Simulated Author's Rebuttal
We thank the referee for the constructive comment on strengthening the quantitative basis of our claims. We address the point below and will revise the manuscript accordingly.
read point-by-point responses
-
Referee: [Results] Results section (and abstract): the central claim that K-means and SOM 'consistently delineate four distinct clusters... aligned with the seasons even after removing the annual cycle' rests entirely on qualitative description of cluster-season correspondence; no quantitative validation metrics, inter-method agreement indices (e.g., adjusted Rand index), silhouette scores, or error estimates on the detrended fields are reported, leaving the persistence claim without measurable support.
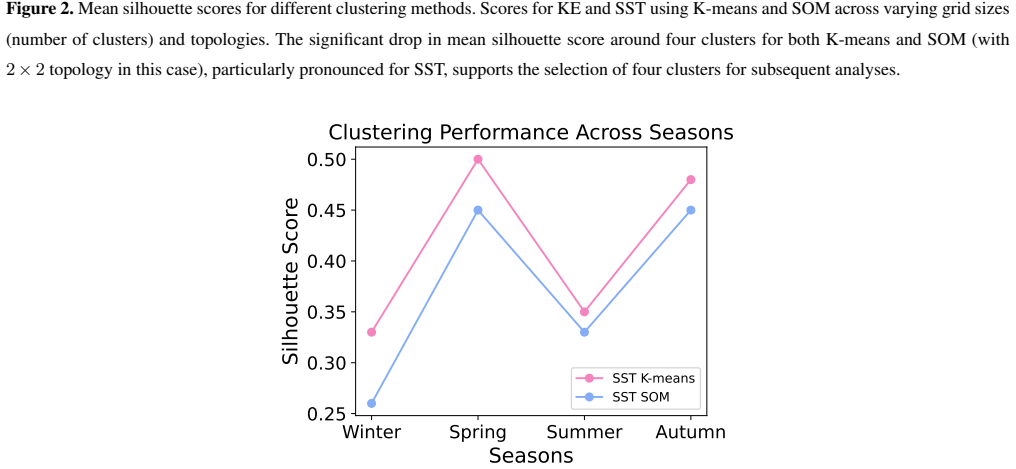
Authors: We agree that the persistence claim would be strengthened by quantitative metrics. In the revised manuscript we will compute and report silhouette scores for the K-means and SOM clusterings on both raw and annual-cycle-removed SST fields, the adjusted Rand index between the two methods to quantify inter-method agreement, and basic stability/error estimates (e.g., via bootstrap resampling of the detrended fields). These results will be added to the Results section with a brief reference in the abstract. revision: yes
Circularity Check
No significant circularity identified
full rationale
The manuscript applies standard, off-the-shelf clustering algorithms (K-means, SOM, InfoMap) directly to preprocessed observational SST and KE fields. No equations, derivations, fitted parameters, or self-referential definitions appear; the reported four-cluster seasonal alignment is an empirical output of the algorithms rather than a quantity constructed from itself. Cross-method comparison and anomaly removal are described as preprocessing choices without any reduction of the central claim to a self-citation chain or input-by-construction step. The analysis is therefore self-contained against external benchmarks.
Axiom & Free-Parameter Ledger
free parameters (1)
- number of clusters
axioms (1)
- domain assumption Clustering partitions of daily ocean fields correspond to persistent or recurrent dynamical configurations.
Reference graph
Works this paper leans on
-
[1]
S., van Albada, G
Bação, F., Lobo, V ., and Painho, M.: Self-organizing Maps as Substitutes for K-Means Clustering, in: Computational Science – ICCS 2005, edited by Sunderam, V . S., van Albada, G. D., Sloot, P. M. A., and Dongarra, J., pp. 476–483, Springer Berlin Heidelberg, Berlin, Heidelberg, ISBN 978-3-540-32118-7,
2005
-
[2]
Barral, Q.-B., Zakardjian, B., Dumas, F., Garreau, P., Testor, P., and Beuvier, J.: Characterization of fronts in the Western Mediterranean with a special focus on the North Balearic Front, Progress in Oceanography, 197, 102 636, https://doi.org/https://doi.org/10.1016/j.pocean.2021.102636,
-
[3]
Budayan, C., Dikmen, I., and Birgonul, M. T.: Comparing the performance of traditional cluster analysis, self-organizing maps and fuzzy C- means method for strategic grouping, Expert Systems with Applications, 36, 11 772–11 781, https://doi.org/10.1016/j.eswa.2009.04.022,
-
[4]
Celebi, M. E., Kingravi, H. A., and Vela, P. A.: A comparative study of efficient initialization methods for the k-means clustering algorithm, Expert Systems with Applications, 40, 200–210, https://doi.org/10.1016/j.eswa.2012.07.021,
-
[5]
D’Ortenzio, F., Iudicone, D., de Boyer Montegut, C., Testor, P., Antoine, D., Marullo, S., Santoleri, R., and Madec, G.: Seasonal variability of the mixed layer depth in the Mediterranean Sea as derived from in situ profiles, Geophysical Research Letters, 32, https://doi.org/https://doi.org/10.1029/2005GL022463,
-
[6]
[Data set], https://doi.org/10.25423/CMCC/MEDSEA_MULTIYEAR_PHY_006_004_E3R1,
work page doi:10.25423/cmcc/medsea_multiyear_phy_006_004_e3r1
-
[7]
Escudier, R., Clementi, E., Cipollone, A., Pistoia, J., Drudi, M., Grandi, A., Lyubartsev, V ., Lecci, R., Aydogdu, A., Masina, S., Coppini, G., and Pinardi, N.: A High Resolution Reanalysis for the Mediterranean Sea, Frontiers in Earth Science, 9, https://doi.org/10.3389/feart.2021.702285,
-
[8]
Finley, J., Fosu, B., Fuhrmann, C., Mercer, A., and Rudzin, J.: Quantifying Downstream Climate Impacts of Sea Surface Temperature Patterns in the Eastern Tropical Pacific Using Clustering, Climate, 12, 71, https://doi.org/10.3390/cli12050071,
-
[9]
Halkidi, M., Batistakis, Y ., and Vazirgiannis, M.: On Clustering Validation Techniques, Journal of Intelligent Information Systems, 17, 107–145, https://doi.org/10.1023/A:1012801612483,
-
[10]
Hernández-Carrasco, I. and Orfila, A.: The Role of an Intense Front on the Connectivity of the Western Mediterranean Sea: The Cartagena- Tenes Front, Journal of Geophysical Research: Oceans, 123, 4398–4422, https://doi.org/10.1029/2017JC013613,
-
[11]
Hernández-Carrasco, I., Solabarrieta, L., Rubio, A., Esnaola, G., Reyes, E., and Orfila, A.: Impact of HF radar current gap-filling method- ologies on the Lagrangian assessment of coastal dynamics, Ocean Science, 14, 827–847, https://doi.org/10.5194/os-14-827-2018,
-
[12]
Kawamoto, T. and Rosvall, M.: Estimating the resolution limit of the map equation in community detection, Physical Review E, 91, 012 809, https://doi.org/10.1103/PhysRevE.91.012809,
-
[13]
Cybern, 43, 59–69, https://doi.org/10.1007/BF00337288,
23 Kohonen, T.: Self-Organized Formation of Topologically Correct Feature Maps, Biol. Cybern, 43, 59–69, https://doi.org/10.1007/BF00337288,
-
[14]
Kumar, U. A. and Dhamija, Y .: Comparative analysis of SOM neural network with K-means clustering algorithm, in: 2010 IEEE International Conference on Management of Innovation & Technology, pp. 55–59, https://doi.org/10.1109/ICMIT.2010.5492838,
-
[15]
Lancichinetti, A. and Fortunato, S.: Consensus clustering in complex networks, Scientific reports, 2, 336, https://doi.org/10.1038/srep00336,
-
[16]
Leloup, J. A., Lachkar, Z., Boulanger, J. P., and Thiria, S.: Detecting decadal changes in ENSO using neural networks, Climate Dynamics, 28, 147–162, https://doi.org/10.1007/s00382-006-0173-1,
-
[17]
Liu, Y . and Weisberg, R. H.: Patterns of ocean current variability on the West Florida Shelf using the self-organizing map, Journal of Geophysical Research: Oceans, 110, 1–12, https://doi.org/10.1029/2004JC002786,
-
[18]
Liu, Y ., Weisberg, R. H., and Mooers, C. N.: Performance evaluation of the self-organizing map for feature extraction, Journal of Geophysical Research: Oceans, 111, https://doi.org/10.1029/2005JC003117,
-
[19]
H., Vignudelli, S., and Mitchum, G
Liu, Y ., Weisberg, R. H., Vignudelli, S., and Mitchum, G. T.: Patterns of the loop current system and regions of sea surface height vari- ability in the eastern Gulf of Mexico revealed by the self-organizing maps, Journal of Geophysical Research: Oceans, 121, 2347–2366, https://doi.org/10.1002/2015JC011493,
-
[20]
Millot, C.: Circulation in the Western Mediterranean Sea, Journal of Marine Systems, 20, 423–442, https://doi.org/10.1016/S0924- 7963(98)00078-5,
-
[21]
Richardson, A. J., En, C. R., and Shillington, F. A.: Using self-organizing maps to identify patterns in satellite imagery, vol. 59, pp. 223–239, ISSN 00796611, https://doi.org/10.1016/j.pocean.2003.07.006,
-
[22]
Rodríguez-Méndez, V .: Code and data for ”A Comparative Analysis of Clustering Algorithms for Characterizing Surface Ocean Variability in the Western Mediterranean”, Available from digital.csic, https://doi.org/10.20350/digitalCSIC/18346,
-
[23]
Sayol, J., Orfila, A., Simarro, G., Lopez, C., Renault, L., Galan, A., and Conti, D.: Sea surface transport in the Western Mediterranean Sea: A Lagrangian perspective, Journal of Geophysical Research: Oceans, 118, 6371–6384, https://doi.org/https://doi.org/10.1002/2013JC009243,
-
[24]
Solidoro, C., Bandelj, V ., Barbieri, P., Cossarini, G., and Umani, S. F.: Understanding dynamic of biogeochemical properties in the northern Adriatic Sea by using self-organizing maps and k-means clustering, Journal of Geophysical Research: Oceans, 112, https://doi.org/10.1029/2006JC003553,
-
[25]
24 Thomson, R. E. and Emery, W. J.: Data analysis methods in physical oceanography, 3rd edition, Elsevier Science, ISBN 978-0-12-387782-6, https://doi.org/10.1016/C2010-0-66362-0,
-
[26]
Vesanto, J. and Alhoniemi, E.: Clustering of the self-organizing map, IEEE Transactions on Neural Networks, 11, 586–600, https://doi.org/10.1109/72.846731,
discussion (0)
Sign in with ORCID, Apple, or X to comment. Anyone can read and Pith papers without signing in.