Day-Ahead Electricity Price Forecasting Using a Multivariate Group Lasso Method
Pith reviewed 2026-06-29 09:55 UTC · model grok-4.3
The pith
A multivariate Group Lasso method improves day-ahead electricity price forecasts by capturing persistent temporal group effects in explanatory variables.
A machine-rendered reading of the paper's core claim, the machinery that carries it, and where it could break.
Core claim
Electricity price signals exhibit complex temporal group effects where the influence of explanatory variables persists across consecutive blocks of time; a multivariate Group Lasso formulation that explicitly leverages these multi-feature temporal group effects produces improved day-ahead forecasts for the full price vector.
What carries the argument
Multivariate Group Lasso formulation that groups regression coefficients across time blocks to enforce shared sparsity patterns reflecting persistent temporal effects.
If this is right
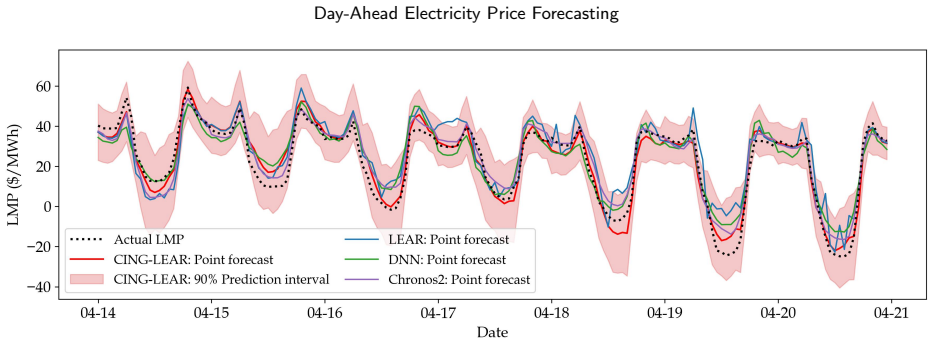
- The method yields measurable gains in both point forecast accuracy and probabilistic calibration on two full years of CAISO prices.
- It achieves second place in an international electricity price forecasting challenge while using significantly less input information than top entries.
- It matches or exceeds the performance of two existing operational forecasting systems deployed in CAISO.
- The formulation preserves interpretability through sparse coefficient groups and runs with low computational complexity.
Where Pith is reading between the lines
- The same grouped temporal structure could be tested in other energy time series such as load or renewable generation forecasts.
- If the group effects are market-specific, the penalty structure would need re-tuning when moving to different regions or price regimes.
- The approach may serve as a lightweight benchmark for more complex neural models that also aim to capture multi-scale temporal dependence.
Load-bearing premise
The complex temporal group effects observed in CAISO pricing signals persist in a way that can be captured and exploited by a Group Lasso penalty for better out-of-sample forecasts.
What would settle it
On held-out CAISO data or new market data, the Group Lasso method fails to improve point or probabilistic metrics relative to the strongest non-grouped lasso or deep learning baselines.
Figures
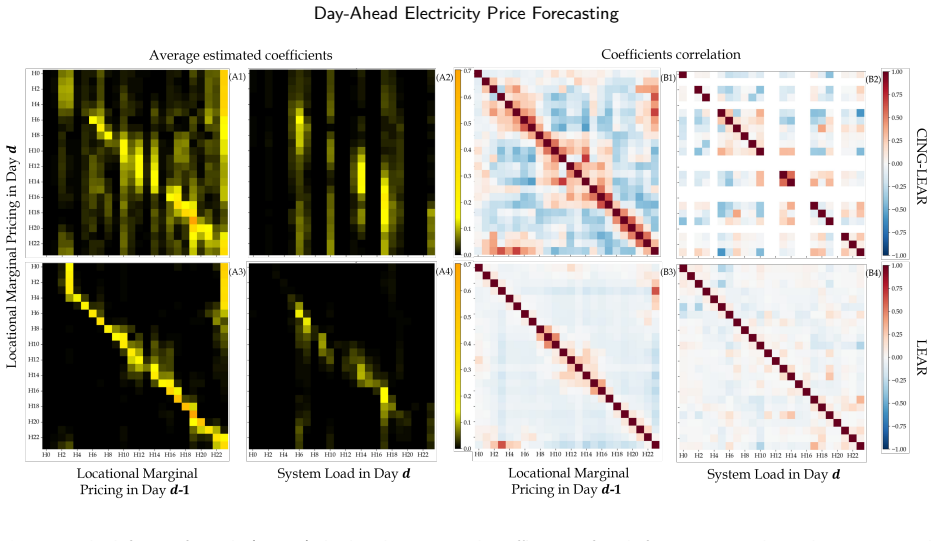
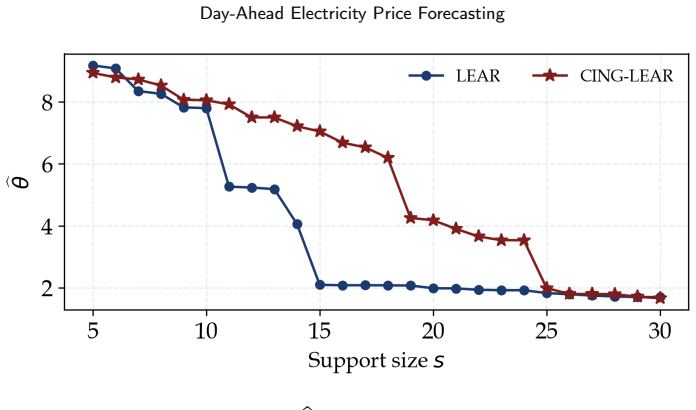
read the original abstract
Electricity price signals in modern power systems exhibit complex dependence structures that render forecasting inherently challenging. Our analysis of real-world pricing signals from the California Independent System Operator (CAISO) reveals complex temporal group effects, whereby the influence of explanatory variables on electricity prices persists across consecutive blocks of time due to underlying economic and operational drivers. In response, we propose a multivariate statistical method based on a Group Lasso formulation to forecast the vector of day-ahead electricity prices, by leveraging multi-feature temporal group effects. Our approach is evaluated on two full years of electricity prices from CAISO, demonstrating considerable improvements in point and probabilistic forecast metrics compared to a wide array of statistical and deep learning methods. Theoretical and empirical analyses confirm the effectiveness of the proposed approach in modeling realistic group effects, maintaining both interpretability and low computational complexity. When retrospectively evaluated on test data from a recent international electricity price forecasting challenge, the proposed method ranked in second place, despite having access to significantly less information than competing approaches. Finally, the proposed method is independently validated against two operational electricity price forecasting systems in CAISO, demonstrating competitive predictive performance and practical relevance.
Editorial analysis
A structured set of objections, weighed in public.
Referee Report
Summary. The manuscript proposes a multivariate Group Lasso method for day-ahead electricity price forecasting that exploits identified temporal group effects in CAISO data. It claims considerable improvements in both point and probabilistic forecast metrics over a range of statistical and deep learning baselines on two full years of CAISO data, a second-place ranking in a recent international electricity price forecasting challenge (despite using less information than competitors), competitive performance against two operational CAISO systems, and supporting theoretical and empirical analyses confirming the method's ability to model realistic group effects while preserving interpretability and low computational cost.
Significance. If the reported empirical gains hold under rigorous verification, the work provides a statistically grounded, interpretable alternative to black-box models for electricity price forecasting. The use of held-out CAISO data, an external challenge benchmark, and operational validation, together with the emphasis on group-structured temporal dependence, represents a practical contribution to the field. The low computational complexity and interpretability are additional strengths that could facilitate adoption in real-time market operations.
major comments (2)
- §4 (Results on CAISO data): The central claim of 'considerable improvements' in point and probabilistic metrics is load-bearing for the paper's contribution, yet the provided abstract supplies no numerical values, confidence intervals, or statistical significance tests; the full results section must include these (e.g., specific MAE, RMSE, CRPS deltas versus each baseline) to allow assessment of effect size and robustness.
- §5 (Challenge evaluation): The second-place ranking claim is central to the practical relevance argument, but requires explicit documentation of the exact test period, the precise information set available to competing entries, the evaluation metric, and the ranking methodology to substantiate that the method achieved this with 'significantly less information'.
minor comments (2)
- Abstract: Consider adding one or two concrete quantitative highlights (e.g., 'X% reduction in MAE') to make the performance claims immediately verifiable without requiring the reader to reach the results tables.
- Notation: Ensure consistent use of boldface or other conventions for vectors (e.g., the day-ahead price vector) throughout the method and results sections.
Simulated Author's Rebuttal
We thank the referee for the constructive comments and the recommendation of minor revision. The points raised help clarify the presentation of our empirical results. We address each major comment below.
read point-by-point responses
-
Referee: §4 (Results on CAISO data): The central claim of 'considerable improvements' in point and probabilistic metrics is load-bearing for the paper's contribution, yet the provided abstract supplies no numerical values, confidence intervals, or statistical significance tests; the full results section must include these (e.g., specific MAE, RMSE, CRPS deltas versus each baseline) to allow assessment of effect size and robustness.
Authors: We agree that explicit numerical deltas, confidence intervals, and significance tests improve assessment of the results. While §4 already reports MAE, RMSE, and CRPS values for the proposed method against all baselines on the full two-year CAISO dataset, we will revise the section to add: (i) explicit performance deltas relative to each baseline, (ii) 95% bootstrap confidence intervals around the metrics, and (iii) paired statistical tests (e.g., Diebold-Mariano) for significance. These additions will be included in the revised manuscript. revision: yes
-
Referee: §5 (Challenge evaluation): The second-place ranking claim is central to the practical relevance argument, but requires explicit documentation of the exact test period, the precise information set available to competing entries, the evaluation metric, and the ranking methodology to substantiate that the method achieved this with 'significantly less information'.
Authors: We agree that greater explicitness strengthens the claim. Section §5 currently summarizes the retrospective evaluation and notes the limited information set, but we will expand it with a dedicated paragraph or table that states: the precise test period dates, the exact inputs used by our method versus those available to competitors, the evaluation metric, and the ranking procedure. This will directly substantiate the 'significantly less information' statement. The revision will be made. revision: yes
Circularity Check
No significant circularity
full rationale
The paper's central claim is an empirical result: a multivariate Group Lasso method, motivated by observed temporal group effects in CAISO electricity price data, is evaluated on two full years of held-out CAISO data plus an external international forecasting challenge, where it achieves measurable improvements in point/probabilistic metrics and a second-place ranking. No equations, derivations, or self-citations are presented that reduce the reported performance gains to quantities defined by construction from the fitted parameters or inputs of the same dataset. The method is presented as a standard penalized regression approach whose effectiveness is confirmed by out-of-sample testing, rendering the derivation chain self-contained against external benchmarks.
Axiom & Free-Parameter Ledger
axioms (1)
- domain assumption Complex temporal group effects persist across consecutive blocks of time in electricity pricing signals due to economic and operational drivers.
Reference graph
Works this paper leans on
-
[1]
Min-maxregretbiddingstrategyforthermalgeneratorconsideringpriceuncertainty
LeiFan,JianhuiWang,RuiweiJiang,andYongpeiGuan. Min-maxregretbiddingstrategyforthermalgeneratorconsideringpriceuncertainty. IEEE Transactions on Power Systems, 29(5):2169–2179, 2014
2014
-
[2]
Price-taker offering strategy in electricity pay-as-bid markets.IEEE Transactions on Power Systems, 33(2):2175–2183, 2017
Nicolo Mazzi, Jalal Kazempour, and Pierre Pinson. Price-taker offering strategy in electricity pay-as-bid markets.IEEE Transactions on Power Systems, 33(2):2175–2183, 2017
2017
-
[3]
From market signals to maintenance decisions: Grid-informed maintenance optimization in offshore wind farms
Keyi Wang, Robert Mieth, and Ahmed Aziz Ezzat. From market signals to maintenance decisions: Grid-informed maintenance optimization in offshore wind farms. 2026
2026
-
[4]
Rafał Weron. Electricity price forecasting: A review of the state-of-the-art with a look into the future.International Journal of Forecasting, 30(4):1030–1081, 2014. doi: 10.1016/j.ijforecast.2014.08.008
-
[5]
AhmedAzizEzzat,MahanMansouri,MuratYildirim,andXiaoleiFang. IISEPG&Eenergyanalyticschallenge2024:Forecastingday-ahead electricity prices.IISE Transactions, 58(1):117–129, 2026. doi: 10.1080/24725854.2024.2447049
-
[6]
Forecasting electricity prices for a day-ahead pool-based electric energy market.International Journal of Forecasting, 21(3):435–462, 2005
Antonio J Conejo, Javier Contreras, Rosa Espinola, and Miguel A Plazas. Forecasting electricity prices for a day-ahead pool-based electric energy market.International Journal of Forecasting, 21(3):435–462, 2005
2005
-
[7]
Applicationofpublic-domainmarketinformationtoforecastOntario’s wholesale electricity prices.IEEE Transactions on Power Systems, 21(4):1707–1717, 2006
HamidrezaZareipour,ClaudioACanizares,andKankarBhattacharya. Applicationofpublic-domainmarketinformationtoforecastOntario’s wholesale electricity prices.IEEE Transactions on Power Systems, 21(4):1707–1717, 2006
2006
-
[8]
The effect of wind generation and weekday on spanish electricity spot price forecasting.Electric Power Systems Research, 81(10):1924–1935, 2011
Alberto Cruz, Antonio Muñoz, José Luis Zamora, and Rosa Espínola. The effect of wind generation and weekday on spanish electricity spot price forecasting.Electric Power Systems Research, 81(10):1924–1935, 2011
1924
-
[9]
Intra-day and regime-switching dynamics in electricity price formation.Energy Economics, 30 (4):1776–1797, 2008
Nektaria V Karakatsani and Derek W Bunn. Intra-day and regime-switching dynamics in electricity price formation.Energy Economics, 30 (4):1776–1797, 2008
2008
-
[10]
Automated variable selection and shrinkage for day-ahead electricity price forecasting.Energies, 9(8):621, 2016
Bartosz Uniejewski, Jakub Nowotarski, and Rafał Weron. Automated variable selection and shrinkage for day-ahead electricity price forecasting.Energies, 9(8):621, 2016
2016
-
[11]
Day-aheadelectricitypriceforecastingwithhigh-dimensionalstructures:Univariatevs.multivariatemodeling frameworks.Energy Economics, 70:396–420, 2018
FlorianZielandRafałWeron. Day-aheadelectricitypriceforecastingwithhigh-dimensionalstructures:Univariatevs.multivariatemodeling frameworks.Energy Economics, 70:396–420, 2018
2018
-
[12]
Raffaele Sgarlato and Florian Ziel. The role of weather predictions in electricity price forecasting beyond the day-ahead horizon.IEEE Transactions on Power Systems, 38(3):2500–2511, 2023. doi: 10.1109/TPWRS.2022.3180119
-
[13]
A random forest method for real-time price forecasting in new york electricity market
Jie Mei, Dawei He, Ronald Harley, Thomas Habetler, and Guodong Qu. A random forest method for real-time price forecasting in new york electricity market. In2014 IEEE PES General Meeting | Conference & Exposition, pages 1–5. IEEE, 2014
2014
-
[14]
An online electricity market price forecasting method via random forest.IEEE Transactions on Industry Applications, 58(6):7013–7021, 2022
Peng Wang, Bolun Liu, and Tianshu Hong. An online electricity market price forecasting method via random forest.IEEE Transactions on Industry Applications, 58(6):7013–7021, 2022
2022
-
[15]
Najeh Chaâbane. A novel auto-regressive fractionally integrated moving average–least-squares support vector machine model for electricity spot prices prediction.Journal of Applied Statistics, 41(3):635–651, 2014
2014
-
[16]
The day-ahead electricity price forecasting based on stacked CNN and LSTM
Xiaolong Xie, Wei Xu, and Hongzhi Tan. The day-ahead electricity price forecasting based on stacked CNN and LSTM. InInternational Conference on Intelligent Science and Big Data Engineering, pages 425–434. Springer, 2018
2018
-
[17]
Forecasting spot electricity prices: Deep learning approaches and empirical comparison of traditional algorithms.Applied Energy, 221:386–405, 2018
Jesus Lago, Fjo De Ridder, and Bart De Schutter. Forecasting spot electricity prices: Deep learning approaches and empirical comparison of traditional algorithms.Applied Energy, 221:386–405, 2018
2018
-
[18]
Short-term electricity price forecasting with stacked denoising autoencoders.IEEE Transactions on Power Systems, 32(4):2673–2681, 2016
Long Wang, Zijun Zhang, and Jieqiu Chen. Short-term electricity price forecasting with stacked denoising autoencoders.IEEE Transactions on Power Systems, 32(4):2673–2681, 2016
2016
-
[19]
Predicting real-time locational marginal prices: A GAN-based approach.IEEE Transactions on Power Systems, 37(2):1286–1296, 2021
Zhongxia Zhang and Meng Wu. Predicting real-time locational marginal prices: A GAN-based approach.IEEE Transactions on Power Systems, 37(2):1286–1296, 2021
2021
-
[20]
Real-time locational marginal price forecast: A decision transformer-based approach
Zhongxia Zhang and Meng Wu. Real-time locational marginal price forecast: A decision transformer-based approach. In2023 IEEE Power & Energy Society General Meeting (PESGM), pages 1–5. IEEE, 2023
2023
-
[21]
Forecasting day-ahead electricity prices: A review of state-of-the-art algorithms, best practices and an open-access benchmark.Applied Energy, 293:116983, 2021
Jesus Lago, Grzegorz Marcjasz, Bart De Schutter, and Rafał Weron. Forecasting day-ahead electricity prices: A review of state-of-the-art algorithms, best practices and an open-access benchmark.Applied Energy, 293:116983, 2021
2021
-
[22]
Hourlyelectricitypricesinday-aheadmarkets.EnergyEconomics,29(2):240–248, 2007
RonaldHuisman,ChristianHuurman,andRonaldMahieu. Hourlyelectricitypricesinday-aheadmarkets.EnergyEconomics,29(2):240–248, 2007
2007
-
[23]
Bayesiandensityforecastingofintradayelectricitypricesusingmultivariateskewtdistributions
AnastasiosPanagiotelisandMichaelSmith. Bayesiandensityforecastingofintradayelectricitypricesusingmultivariateskewtdistributions. International Journal of Forecasting, 24(4):710–727, 2008
2008
-
[24]
A vector autoregressive model for electricity prices subject to long memory and regime switching.Energy Economics, 32(5):1044–1058, 2010
Niels Haldrup, Frank S Nielsen, and Morten Ørregaard Nielsen. A vector autoregressive model for electricity prices subject to long memory and regime switching.Energy Economics, 32(5):1044–1058, 2010
2010
-
[25]
Forecasting electricity prices by extracting dynamic common factors: Application to the Iberian market.IET Generation, Transmission & Distribution, 6(1):11–20, 2012
Carolina García-Martos, Julio Rodríguez, and María Jesús Sánchez. Forecasting electricity prices by extracting dynamic common factors: Application to the Iberian market.IET Generation, Transmission & Distribution, 6(1):11–20, 2012. Wang et al.:Preprint submitted to Applied Energy in May 2026Page 14 of 15 Day-Ahead Electricity Price Forecasting
2012
-
[26]
Forecasting of daily electricity prices with factor models: Utilizing intra-day and inter-zone relationships.Computational Statistics, 30(3):805–819, 2015
Katarzyna Maciejowska and Rafał Weron. Forecasting of daily electricity prices with factor models: Utilizing intra-day and inter-zone relationships.Computational Statistics, 30(3):805–819, 2015
2015
-
[27]
Katarzyna Maciejowska and Rafał Weron. Short- and mid-term forecasting of baseload electricity prices in the uk: The impact of intra-day price relationships and market fundamentals.IEEE Transactions on Power Systems, 31(2):994–1005, 2016
2016
-
[28]
URLhttps://www.gridstatus.io/live/caiso
Gridstatus. URLhttps://www.gridstatus.io/live/caiso
-
[29]
sklearn.linear-model.multitasklasso — scikit-learn 1.4.0 documentation
scikit-learn developers. sklearn.linear-model.multitasklasso — scikit-learn 1.4.0 documentation
-
[30]
Blockwise coordinate descent procedures for the multi-task Lasso, with applications to neural semantic basis discovery
Han Liu, Mark Palatucci, and Jian Zhang. Blockwise coordinate descent procedures for the multi-task Lasso, with applications to neural semantic basis discovery. InInternational Conference on Machine Learning, 2009
2009
-
[31]
Bartosz Uniejewski, Rafał Weron, and Florian Ziel. Variance stabilizing transformations for electricity spot price forecasting.IEEE Transactions on Power Systems, 33(2):2219–2229, 2018. doi: 10.1109/TPWRS.2017.2734563
-
[32]
Chronos-2: From Univariate to Universal Forecasting
Abdul Fatir Ansari, Oleksandr Shchur, Jaris Küken, Andreas Auer, Boran Han, Pedro Mercado, Syama Sundar Rangapuram, Huibin Shen, Lorenzo Stella, Xiyuan Zhang, Mononito Goswami, Shubham Kapoor, Danielle C. Maddix, Pablo Guerron, Tony Hu, Junming Yin, Nick Erickson, Prateek Mutalik Desai, Hao Wang, Huzefa Rangwala, George Karypis, Yuyang Wang, and Michael B...
work page internal anchor Pith review Pith/arXiv arXiv doi:10.48550/arxiv.2510.15821 2025
-
[33]
GuillaumeObozinski,MartinJ.Wainwright,andMichaelI.Jordan. Supportunionrecoveryinhigh-dimensionalmultivariateregression.The Annals of Statistics, 39(1):1–47, February 2011. doi: 10.1214/10-AOS793. Wang et al.:Preprint submitted to Applied Energy in May 2026Page 15 of 15
discussion (0)
Sign in with ORCID, Apple, or X to comment. Anyone can read and Pith papers without signing in.