Population size and centrality effects on NO2 air pollution across and within European cities
Pith reviewed 2026-06-29 09:21 UTC · model grok-4.3
The pith
NO2 concentrations in European cities rise with population size and fall with distance from the center as consistent power laws that combine into a (N/r)^0.16 profile.
A machine-rendered reading of the paper's core claim, the machinery that carries it, and where it could break.
Core claim
NO2 concentrations increase with population size as a power law (exponent 0.14-0.22) and decrease with distance from the city center (exponent -0.12 to -0.18). These relations are recovered in parallel from ground and satellite data and combine into a scalable radial profile where total air pollution over a city is proportional to (N/r)^0.16.
What carries the argument
The combined scaling (N/r)^0.16 that folds population-size and centrality effects into one radial profile for NO2.
If this is right
- Total pollution load depends on the spatial integration of the (N/r) profile across the city area.
- Per-capita pollution can be obtained directly from the same scaling relation.
- The profile supplies a compact framework for estimating health consequences of changes in city population or extent.
- The structural form is independent of the choice between ground and satellite measurements.
Where Pith is reading between the lines
- Urban planners could estimate aggregate exposure from population and average radius without running full local dispersion models.
- The same functional form might be tested on other pollutants or on cities outside Europe to check whether the 0.16 exponent is general.
- If the scaling persists under city expansion, total emissions would grow more slowly than population once radial spread is taken into account.
Load-bearing premise
That the same power-law exponents hold uniformly across every city and both data sources once controls are applied, regardless of how distance or city edges are defined.
What would settle it
Repeating the regressions on the same cities but with a different distance metric or city-boundary definition and obtaining exponents outside the reported ranges.
Figures
read the original abstract
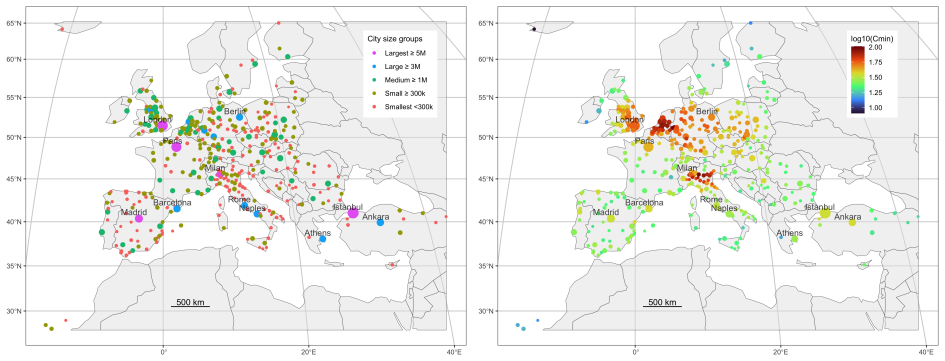
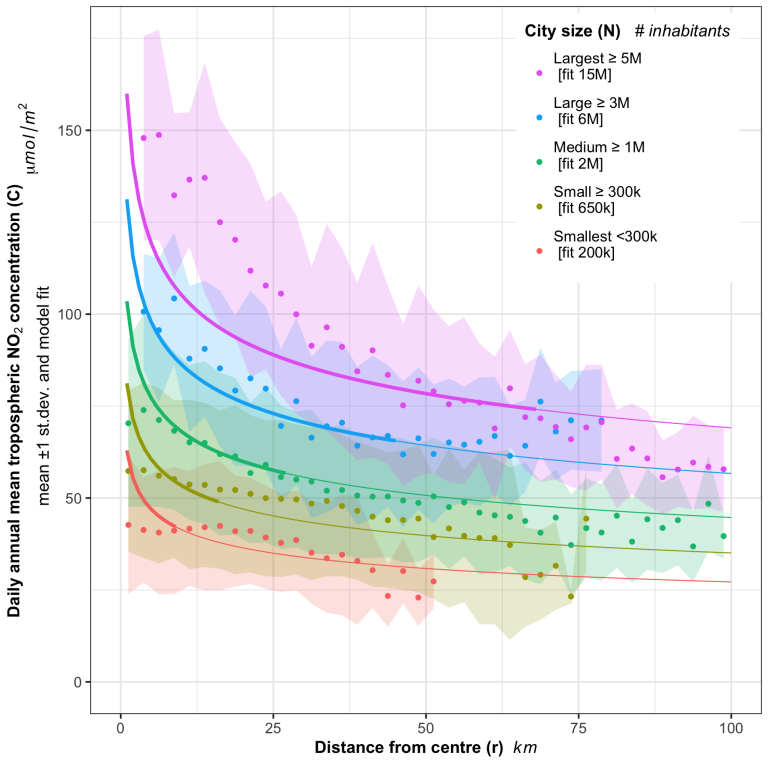
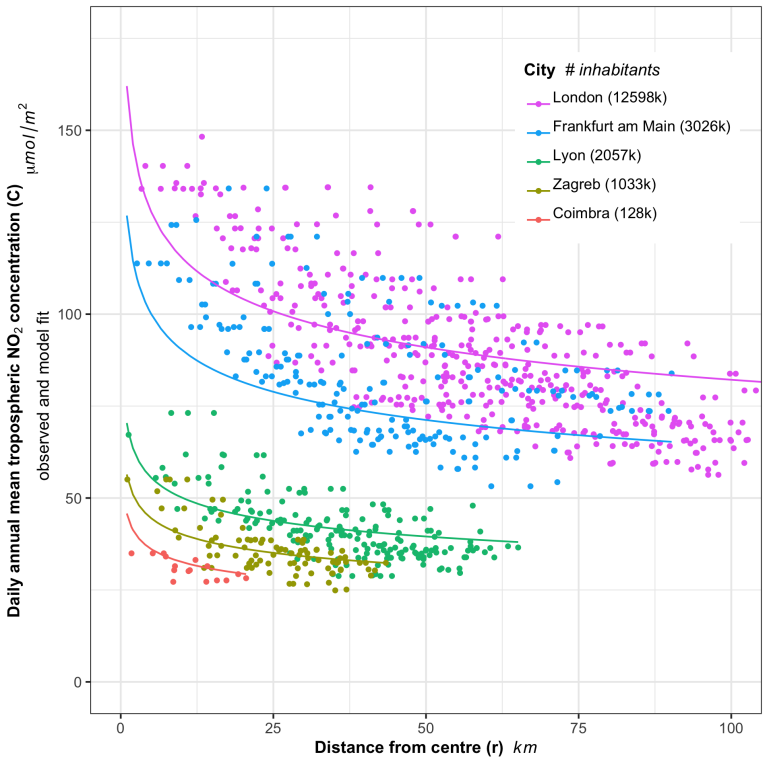
Understanding how nitrogen dioxide (NO2) varies both within and across cities is essential for assessing urban health inequalities, yet the joint influence of city size and internal structure remains poorly quantified. While it is expected that agglomeration size increases NO2 concentrations and that distance from major urban activities reduces them, the magnitude and form of their combined effect have not been established. Our objective is to move beyond city-specific local context effects and to characterize the general structural form of NO2 distributions, understood as their systematic variation with distance from the center across cities of different sizes. Using both ground monitoring stations and satellite data for 378 European Functional Urban Areas, we estimate parallel models for each measurement type and show that the same structural relationships hold in both cases. We find that NO2 concentrations increase with population size as a power law (with an exponent between 0.14 and 0.22) and decrease with distance from the city center (with an exponent between -0.12 and -0.18), with consistent results across measurement types and robust to local and regional controls. These effects combine into a scalable radial profile, where the total air pollution over a city is proportional to (N/r)^0.16, which generalizes the spatial distribution of NO2 in European cities. This formulation clarifies how total and per-capita pollution depend on the extent to which pollution is integrated and provides a simple framework for evaluating the health implications of urban growth.
Editorial analysis
A structured set of objections, weighed in public.
Referee Report
Summary. The paper analyzes NO2 concentrations across 378 European Functional Urban Areas using both ground monitoring stations and satellite data. It reports power-law scaling of NO2 with city population size (exponent 0.14–0.22) and with distance from the city center (exponent –0.12 to –0.18), with consistent results across data types and after local/regional controls. These relations are combined arithmetically into a claimed generalizable radial profile in which total pollution scales as (N/r)^0.16.
Significance. If the combined (N/r)^0.16 form is shown to be robust to boundary and center definitions, the result would supply a compact, cross-city framework for urban air-pollution scaling that links total and per-capita exposure to city size and internal structure. The use of parallel models on two independent datasets with controls is a clear methodological strength.
major comments (3)
- [Abstract] Abstract: the headline claim that the two effects 'combine into a scalable radial profile' proportional to (N/r)^0.16 is obtained by direct arithmetic combination of the separately fitted exponents; no independent test or out-of-sample validation of the combined functional form is reported, so the generalization reduces to a restatement of the fitted parameters rather than an additional prediction.
- [Methods/Results] Methods/Results: no sensitivity analysis is described for the choice of Functional Urban Area boundaries or for the definition of the city center used to compute distance r. Because the central claim is that the (N/r)^0.16 profile generalizes the spatial distribution of NO2, robustness to these definitional choices is load-bearing and must be demonstrated.
- [Results] Results: while the parallel estimation on two data sources is a strength, the reported models supply no information on functional-form specification tests, error-structure assumptions, or heterogeneity of the exponents across the 378 FUAs, leaving the uniformity of the 0.16 combined exponent only partially supported.
minor comments (2)
- [Abstract] The exact procedure used to arrive at the rounded value 0.16 (simple average, weighted average, etc.) should be stated explicitly in the text.
- Figure captions and table notes should indicate whether the plotted or tabulated relations are marginal effects after the full set of controls.
Simulated Author's Rebuttal
We thank the referee for the detailed and constructive report. The comments correctly identify points where the manuscript's claims can be clarified or strengthened through additional analysis and textual revisions. We address each major comment below and indicate the planned changes.
read point-by-point responses
-
Referee: [Abstract] the headline claim that the two effects 'combine into a scalable radial profile' proportional to (N/r)^0.16 is obtained by direct arithmetic combination of the separately fitted exponents; no independent test or out-of-sample validation of the combined functional form is reported
Authors: We agree that the (N/r)^0.16 expression is derived arithmetically from the two separately estimated exponents rather than being fitted as a single model or validated out-of-sample. This is presented as a compact summary of the joint scaling rather than an independent prediction. In revision we will modify the abstract and add a clarifying sentence in the discussion to state explicitly that the form is obtained by combining the fitted exponents, and we will note the absence of direct validation of the combined expression as a limitation. revision: partial
-
Referee: [Methods/Results] no sensitivity analysis is described for the choice of Functional Urban Area boundaries or for the definition of the city center used to compute distance r
Authors: The referee correctly notes that robustness to boundary and center definitions is central to the generalizability claim. We will add a dedicated sensitivity subsection that re-estimates the models using (i) alternative urban-area delineations (e.g., Eurostat core-city boundaries and a 10 km buffer) and (ii) alternative center definitions (geometric centroid versus location of the primary monitoring station or largest employment cluster). Results will be reported in a new table or appendix. revision: yes
-
Referee: [Results] while the parallel estimation on two data sources is a strength, the reported models supply no information on functional-form specification tests, error-structure assumptions, or heterogeneity of the exponents across the 378 FUAs
Authors: The models are estimated as log-log OLS regressions; we report coefficient standard errors and R-squared values but did not conduct formal specification tests (e.g., RESET) or examine city-by-city heterogeneity. In revision we will add a short paragraph discussing the maintained assumptions (power-law form motivated by prior urban-scaling literature, homoscedasticity after log transformation) and will report the range and inter-quartile variation of city-specific exponent estimates where sample size permits. Full heterogeneity analysis for all 378 FUAs is limited by sparse monitoring data in smaller cities, but the consistency across the two independent datasets already provides indirect support for uniformity. revision: partial
Circularity Check
No significant circularity; empirical fits are independent of the combined form
full rationale
The paper estimates separate power-law exponents for population size (0.14-0.22) and distance (-0.12 to -0.18) from regressions on ground and satellite NO2 data across 378 FUAs, then notes their approximate equality to present a combined (N/r)^0.16 descriptive profile. This combination is a post-estimation summary of independently fitted parameters rather than a self-definitional reduction, fitted-input prediction, or self-citation chain. No equations reduce by construction to inputs, no uniqueness theorems are invoked, and the central result remains falsifiable against the underlying data and controls. The derivation chain is self-contained empirical modeling.
Axiom & Free-Parameter Ledger
free parameters (3)
- population-size exponent
- distance-from-center exponent
- combined scaling exponent
axioms (2)
- domain assumption Power-law functional form adequately captures the dependence of NO2 on population size and on distance from center.
- domain assumption The same structural relationships hold across ground-station and satellite measurements after local and regional controls.
Reference graph
Works this paper leans on
-
[1]
doi: 10.1068/b3805ed. Matthew J. Bechle, Dylan B. Millet, and Julian D. Marshall. Effects of income and urban form on urban NO2: Global evidence from satellites.Environmental Science & Technology, 45(11):4914–4919,
-
[2]
S Beirle, U Platt, Mr Wenig, and T Wagner
doi: 10.1021/es103866b. S Beirle, U Platt, Mr Wenig, and T Wagner. Weekly cycle of no 2 by gome measurements: a signature of anthropogenic sources.Atmospheric Chemistry and Physics, 3(6):2225–2232,
-
[3]
Rainald Borck and Philipp Schrauth
doi: 10.1029/2006JD007277. Rainald Borck and Philipp Schrauth. Population density and urban air quality.Regional Science and Urban Economics, 86:103596,
-
[4]
doi: 10.1016/j.regsciurbeco.2020.103596
ISSN 0166-0462. doi: 10.1016/j.regsciurbeco.2020.103596. MartinBranisandMartinaLinhartova. Associationbetweenunemployment, income, educationlevel, population size and air pollution in Czech cities: Evidence for environmental inequality? A pilot national scale analysis. Health Place, 18(5):1110–1114,
-
[5]
Clémentine Cottineau, Olivier Finance, Erez Hatna, Elsa Arcaute, and Michael Batty
doi: 10.1016/j.healthplace.2012.04.011. Clémentine Cottineau, Olivier Finance, Erez Hatna, Elsa Arcaute, and Michael Batty. Defining urban clusters to detect agglomeration economies.Environment and Planning B: Urban Analytics and City Science, 46(9): 1611–1626,
-
[6]
doi: 10.1177/2399808318755146. Clémentine Cottineau, Michael Batty, Itzhak Benenson, Justin Delloye, Erez Hatna, Denise Pumain, Somwrita Sarkar, Cécile Tannier, and R¯ uta Ubarevičien˙ e. The role of analytical models and their circulation in urban studies and policy.Urban Studies, 0(0):00420980241237410,
-
[7]
URL https://doi.org/10.1177/00420980241237410
doi: 10.1177/00420980241237410. URL https://doi.org/10.1177/00420980241237410. Yuanzheng Cui, Lei Jiang, Weishi Zhang, Haijun Bao, Bin Geng, Qingqing He, Long Zhang, and David G. Streets. Evaluation of china’s environmental pressures based on satellite no2 observation and the extended 17 stirpat model.International Journal of Environmental Research and Pu...
-
[8]
doi: 10.1038/s44284-023-00019-z
ISSN 2731-9997. doi: 10.1038/s44284-023-00019-z. URL https://doi.org/10.1038/s44284-023-00019-z. ESA. SNAP download,
-
[9]
EEA, Copenhagen,
European Environment Agency.Air Quality in Europe — 2016 Report. EEA, Copenhagen,
2016
-
[10]
Cheng-Yu Han, Zhao-Lin Gu, and Hexiang Yang
doi: 10.1289/ehp.1408882. Cheng-Yu Han, Zhao-Lin Gu, and Hexiang Yang. Investigate the effects of industrial agglomeration on nitrogen dioxide pollution using spatial panel durbin and panel threshold models.Frontiers in Environmental Science, 10,
-
[11]
doi: 10.3389/fenvs.2022.844479. P.D. Hien, N.T. Men, P.M. Tan, and M. Hangartner. Impact of urban expansion on the air pollution landscape: A case study of hanoi, vietnam.Science of The Total Environment, 702:134635,
-
[12]
doi: 10.1016/j.scitotenv.2019.134635
ISSN 0048-9697. doi: 10.1016/j.scitotenv.2019.134635. J.G. Irwin and M.L. Williams. Acid rain: Chemistry and transport.Environmental Pollution, 50(1):29–59,
-
[13]
Toxic Substance in the Environment
doi: 10.1016/0269-7491(88)90184-4. Toxic Substance in the Environment. Tamara Iungman, Sasha Khomenko, Evelise Pereira Barboza, Marta Cirach, Karen Gonçalves, Paula Petrone, Thilo Erbertseder, Hannes Taubenböck, Tirthankar Chakraborty, and Mark Nieuwenhuijsen. The impact of urban configuration types on urban heat islands, air pollution, co2 emissions, and...
-
[14]
doi: 10.1007/978-94-011-5127-6_
-
[15]
Gaëtan Laziou, Rémi Lemoy, and Marion Le Texier
doi: 10.1021/es400744g. Gaëtan Laziou, Rémi Lemoy, and Marion Le Texier. Radial analysis and scaling of housing prices in french urban areas.Environment and Planning B: Urban Analytics and City Science, page 23998083241281890,
-
[16]
Rémi Lemoy and Geoffrey Caruso
doi: 10.1038/s41598-021-01477-y. Rémi Lemoy and Geoffrey Caruso. Evidence for the homothetic scaling of urban forms.Environment and Planning B: Urban Analytics and City Science, 47(5):870–888,
-
[17]
doi: 10.1177/2399808318810532. Rémi Louf and Marc Barthelemy. Scaling: Lost in the smog.Environment and Planning B: Planning and Design, 41(5):767–769,
-
[18]
doi: 10.1068/b4105c. G. Lövblad, F. Palmgren, R. van Aalst, I. Allegrini, R. Bauman, A. Derouane, L. Edwards, I. Fiala, A. Hauer, M. Hawkins, T. Lahtinen, R. van Leeuwen, M. Nilsson, V. Pohjola, E. De Saeger, and F. de Santis. Position paper on air quality: Nitrogen dioxide. Technical report, European Commission,
-
[19]
OECD & European Commission.Cities in the World: A New Perspective on Urbanisation
doi: 10.1016/0957-1272(91)90014-6. OECD & European Commission.Cities in the World: A New Perspective on Urbanisation. OECD Publishing, Paris, 6
-
[20]
Spiru Paraschiv, Daniel-Eduard Constantin, Simona-Lizica Paraschiv, and Mirela Voiculescu. Omi and ground- based in-situ tropospheric nitrogen dioxide observations over several important european cities during 2005– 2014.International Journal of Environmental Research and Public Health, 14(11),
2005
-
[21]
doi: 10.1016/10. 3390/ijerph14111415. Fabiano L. Ribeiro and Diego Rybski. Mathematical models to explain the origin of urban scaling laws.Physics Reports, 1012:1–39,
-
[22]
doi: https://doi.org/10.1016/j.physrep.2023.02.002
ISSN 0370-1573. doi: https://doi.org/10.1016/j.physrep.2023.02.002. Mathematical models to explain the origin of urban scaling laws. Carlos Román-Cascón, Carlos Yagüe, Pablo Ortiz-Corral, Encarna Serrano, Beatriz Sánchez, Mariano Sastre, Gregorio Maqueda, Elizabeth Alonso-Blanco, Begoña Artiñano, FJ Gómez-Moreno, et al. Wind and turbu- lence relationship ...
-
[23]
20 Mirjam Schindler, Geoffrey Caruso, and Pierre Picard
doi: 10.1177/0265813516638340. 20 Mirjam Schindler, Geoffrey Caruso, and Pierre Picard. Equilibrium and first-best city with endogenous exposure to local air pollution from traffic.Regional Science and Urban Economics, 62:12–23,
-
[25]
Julie Wallace and Pavlos Kanaroglou
doi: 10.1515/mgr-2015-0015. Julie Wallace and Pavlos Kanaroglou. The sensitivity of omi-derived nitrogen dioxide to boundary layer tem- perature inversions.Atmospheric Environment, 43(22):3596–3604,
-
[27]
doi: 10.1016/j.jphotochem.2021.113319
ISSN 1010-6030. doi: 10.1016/j.jphotochem.2021.113319. Yuzhou Wang, Matthew J. Bechle, Sun-Young Kim, Peter J. Adams, Spyros N. Pandis, C. Arden Pope, Allen L. Robinson, Lianne Sheppard, Adam A. Szpiro, and Julian D. Marshall. Spatial decomposition analysis of no2 and pm2.5 air pollution in the united states.Atmospheric Environment, 241:117470,
-
[28]
ejpoleco.2025.102749 Farzanegan, M.R., Gutmann, J.,
doi: 10.1016/j. atmosenv.2020.117470. Yufei Wei.On centrality and population size effects in urban pollution: A meta-analysis of NO2 and heat islands and spatial analysis of NO2. Phd thesis, University of Luxembourg, Esch-sur-Alzette, Luxembourg,
work page doi:10.1016/j 2020
-
[29]
doi: 10.1080/10408444.2019.1576587. 21 SUPPLEMENTARY MATERIAL This is supplementary information related to the article entitled Population size and centrality effects on NO2 air pollution across and within European cities 1 S1 Population and NO 2 background (Cmin) Figure S1: Plot of NO2 backgroundlog 10(Cmin)from vertical column inlog 10(µmol/m2)against p...
discussion (0)
Sign in with ORCID, Apple, or X to comment. Anyone can read and Pith papers without signing in.