CrossAlpha: An Annual-Report Benchmark for Cross-Market Factor Researc (with LLM Agents)
Pith reviewed 2026-06-29 05:55 UTC · model grok-4.3
The pith
Cross-market annual-report similarities predict returns better than domestic or industry peers.
A machine-rendered reading of the paper's core claim, the machinery that carries it, and where it could break.
Core claim
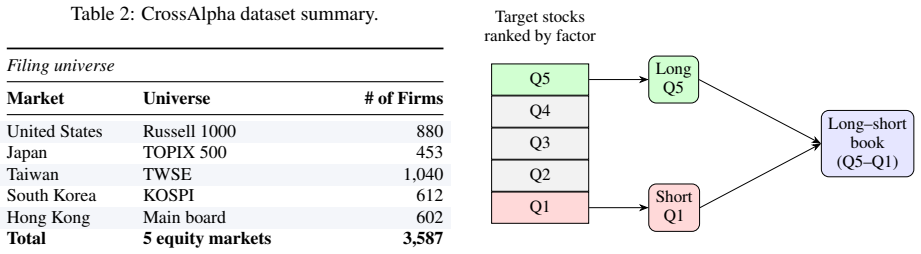
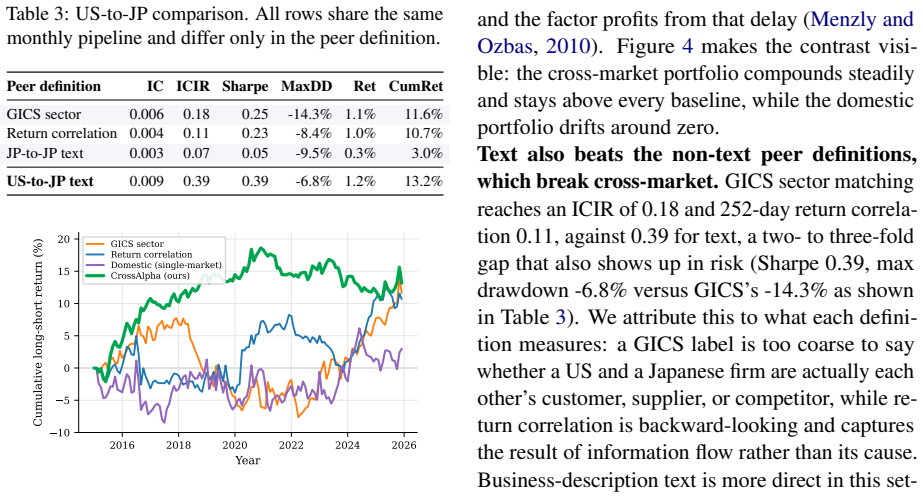
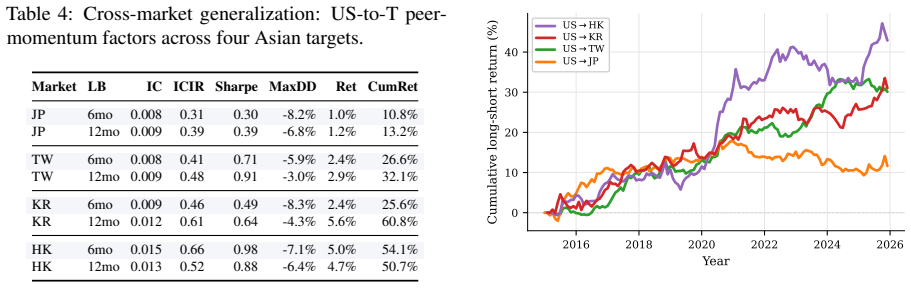
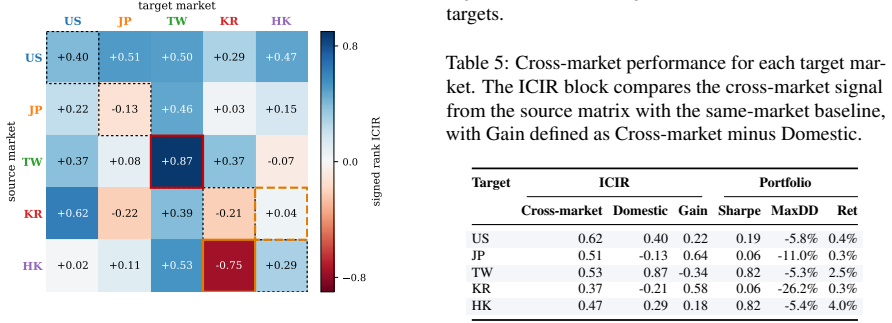
Disclosure-derived cross-market peers outperform domestic text, industry-code, and return-correlation peers in the US-to-Japan setting with an ICIR of 0.39 versus 0.07 to 0.18, and cross-market sources beat the domestic text baseline in most target markets. The benchmark supplies standardized descriptions, 19 million pair scores and timing-aligned return labels for about 3600 firms across five markets.
What carries the argument
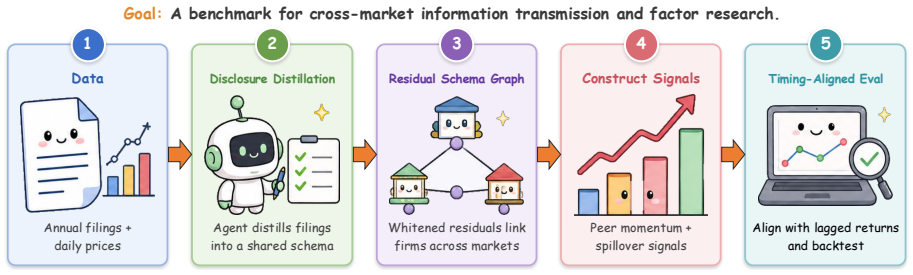
Disclosure Distillation that uses LLM agents to standardise heterogeneous annual filings into ten-category English business descriptions, combined with Residual Schema Graph Construction that produces PCA-whitened cross-market firm-pair scores.
If this is right
- Investment strategies can select cross-border peers using disclosure similarities rather than local industry or return data.
- Factor research gains a public, return-grounded testbed that accounts for language and regulatory differences.
- Cross-market signals appear usable under feasible execution timing across the studied markets.
- Open release of 19M pair scores enables replication and extension by other researchers.
Where Pith is reading between the lines
- If the LLM standardization preserves signal across more languages, the approach could extend to additional emerging markets.
- Combining these cross-market scores with existing domestic factors might produce hybrid predictors with higher overall strength.
- Testing the same pipeline on quarterly reports or earnings calls could reveal whether higher-frequency disclosures add incremental cross-market value.
Load-bearing premise
The Disclosure Distillation step using LLMs produces standardized English descriptions that preserve predictive cross-market signal without introducing new bias from the model or the ten-category schema choice.
What would settle it
Running the US-to-Japan peer selection experiment after replacing the LLM distillation with a different model or a non-LLM method and observing that the ICIR advantage over baselines falls below 0.2 or disappears.
Figures
read the original abstract
Cross-market factor research studies whether firm-level signals from one or more markets can predict returns in a target market, but existing public benchmarks do not support cross-market disclosure-to-return evaluation. Building such a benchmark is challenging because filings differ across languages and regulatory systems, disclosure-derived similarity can be biased by common reporting components, and cross-market signals must be evaluated under feasible trading-time alignment. We introduce \textbf{CrossAlpha}, a public annual-report benchmark for cross-market factor research. CrossAlpha addresses these challenges through three corresponding components: \emph{Disclosure Distillation}, which standardises heterogeneous filings into ten-category English business descriptions; \emph{Residual Schema Graph Construction}, which builds PCA-whitened cross-market firm-pair scores from schema-level disclosures; and \emph{Timing-Aligned Evaluation}, which pairs the graph with 11 years of daily OHLCV data to construct forward-return labels under feasible cross-market execution protocols. CrossAlpha covers about 3,600 firms and 10,700 firm-year reports from the United States, Japan, Taiwan, South Korea, and Hong Kong, and releases about 19M directed firm-pair scores. In experiments, disclosure-derived cross-market peers outperform domestic text, industry-code, and return-correlation peers in the US-to-Japan setting (ICIR 0.39 versus 0.07--0.18), and cross-market sources beat the domestic text baseline in most target markets. CrossAlpha offers an open-sourced, reusable, return-grounded benchmark for cross-market financial NLP.
Editorial analysis
A structured set of objections, weighed in public.
Referee Report
Summary. The manuscript introduces CrossAlpha, a public benchmark for cross-market factor research based on annual reports from ~3600 firms across the US, Japan, Taiwan, South Korea, and Hong Kong. It consists of three components: LLM-based Disclosure Distillation that converts heterogeneous filings into ten-category English business descriptions; Residual Schema Graph Construction that produces PCA-whitened cross-market firm-pair similarity scores; and Timing-Aligned Evaluation that pairs the graph with 11 years of daily OHLCV data under feasible execution protocols. The central empirical claim is that disclosure-derived cross-market peers outperform domestic text, industry-code, and return-correlation baselines, with US-to-Japan ICIR of 0.39 versus 0.07--0.18 and cross-market sources beating the domestic text baseline in most target markets; the benchmark releases ~19M directed pair scores.
Significance. If the results hold after addressing validation gaps, CrossAlpha would provide a valuable open, return-grounded benchmark for cross-market financial NLP, directly addressing language, regulatory, and timing challenges that prior domestic-only resources do not. The release of the full pair scores and use of public filings are clear strengths that support reproducibility.
major comments (2)
- [Disclosure Distillation component (methods)] Disclosure Distillation component: the headline ICIR outperformance (0.39 vs. 0.07--0.18 in US-to-Japan) rests entirely on the ten-category English descriptions produced by the LLM step, yet the manuscript reports no human validation, inter-annotator agreement, or ablation on the fixed schema or model choice. Without such checks it is impossible to rule out that the observed cross-market signal is an artifact of LLM training priors or schema emphasis rather than genuine disclosure content.
- [Experiments] Experiments section: the reported ICIR values for cross-market versus domestic baselines are presented without accompanying statistical significance tests, number of firm-pairs used per market pair, or sensitivity checks to the PCA whitening step, making it difficult to assess whether the 0.39 figure is robust or driven by a small subset of pairs.
minor comments (2)
- [Title] The title contains a typo ('Researc' instead of 'Research').
- [Methods] Notation for the 'Residual Schema Graph' and the exact definition of the ten categories could be clarified with an explicit table or example in the methods.
Simulated Author's Rebuttal
We thank the referee for the constructive comments. We address each major point below, agreeing where the manuscript is incomplete and outlining targeted revisions.
read point-by-point responses
-
Referee: [Disclosure Distillation component (methods)] Disclosure Distillation component: the headline ICIR outperformance (0.39 vs. 0.07--0.18 in US-to-Japan) rests entirely on the ten-category English descriptions produced by the LLM step, yet the manuscript reports no human validation, inter-annotator agreement, or ablation on the fixed schema or model choice. Without such checks it is impossible to rule out that the observed cross-market signal is an artifact of LLM training priors or schema emphasis rather than genuine disclosure content.
Authors: We agree that the absence of human validation, inter-annotator agreement, and ablations on the schema or LLM choice is a limitation. The manuscript's primary validation is the downstream return predictability under timing-aligned protocols, which tests the practical utility of the distilled descriptions for cross-market signals. Nevertheless, to strengthen the work we will add (i) an ablation varying the ten-category schema and LLM model and (ii) a small-scale human evaluation on a random sample of descriptions. These additions will help address concerns about potential artifacts while preserving the benchmark's return-grounded focus. revision: partial
-
Referee: [Experiments] Experiments section: the reported ICIR values for cross-market versus domestic baselines are presented without accompanying statistical significance tests, number of firm-pairs used per market pair, or sensitivity checks to the PCA whitening step, making it difficult to assess whether the 0.39 figure is robust or driven by a small subset of pairs.
Authors: The referee is correct that the experiments lack statistical significance tests, exact pair counts, and PCA sensitivity checks. In the revised manuscript we will report (i) bootstrap or permutation tests for ICIR differences, (ii) the precise number of firm-pairs underlying each market-pair comparison, and (iii) results with and without the PCA whitening step. These additions will allow readers to evaluate the robustness of the reported 0.39 ICIR. revision: yes
Circularity Check
No significant circularity; benchmark is return-grounded from external data
full rationale
The paper's derivation chain constructs CrossAlpha from public annual reports via Disclosure Distillation into ten-category English descriptions, builds PCA-whitened firm-pair scores, and evaluates on 11 years of independent daily OHLCV return data under timing-aligned protocols. The headline result (US-to-Japan ICIR 0.39 vs. 0.07-0.18) is an empirical comparison of disclosure-derived peers against domestic text, industry-code, and return-correlation baselines on forward returns. No equations or steps reduce by construction to fitted inputs, self-definitions, or self-citations; the evaluation target (returns) lies outside the construction pipeline. The benchmark is therefore self-contained against external benchmarks.
Axiom & Free-Parameter Ledger
free parameters (2)
- ten-category schema
- PCA whitening step
axioms (1)
- domain assumption Filings from different markets can be mapped to a common English 10-category schema while preserving cross-market predictive signal
Reference graph
Works this paper leans on
-
[1]
Christian Breitung and Sebastian Mueller
International stock return comovements.The Journal of Finance, 64(6):2591–2626. Christian Breitung and Sebastian Mueller. 2025. Global business networks.Journal of Financial Economics, 166:104007. Maryam Bukhari, Muazzam Maqsood, and Asma Sat- tar. 2025. A novel inter-intra graph neural networks for stock price forecasting modeling cross-border relationsh...
-
[2]
Cross-Stock Predictability via LLM-Augmented Semantic Networks
Correlations in price changes and volatility across international stock markets.The Review of Financial Studies, 3(2):281–307. Campbell R. Harvey, Yan Liu, and Heqing Zhu. 2016. . . . and the cross-section of expected returns.The Review of Financial Studies, 29(1):5–68. Bernard Herskovic. 2018. Networks in production: As- set pricing implications.The Jour...
work page internal anchor Pith review Pith/arXiv arXiv 2016
-
[3]
Optimal whitening and decorrelation.The American Statistician, 72(4):309–314. Alex G. Kim, Maximilian Muhn, and Valeri V . Niko- laev. 2024. Financial statement analysis with large language models.arXiv preprint arXiv:2407.17866. Raehyun Kim, Chan Ho So, Minbyul Jeong, Sanghoon Lee, Jinkyu Kim, and Jaewoo Kang. 2019. HATS: A hierarchical graph attention n...
-
[4]
Nils Reimers and Iryna Gurevych
International stock return predictability: What is the role of the united states?The Journal of Fi- nance, 68(4):1633–1662. Nils Reimers and Iryna Gurevych. 2019. Sentence- BERT: Sentence embeddings using siamese BERT- networks. InProceedings of the 2019 Conference on Empirical Methods in Natural Language Process- ing and the 9th International Joint Confe...
2019
-
[5]
Whitening sentence representations for bet- ter semantics and faster retrieval.arXiv preprint arXiv:2103.15316. Takehiro Takayanagi, Hiroki Sakaji, and Kiyoshi Izumi
-
[6]
SETN: Stock embedding enhanced with textual and network information.arXiv preprint arXiv:2408.02899. Yixuan Tang and Yi Yang. 2025. FinMTEB: Finance massive text embedding benchmark. InProceed- ings of the 2025 Conference on Empirical Methods in Natural Language Processing, pages 3620–3638, Suzhou, China. Association for Computational Lin- guistics. Paul ...
-
[7]
(2)Dense embeddinguses Ope- nAI text-embedding-3-large at $0.13/M tokens; ten category strings per filing at ≈2k to- kens each cost ≈$5 total
(1)Distiller passuses GPT-4.1 at $2 / $8 per million input / output tokens, averaging ≈40k input and ≈2k output tokens per filing, for ≈$0.10 per filing or ≈$1,000 totalacross ≈10,700 filings. (2)Dense embeddinguses Ope- nAI text-embedding-3-large at $0.13/M tokens; ten category strings per filing at ≈2k to- kens each cost ≈$5 total. (3)Linker pass(US →JP...
-
[8]
Output English only, even when the source filing is in another language
-
[9]
Be concise: each field≤80 tokens
-
[10]
Use only facts present in or directly entailed by the filing; do not import outside knowledge
-
[11]
Avoid boilerplate (risk-factor language, forward-looking caveats, generic mission statements)
-
[12]
If a field cannot be inferred from the filing, output null
-
[13]
outsourcing part- ners in Asia
Respond ONLY with a single JSON object; no explanatory text, no markdown. Distiller user message template (ϕD) TICKER: {{ticker}} MARKET: {{market}} FISCAL_YEAR: {{fy}} FILING: {{filing_text}} Return a JSON object with EXACTLY these ten keys (string values, English): 1.main_business_segments 2.core_technologies 3.primary_customers 4.supply_chain_position ...
-
[14]
Combine explicit text mentions in the source 10-K with grounded world knowledge (e.g., a documented major customer relationship reported in the supplier’s own filing)
-
[15]
supplier_side_disclosure
When the 10-K is silent but the relationship is well-attested in the target firm’s public disclosures, mark evidence = "supplier_side_disclosure" and lower the confidence accordingly
-
[16]
Do NOT include US-domestic firms; relations must cross the source/target border
-
[17]
Provide a one-sentencerationalenaming the specific product, segment, or contract that grounds the edge
-
[18]
target_ticker
Respond ONLY with strict JSON. Linker user message template (ϕL) SOURCE_TICKER: {{us_ticker}} SOURCE_FILING (10-K): {{us_10k_text}} TARGET_MARKET: {{market}} TARGET_UNIVERSE (ticker, GICS sector): {{candidate_table}} Return a JSON list. Each element: { "target_ticker": string, "relation_type": "supplier" | "customer" | "partner" | "competitor", "evidence"...
2023
discussion (0)
Sign in with ORCID, Apple, or X to comment. Anyone can read and Pith papers without signing in.