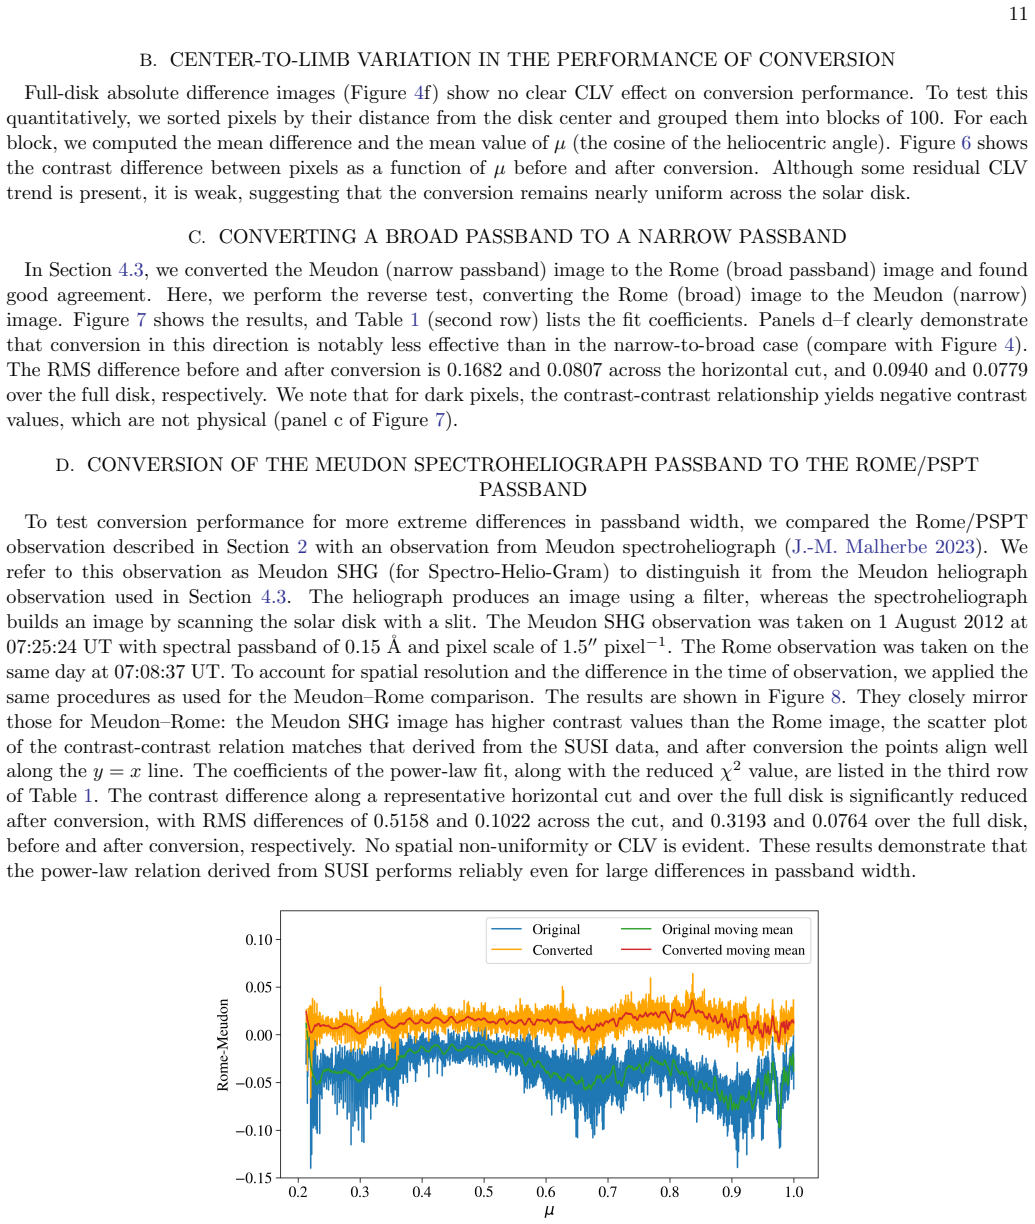
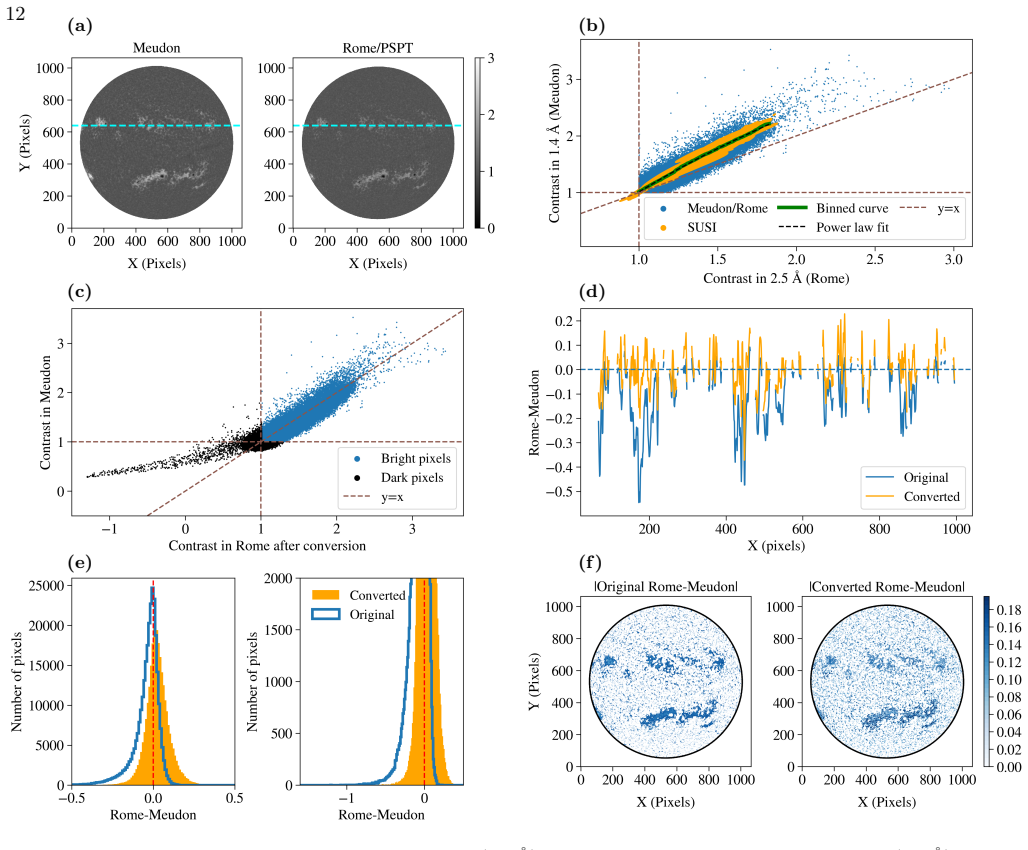
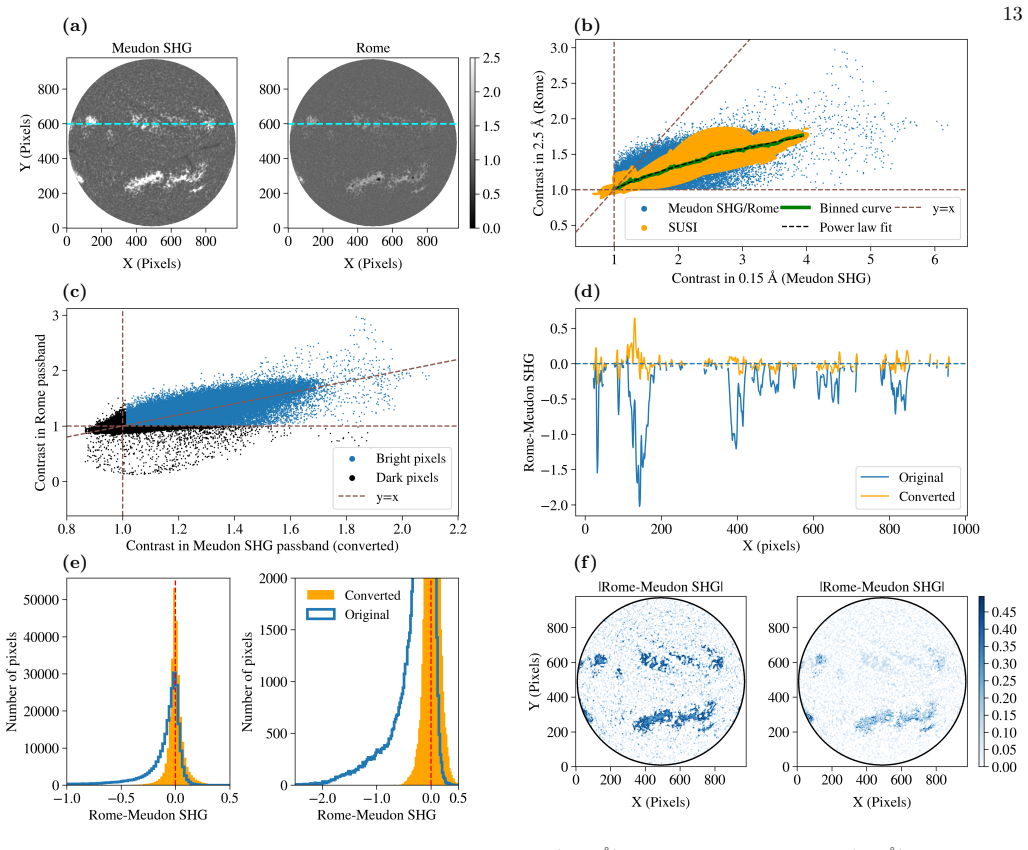
Quantifying the effect of passband on observations in the Ca II K line
Pith reviewed 2026-06-29 05:19 UTC · model grok-4.3
The pith
Contrast values in Ca II K solar images from different passbands follow power-law relationships that enable cross-calibration.
A machine-rendered reading of the paper's core claim, the machinery that carries it, and where it could break.
Core claim
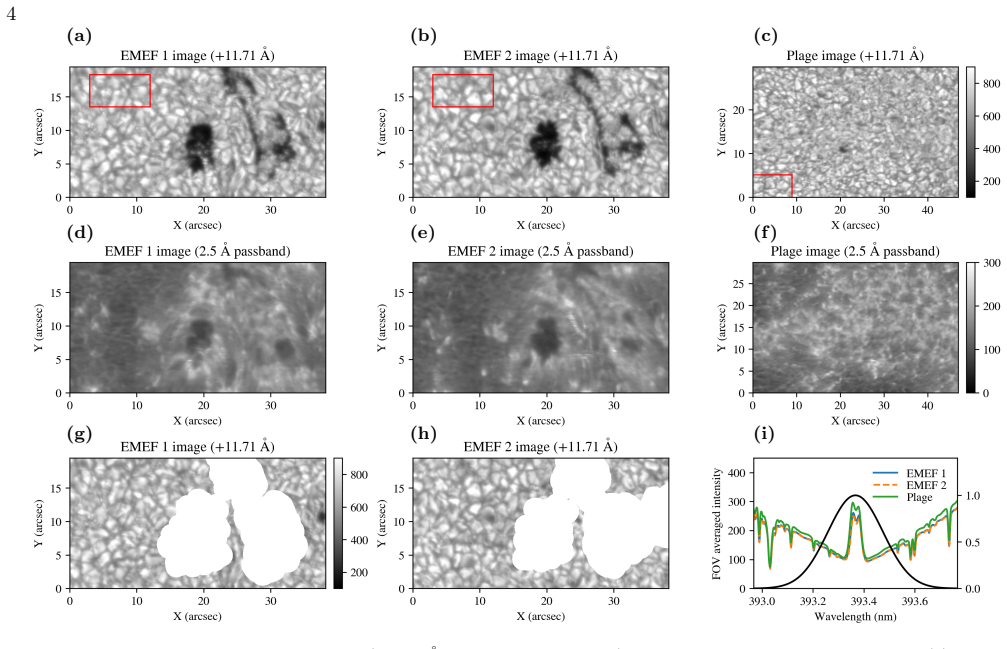
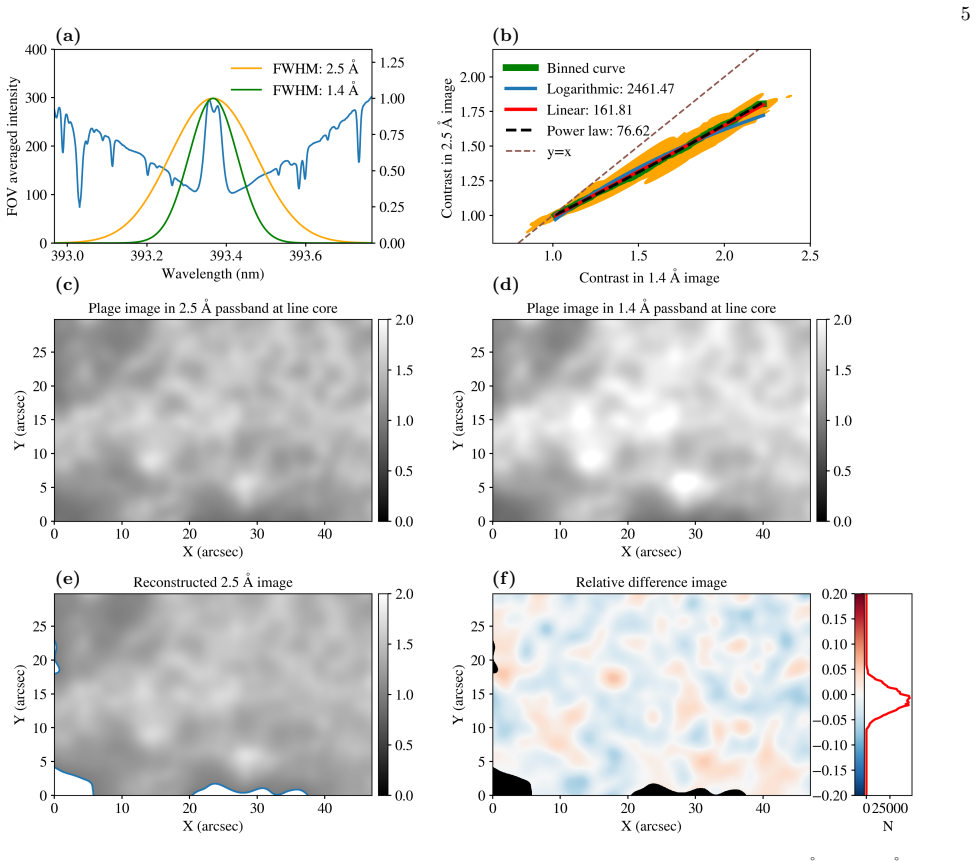
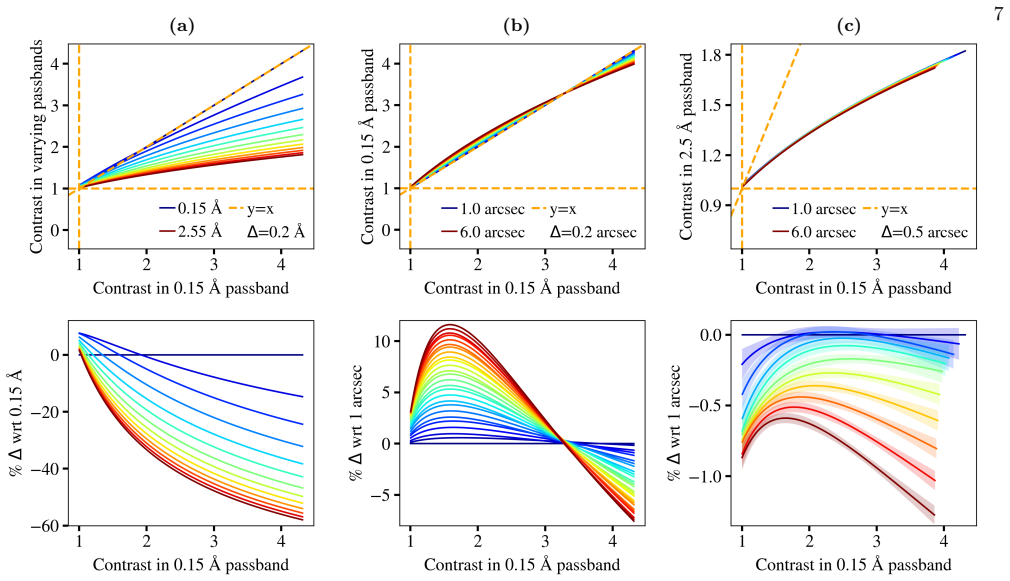
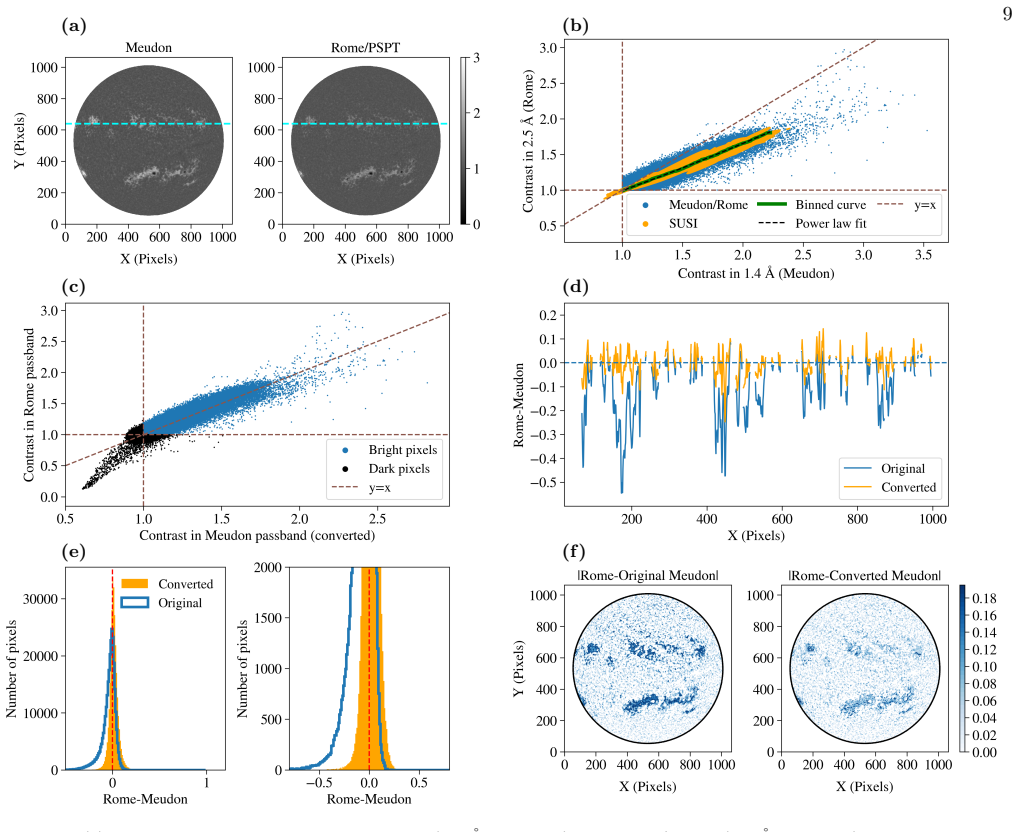
Using high spectral and spatial resolution observations in the Ca II K line from the Sunrise III mission, we emulate observations with different passbands and lower spatial resolutions. We find that the relationships between contrasts measured in these emulated observations are well described by a power law. We provide the coefficients for different combinations of passband widths in the range 0.1--9 Angstroms and spatial resolutions between 1 arcsec and 6 arcsec. Applying such a relationship to observations from two major Ca II K archives demonstrates its potential to improve their cross-calibration.
What carries the argument
Power-law fits to contrast-contrast relationships between emulated Ca II K observations of varying passband and resolution.
If this is right
- Cross-calibration of historical Ca II K archives becomes possible using the provided coefficients.
- Discrepancies between different observatories' records can be reduced.
- A consistent century-long time series of solar activity can be constructed.
- Improvements follow in solar irradiance reconstructions that rely on these records.
- A foundation is laid for combining historical and modern Ca II K observations.
Where Pith is reading between the lines
- These power laws might allow retrospective adjustment of even older photographic plates if their effective passbands can be estimated.
- The approach could be extended to other chromospheric lines to build multi-wavelength composites.
- Future instruments could incorporate these relations for real-time standardization of data products.
- Testing the relations on simulated data with known solar features would verify if they hold across activity cycles.
Load-bearing premise
The high-resolution Sunrise III data can be accurately degraded to match lower passbands and resolutions without introducing biases that alter the power-law relationships.
What would settle it
A direct comparison of contrasts from two archives after applying the power-law correction fails to bring their values into agreement within the uncertainties of the measurements.
Figures
read the original abstract
Full-disk observations of the Sun in the Ca II K line have been carried out since the late 19th century at various observatories worldwide. These long-term records of solar activity are crucial for reducing discrepancies among solar irradiance reconstructions and for advancing our understanding of the solar dynamo. To construct a consistent composite record, data from different observatories must be cross-calibrated to account for variations in spectral passband and spatial resolution, which are the primary sources of discrepancies between archives. In this study, we use high spectral and spatial resolution observations in the Ca II K line from the state-of-the-art Sunrise III mission to emulate different passbands and derive empirical contrast-contrast relationships between them. We find that these relationships are well described by a power law and provide coefficients for different combinations of passband widths in the range 0.1--9 Angstroms and spatial resolutions between 1 arcsec and 6 arcsec. Applying such a relationship to observations from two major Ca II K archives demonstrates its potential to improve their cross-calibration. The results provide a foundation for the construction of a consistent, century-long time series of solar activity from historical and modern Ca II K observations.
Editorial analysis
A structured set of objections, weighed in public.
Referee Report
Summary. The paper uses high spectral and spatial resolution Ca II K observations from the Sunrise III mission to emulate full-disk observations with passband widths of 0.1–9 Å and spatial resolutions of 1–6 arcsec. It reports that contrast–contrast relationships between these emulated datasets are well described by power laws, supplies the corresponding coefficients, and demonstrates application of one such relation to improve cross-calibration between two historical Ca II K archives.
Significance. If the emulation procedure is shown to be unbiased, the empirical power-law coefficients would supply a practical, data-driven tool for homogenizing century-long Ca II K records, directly addressing a known source of uncertainty in solar-irradiance reconstructions. The approach of deriving relations from independent high-resolution spectra rather than from analytic models is a methodological strength.
major comments (3)
- [§3 and §4] §3 (Methods) and §4 (Results): The central power-law coefficients rest on the assumption that passband integration plus spatial degradation of Sunrise III spectra faithfully reproduces the combined effects of real filter transmission curves, instrumental PSF, and stray light present in the historical archives. No quantitative validation—e.g., comparison of emulated contrasts against actual simultaneous observations from an instrument with a documented 1–3 Å passband—is reported, leaving open the possibility of systematic offsets in the fitted exponents.
- [§4 and Table 2] §4 (Results) and Table 2: The manuscript states that the relationships “are well described by a power law” and lists coefficients, yet supplies neither goodness-of-fit metrics (R², reduced χ²), uncertainties on the power-law indices and normalizations, nor the number of independent spatial samples or images entering each fit. Without these quantities the claim that the relations are “well described” cannot be assessed and the tabulated coefficients cannot be used with known precision for cross-calibration.
- [§5] §5 (Application): The demonstration that the derived relation improves cross-calibration between two archives is presented without an independent test set or cross-validation; it is therefore unclear whether the improvement is statistically significant or merely reflects the particular choice of the two archives.
minor comments (2)
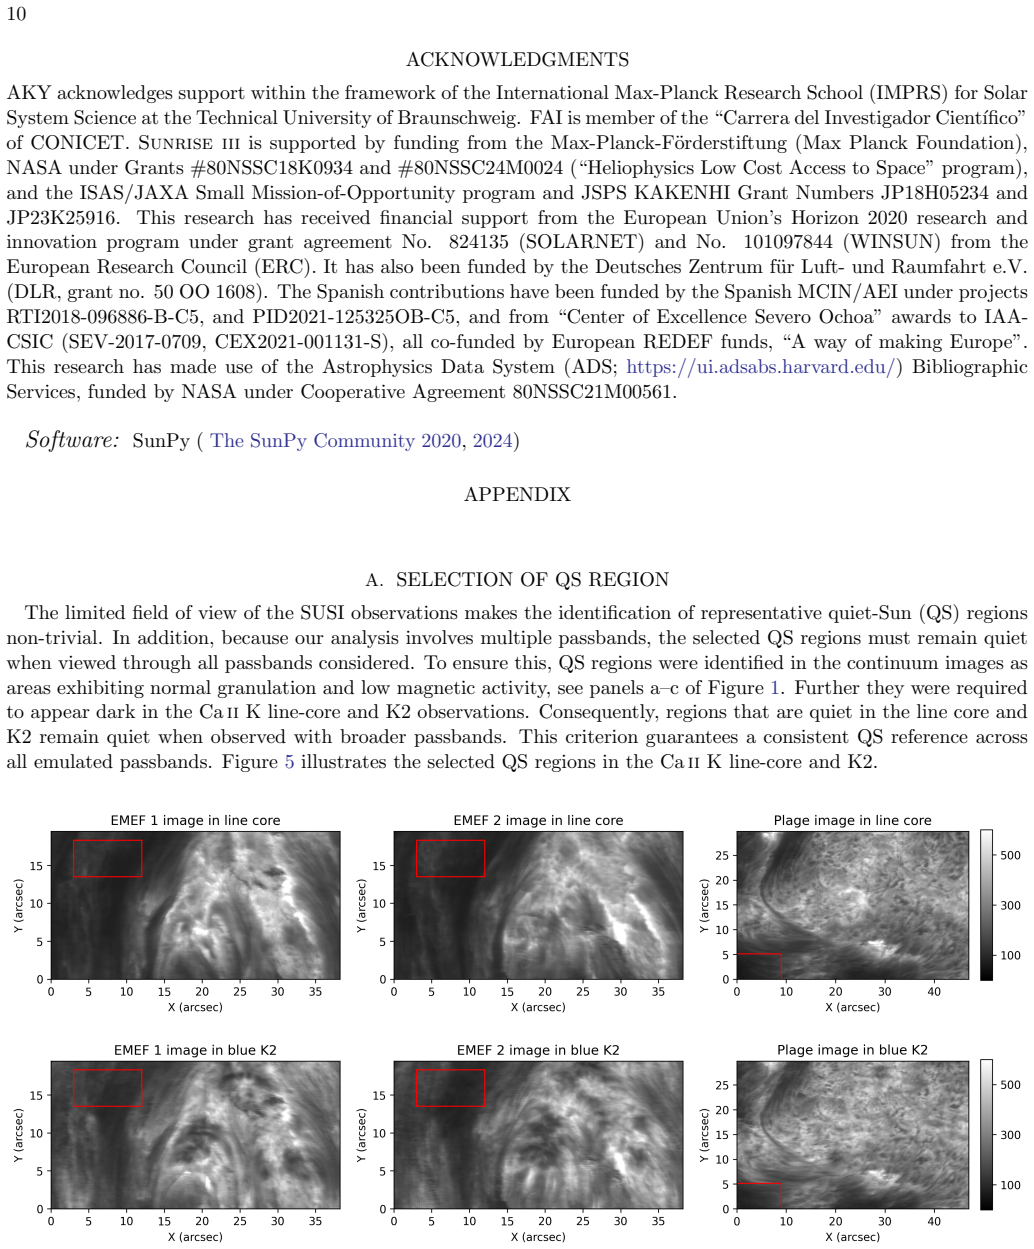
- [Figure 3] Figure 3: Axis labels and color bars should explicitly state the units of contrast (e.g., “relative intensity” or “fractional contrast”) and whether the plotted quantity is disk-center or full-disk averaged.
- [§2] The abstract and §2 cite passband widths in angstroms but do not specify whether the quoted widths are FWHM, equivalent width, or rectangular widths; this should be clarified once in the text.
Simulated Author's Rebuttal
We thank the referee for their constructive comments on our manuscript. We address each major comment below and indicate the revisions made.
read point-by-point responses
-
Referee: [§3 and §4] §3 (Methods) and §4 (Results): The central power-law coefficients rest on the assumption that passband integration plus spatial degradation of Sunrise III spectra faithfully reproduces the combined effects of real filter transmission curves, instrumental PSF, and stray light present in the historical archives. No quantitative validation—e.g., comparison of emulated contrasts against actual simultaneous observations from an instrument with a documented 1–3 Å passband—is reported, leaving open the possibility of systematic offsets in the fitted exponents.
Authors: We agree that direct quantitative validation against simultaneous multi-passband observations would be the strongest test. No such independent datasets with matching characteristics are available in the literature. Our emulation follows standard convolution-based procedures used in prior solar imaging studies. In the revised manuscript we have expanded the discussion in §3 to explicitly list the assumptions, note the absence of stray-light and exact filter-curve data, and quantify the expected impact of these simplifications on the derived exponents. revision: partial
-
Referee: [§4 and Table 2] §4 (Results) and Table 2: The manuscript states that the relationships “are well described by a power law” and lists coefficients, yet supplies neither goodness-of-fit metrics (R², reduced χ²), uncertainties on the power-law indices and normalizations, nor the number of independent spatial samples or images entering each fit. Without these quantities the claim that the relations are “well described” cannot be assessed and the tabulated coefficients cannot be used with known precision for cross-calibration.
Authors: We accept this criticism. The revised Table 2 now reports, for every fit, the number of independent spatial samples, the coefficient of determination R², and 1-σ uncertainties on both the power-law index and normalization. A short paragraph in §4 describes the fitting method and the criteria used to judge that a power law is appropriate. revision: yes
-
Referee: [§5] §5 (Application): The demonstration that the derived relation improves cross-calibration between two archives is presented without an independent test set or cross-validation; it is therefore unclear whether the improvement is statistically significant or merely reflects the particular choice of the two archives.
Authors: Section §5 was intended as an illustrative proof-of-concept rather than a formal validation. We have revised the text to state this scope explicitly and have added a sentence recommending that future studies perform cross-validation on additional independent archives. No further statistical test on the existing pair of archives is possible without introducing circularity. revision: partial
Circularity Check
No circularity: empirical power-law fits derived from independent Sunrise III emulations
full rationale
The derivation chain consists of taking high-resolution Sunrise III spectra, integrating them over chosen passbands, spatially degrading the images, measuring contrasts, and fitting power-law coefficients to those contrasts. These steps are data-driven and do not reduce to any self-referential definition, prior fitted parameter renamed as prediction, or self-citation chain. The resulting coefficients are then applied to separate archive data; this application is an external use, not a tautology. No equations or sections in the provided text exhibit any of the enumerated circularity patterns. The load-bearing assumption (emulation fidelity) is a methodological limitation, not a circularity issue.
Axiom & Free-Parameter Ledger
axioms (1)
- domain assumption High spectral and spatial resolution observations from Sunrise III can be used to accurately emulate observations with different passbands and spatial resolutions.
Reference graph
Works this paper leans on
-
[1]
W., & Babcock, H
Babcock, H. W., & Babcock, H. D. 1955, ApJ, vol. 121, p. 349, 121, 349
1955
-
[2]
Barthol, P., Gandorfer, A., Solanki, S. K., et al. 2011, SoPh, 268, 1, doi: 10.1007/s11207-010-9662-9
-
[3]
Chatzistergos, T., Ermolli, I., Krivova, N. A., & Solanki, S. K. 2019, A&A, 625, A69, doi: 10.1051/0004-6361/201834402
-
[4]
Chatzistergos, T., Ermolli, I., Solanki, S. K., & Krivova, N. A. 2018, A&A, 609, A92, doi: 10.1051/0004-6361/201731511
-
[5]
Chatzistergos, T., Ermolli, I., Solanki, S. K., et al. 2019, A&A, 626, A114, doi: 10.1051/0004-6361/201935131
-
[6]
Chatzistergos, T., Krivova, N. A., & Ermolli, I. 2022, FrASS, 9, doi: 10.3389/fspas.2022.1038949
-
[7]
Chatzistergos, T., Krivova, N. A., & Ermolli, I. 2024, JSWSC, 14, 9, doi: 10.1051/swsc/2024006
-
[8]
Chatzistergos, T., Krivova, N. A., Ermolli, I., et al. 2021, A&A, 656, A104, doi: 10.1051/0004-6361/202141516
-
[9]
Chatzistergos, T., Krivova, N. A., Solanki, S. K., & Yeo, K. L. 2025, A&A, 696, A204, doi: 10.1051/0004-6361/202554044
-
[10]
Chatzistergos, T., Krivova, N. A., & Yeo, K. L. 2023, JASTP, 252, 106150, doi: 10.1016/j.jastp.2023.106150
-
[11]
Chatzistergos, T., Ermolli, I., Krivova, N. A., et al. 2020, A&A, 639, A88, doi: 10.1051/0004-6361/202037746
-
[12]
Dasi-Espuig, M., Jiang, J., Krivova, N. A., & Solanki, S. K. 2014, A&A, 570, A23, doi: 10.1051/0004-6361/201424290
-
[13]
Dasi-Espuig, M., Jiang, J., Krivova, N. A., et al. 2016, A&A, 590, A63, doi: 10.1051/0004-6361/201527993
-
[14]
2022, FrASS, 9, doi: 10.3389/fspas.2022.1042740
Ermolli, I., Giorgi, F., & Chatzistergos, T. 2022, FrASS, 9, doi: 10.3389/fspas.2022.1042740
-
[15]
Ermolli, I., Solanki, S. K., Tlatov, A. G., et al. 2009, ApJ, 698, 1000, doi: 10.1088/0004-637X/698/2/1000
-
[16]
2013, ACP, 13, 3945, doi: 10.5194/acp-13-3945-2013
Ermolli, I., Matthes, K., Dudok de Wit, T., et al. 2013, ACP, 13, 3945, doi: 10.5194/acp-13-3945-2013
-
[17]
2025, SoPh, 300, 65, doi: 10.1007/s11207-025-02471-7
Feller, A., Gandorfer, A., Grauf, B., et al. 2025, SoPh, 300, 65, doi: 10.1007/s11207-025-02471-7 Fr¨ ohlich, C. 2006, SSRv, 125, 53, doi: 10.1007/s11214-006-9046-5
-
[18]
J., Beer, J., Geller, M., et al
Gray, L. J., Beer, J., Geller, M., et al. 2010, Reviews of Geophysics, 48, RG4001, doi: 10.1029/2009RG000282
-
[19]
Haigh, J. D. 2007, LRSP, 4, 2, doi: 10.12942/lrsp-2007-2
-
[20]
2024, A&A, 683, A48, doi: 10.1051/0004-6361/202245635 H¨ olken, J., Doerr, H
Jiang, J. 2024, A&A, 683, A48, doi: 10.1051/0004-6361/202245635 H¨ olken, J., Doerr, H. P., Feller, A., & Iglesias, F. A. 2024, A&A, 687, A22, doi: 10.1051/0004-6361/202348877
-
[21]
A., Feller, A., Gandorfer, A., et al
Iglesias, F. A., Feller, A., Gandorfer, A., et al. 2025, SoPh, 300, 58, doi: 10.1007/s11207-025-02470-8
-
[22]
2015, ApJ, 806, 174, doi: 10.1088/0004-637X/806/2/174
Jin, C., & Wang, J. 2015, ApJ, 806, 174, doi: 10.1088/0004-637X/806/2/174
-
[23]
2025, LRSP, 22, 1, doi: 10.1007/s41116-025-00040-5
Kopp, G. 2025, LRSP, 22, 1, doi: 10.1007/s41116-025-00040-5
-
[24]
Korpi-Lagg, A., Gandorfer, A., Solanki, S. K., et al. 2025, SoPh, 300, 75, doi: 10.1007/s11207-025-02485-1
-
[25]
C., Pilewskie, P., & Coddington, O
Kren, A. C., Pilewskie, P., & Coddington, O. 2017, JSWSC, 7, A10, doi: 10.1051/swsc/2017007
-
[26]
Krivova, N. A., Solanki, S. K., Fligge, M., & Unruh, Y. C. 2003, A&A, 399, L1, doi: 10.1051/0004-6361:20030029
-
[27]
Loukitcheva, M., Solanki, S. K., & White, S. M. 2009, A&A, 497, 273, doi: 10.1051/0004-6361/200811133
-
[28]
2023, JHA, 54, 274, doi: 10.1177/00218286231184193
Malherbe, J.-M. 2023, JHA, 54, 274, doi: 10.1177/00218286231184193
-
[29]
2023, ApJ, 947, 18, doi: 10.3847/1538-4357/acc529
Murabito, M., Ermolli, I., Chatzistergos, T., et al. 2023, ApJ, 947, 18, doi: 10.3847/1538-4357/acc529
-
[30]
1999, SoPh, 184, 421, doi: 10.1023/A:1017165208013
Neckel, H. 1999, SoPh, 184, 421, doi: 10.1023/A:1017165208013
-
[31]
2016, A&A, 585, A40, doi: 10.1051/0004-6361/201526620
Bertello, L. 2016, A&A, 585, A40, doi: 10.1051/0004-6361/201526620
-
[32]
J., Cote, J., Zwaan, C., & Saar, S
Schrijver, C. J., Cote, J., Zwaan, C., & Saar, S. H. 1989, ApJ, 337, 964, doi: 10.1086/167168
-
[33]
Shapiro, A. I., Solanki, S. K., Krivova, N. A., et al. 2017, NatAs, 1, 612, doi: 10.1038/s41550-017-0217-y
-
[34]
Solanki, S. K., Krivova, N. A., & Haigh, J. D. 2013, ARA&A, 51, 311, doi: 10.1146/annurev-astro-082812-141007
-
[35]
K., Smitha, H
Solanki, S. K., Smitha, H. N., Lagg, A., & et al. 2026,
2026
-
[36]
K., Barthol, P., Danilovic, S., et al
Solanki, S. K., Barthol, P., Danilovic, S., et al. 2010, ApJL, 723, L127, doi: 10.1088/2041-8205/723/2/L127
-
[37]
Solanki, S. K., Riethm¨ uller, T. L., Barthol, P., et al. 2017, ApJS, 229, 2, doi: 10.3847/1538-4365/229/1/2 The SunPy Community. 2020, The Astrophysical Journal, 890, 68, doi: 10.3847/1538-4357/ab4f7a The SunPy Community. 2024, SunPy: v6.0.3, Zenodo, doi: 10.5281/zenodo.13948147
-
[38]
Yeo, K. L., Solanki, S. K., Norris, C. M., et al. 2017, PhRvL, 119, 091102, doi: 10.1103/PhysRevLett.119.091102
discussion (0)
Sign in with ORCID, Apple, or X to comment. Anyone can read and Pith papers without signing in.