Using large scale GPS data to reveal EV driver activity patterns beyond charging sessions
Pith reviewed 2026-06-28 11:26 UTC · model grok-4.3
The pith
EV drivers visit more cafes and restaurants near chargers than non-EV drivers and bundle more activities on charging days.
A machine-rendered reading of the paper's core claim, the machinery that carries it, and where it could break.
Core claim
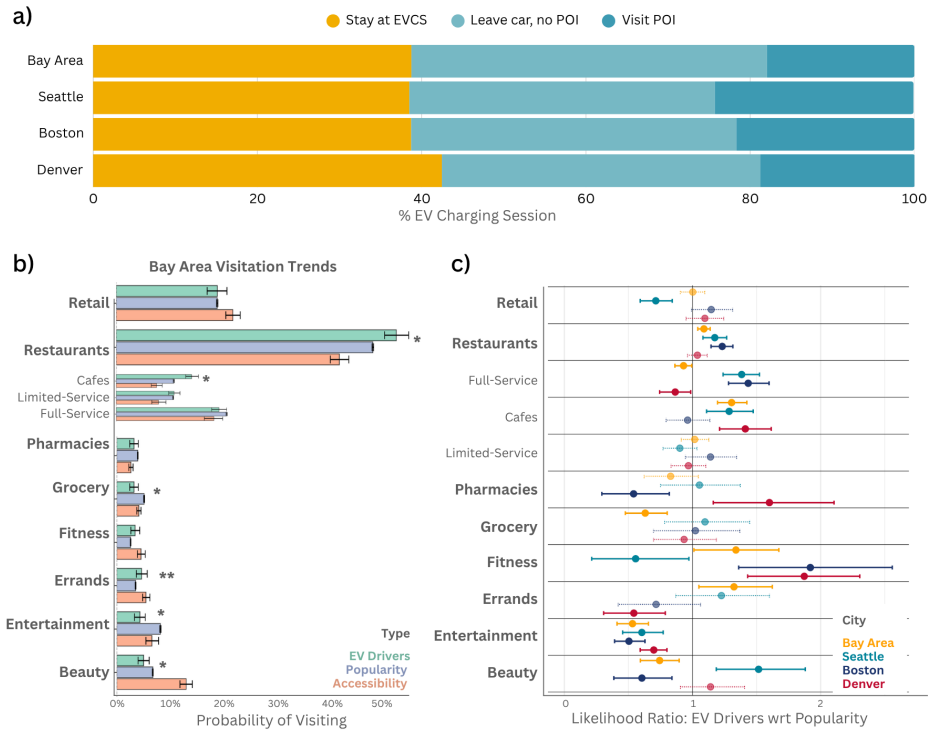
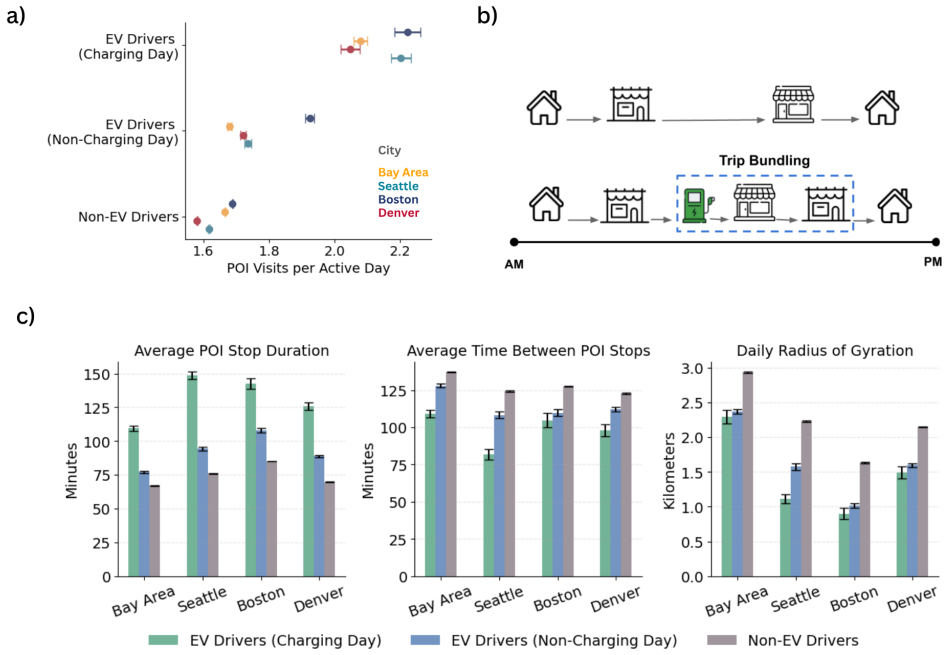
By inferring EV ownership and charging events from mobility traces of over 760,000 drivers in four U.S. metros, the authors reconstruct charging sessions and show that EV drivers exhibit systematically higher visitation rates to nearby cafes and restaurants during charging than non-EV drivers, revealing economic spillover effects, while also displaying trip bundling by visiting more POIs over less time and distance on charging days compared with all other days.
What carries the argument
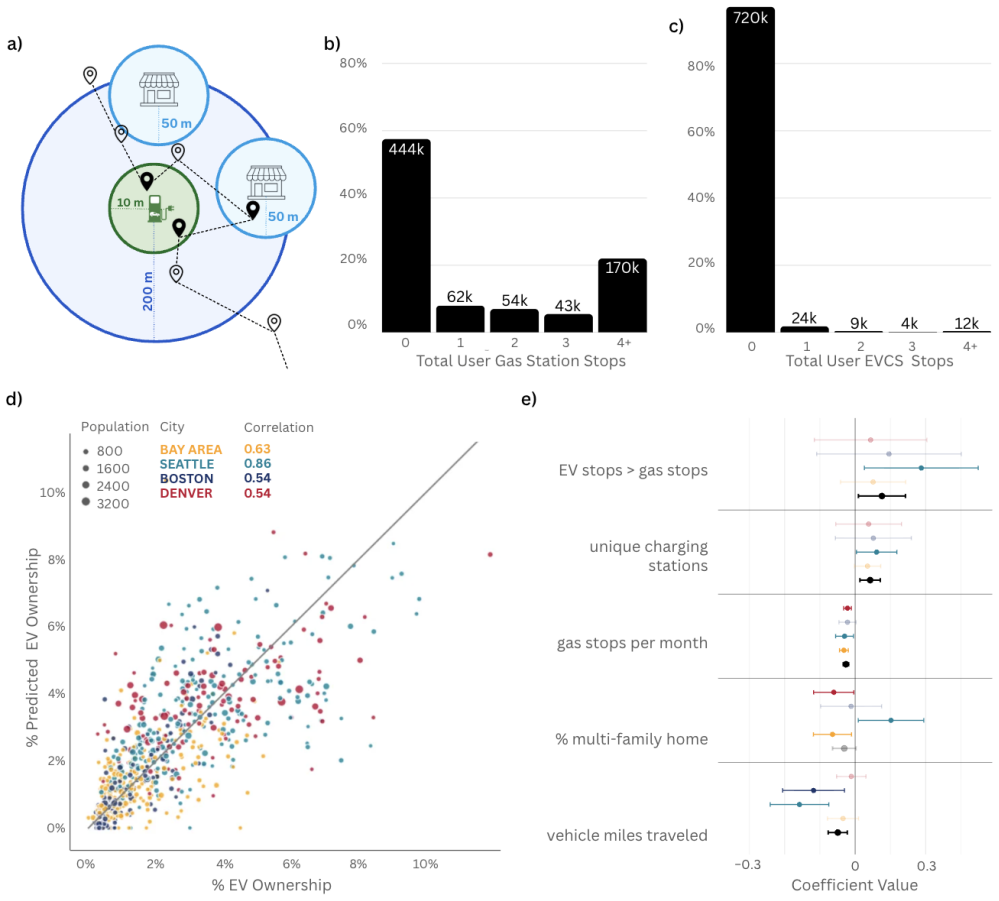
Scalable inference framework that labels likely EV owners from visitation patterns to charging stations and gas stations, visit frequency, and daily travel behavior, then calibrates cohort size to aggregate registration statistics.
If this is right
- Charging infrastructure planning can incorporate expected economic spillovers to nearby cafes and restaurants.
- EV drivers optimize daily schedules by bundling multiple stops around charging events.
- Traditional charger session logs miss the surrounding activity patterns that shape driver needs.
- Co-location of urban amenities with chargers can be guided by observed visitation differences.
Where Pith is reading between the lines
- Cities could test charger placement strategies that deliberately pair chargers with high-traffic eateries to amplify local spending.
- The same inference approach might reveal activity patterns for other vehicle classes or shared mobility services.
- Demand forecasts for electricity grids could factor in the shorter, denser trip chains that occur on charging days.
Load-bearing premise
The labeling rules based on charging station visits, gas station avoidance, visit frequency, and travel behavior correctly identify a group whose size and locations match actual EV owners.
What would settle it
The inferred EV cohort size or zip-code distribution deviates significantly from official registration statistics, or the reconstructed charging patterns fail to align with independent charger-level usage benchmarks.
Figures
read the original abstract
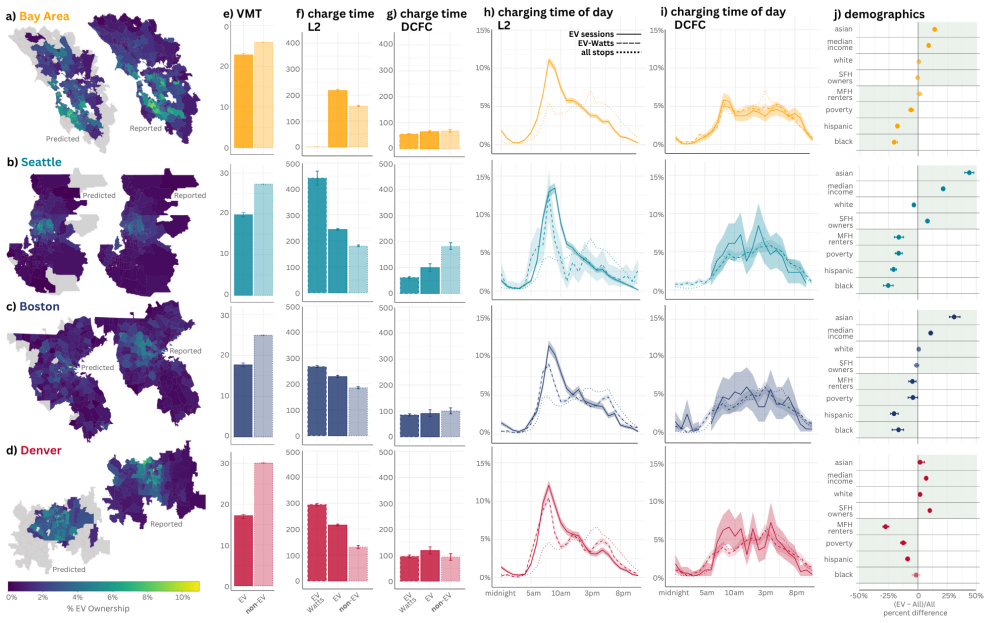
Accurate insights into electric vehicle (EV) driver behavior are essential for long-term infrastructure planning, grid management, and understanding downstream economic impacts, yet individual level data on EV mobility remains limited. Here, we develop a scalable framework to infer EV ownership and charging behavior from passively collected, high-resolution mobility traces covering over 760,000 drivers across four major U.S. metropolitan areas. We identify likely EV drivers based on distinctive visitation patterns to charging stations and gas stations, frequency of visits, and daily travel behavior, and calibrate cohort size using aggregate EV registration statistics. The resulting EV cohort closely matches official registration data at the zip code level and exhibits charging patterns consistent with independent, charger level benchmark datasets, providing external validation of the inferred population. Leveraging this inferred cohort, we reconstruct charging events and associated activity patterns to examine how EV drivers interact with surrounding urban amenities. Compared to non-EV drivers, EV drivers exhibit systematically higher visitation rates to nearby cafes and restaurants during charging sessions, revealing significant economic spillover effects. Furthermore, we find EV drivers exhibit trip bundling behavior, visiting more POIs over less time and distance on days where they charge versus all other days. These patterns are not observable in conventional charging session data, which lack behavioral context beyond the charging event itself. Our results demonstrate the potential of using mobility data to enable a richer, behaviorally grounded understanding of the off-plug needs of EV drivers, providing a foundation for optimizing charging infrastructure deployment and co-locating complementary urban amenities in an increasingly electrified transportation landscape.
Editorial analysis
A structured set of objections, weighed in public.
Referee Report
Summary. The paper develops a scalable framework to infer EV ownership and charging behavior from passively collected GPS mobility traces of over 760,000 drivers in four U.S. metro areas. EV drivers are identified via rule-based labeling on visitation patterns to charging/gas stations, visit frequency, and daily travel behavior; the cohort is calibrated to aggregate registration statistics and validated against charger-level benchmarks. The inferred cohort is then used to reconstruct charging events and analyze associated activity, claiming systematically higher visitation to nearby cafes/restaurants during charging (economic spillovers) and trip bundling (more POIs in less time/distance on charge days vs. non-charge days), patterns not visible in conventional charging data.
Significance. If the cohort inference is robust, the work demonstrates the value of large-scale passive mobility data for revealing off-plug behavioral and economic patterns of EV drivers, with direct relevance to infrastructure planning and amenity co-location. Strengths include the scale of the dataset, calibration to external registration aggregates, and consistency checks against independent charger benchmarks.
major comments (2)
- [Methods (EV cohort inference)] The rule-based labeling of the EV cohort (Methods section on EV driver inference) combines visitation frequency to stations, gas stations, and daily behavior without reported sensitivity tests on thresholds or individual-level ground truth (e.g., confusion matrices or hold-out validation). This is load-bearing for the central claims, as any selection bias toward amenity-oriented drivers would confound the spillover and bundling comparisons to non-EV drivers; aggregate zip-code calibration does not address this at the behavioral level used for the analysis.
- [Results (activity patterns and spillover analysis)] In the results on activity patterns, no quantitative error bars, confidence intervals, or sensitivity to labeling thresholds are reported on the visitation rates or bundling metrics; additionally, details on attribution of post-charging POI visits are absent. These omissions weaken assessment of the statistical robustness of the reported differences.
minor comments (2)
- [Abstract] The abstract states 'over 760,000 drivers' but could specify the exact total and per-metro breakdown for clarity and reproducibility.
- [Figures] Figure captions and axis labels should explicitly define 'charge days' vs. 'non-charge days' and the POI categories used in the bundling analysis.
Simulated Author's Rebuttal
We thank the referee for their detailed and constructive review. We address each major comment below, providing clarifications and committing to revisions that strengthen the robustness of the analysis where feasible.
read point-by-point responses
-
Referee: [Methods (EV cohort inference)] The rule-based labeling of the EV cohort (Methods section on EV driver inference) combines visitation frequency to stations, gas stations, and daily behavior without reported sensitivity tests on thresholds or individual-level ground truth (e.g., confusion matrices or hold-out validation). This is load-bearing for the central claims, as any selection bias toward amenity-oriented drivers would confound the spillover and bundling comparisons to non-EV drivers; aggregate zip-code calibration does not address this at the behavioral level used for the analysis.
Authors: We agree that sensitivity tests on labeling thresholds are valuable and will add these in a revised Methods section, varying visitation frequency, gas station contrast, and daily behavior criteria while re-running key metrics. Individual-level ground truth is not available in this passive GPS dataset, as it lacks linked vehicle registration or survey data for specific drivers. Our approach uses aggregate zip-code calibration to official registrations plus consistency checks against charger-level benchmarks; we will expand discussion of how these population-level validations help address potential behavioral selection biases, though we acknowledge they do not fully substitute for driver-level validation. revision: partial
-
Referee: [Results (activity patterns and spillover analysis)] In the results on activity patterns, no quantitative error bars, confidence intervals, or sensitivity to labeling thresholds are reported on the visitation rates or bundling metrics; additionally, details on attribution of post-charging POI visits are absent. These omissions weaken assessment of the statistical robustness of the reported differences.
Authors: We will add error bars, confidence intervals, and statistical significance tests to the visitation rates and bundling metrics in the revised Results. Sensitivity to labeling thresholds will be reported, cross-referencing the new Methods analyses. We will also expand the Methods and Results to detail the attribution rules for post-charging POI visits, including the temporal windows (e.g., within X minutes post-session) and spatial buffers used to link visits to charging events. revision: yes
- Individual-level ground truth for EV ownership inference is unavailable in the anonymized passive GPS traces, preventing confusion matrices or hold-out validation at the driver level.
Circularity Check
No circularity: cohort inference calibrated and validated externally; behavioral claims derived from mobility data
full rationale
The paper identifies likely EV drivers via rule-based patterns in visitation to charging/gas stations, visit frequency, and daily travel behavior, then calibrates cohort size directly to external aggregate EV registration statistics at the zip-code level and validates charging patterns against independent charger-level benchmark datasets. The core claims (elevated cafe/restaurant visitation during charging; trip bundling on charge days) are computed from the resulting inferred cohort's mobility traces compared to non-EV drivers. No step reduces a derived quantity to its own inputs by construction, no fitted parameter is relabeled as a prediction, and no load-bearing premise rests on a self-citation chain; the derivation remains self-contained against the cited external benchmarks.
Axiom & Free-Parameter Ledger
Reference graph
Works this paper leans on
-
[1]
& Cost, E
Brown, A., Cappellucci, J., Heinrich, A., Gaus, M. & Cost, E. Electric vehicle charging infrastructure trends from the alternative fueling station locator: First quarter 2024. Tech. Rep., National Renewable Energy Laboratory (NREL), Golden, CO (United States) (2024). 2.International Energy Agency. Global ev outlook 2025 (2025). Licence: CC BY 4.0
2024
-
[2]
Electric vehicle outlook 2025 (2025)
BloombergNEF. Electric vehicle outlook 2025 (2025). Executive summary accessed online; full report available to subscribers
2025
-
[3]
& Gonz´alez, M
Wu, J., Salgado, A. & Gonz´alez, M. C. Planning the electric vehicle transition by integrating spatial information and social networks.Nat. Commun.16, 11220 (2025)
2025
-
[4]
Lou, J., Shen, X., Niemeier, D. A. & Hultman, N. Income and racial disparity in household publicly available electric vehicle infrastructure accessibility.Nat. Commun.5106 (2024)
2024
-
[5]
Commun.16, 5291 (2025)
Yu, Q.et al.Equity and reliability of public electric vehicle charging stations in the united states.Nat. Commun.16, 5291 (2025)
2025
-
[6]
H., Chakraborty, D., Hardman, S
Lee, J. H., Chakraborty, D., Hardman, S. J. & Tal, G. Exploring electric vehicle charging patterns: Mixed usage of charging infrastructure.Transp. Res. Part D: Transp. Environ.79, 102249 (2020)
2020
-
[7]
Tal, G., Chakraborty, D., Jenn, A., Lee, J. H. & Bunch, D. Factors affecting demand for plug-in charging infrastructure: An analysis of plug-in electric vehicle commuters.UC Off. Pres. Univ. California Inst. Transp. Stud.(2020)
2020
-
[8]
A., Tiwari, G
Bhat, F. A., Tiwari, G. Y . & Verma, A. Preferences for public electric vehicle charging infrastructure locations: A discrete choice analysis.Transp. Policy149, 177–197 (2024)
2024
-
[9]
A., Jensen, A
Visaria, A. A., Jensen, A. F., Thorhauge, M. & Mabit, S. E. User preferences for ev charging, pricing schemes, and charging infrastructure.Transp. Res. Part A: Policy Pract.165, 120–143 (2022)
2022
-
[10]
& Krems, J
Franke, T. & Krems, J. F. Understanding charging behaviour of electric vehicle users.Transp. Res. Part F: Traffic Psychol. Behav.21, 75–89 (2013)
2013
-
[11]
Bj¨ornsson, L. H. & Karlsson, S. Plug-in hybrid electric vehicles: How individual movement patterns affect battery requirements, the potential to replace conventional fuels, and economic viability.Appl. Energy143, 336–347 (2015)
2015
-
[12]
H., Yamamoto, T
Sun, X. H., Yamamoto, T. & Morikawa, T. Fast-charging station choice behavior among battery electric vehicle users. Transp. Res. Part D: Transp. Environ.46, 26–39 (2016)
2016
-
[13]
& MacKenzie, D
Yu, H. & MacKenzie, D. Modeling charging choices of small-battery plug-in hybrid electric vehicle drivers by using instrumented vehicle data.Transp. Res. Rec.2572, 56–65 (2016)
2016
-
[14]
W., Nicholas, M
Bauer, G., Hsu, C. W., Nicholas, M. & Lutsey, N. Charging up america: Assessing the growing need for us charging infrastructure through 2030.White Pap. ICCT(2021)
2030
-
[15]
R., Wang, S., Diao, M
Zheng, Y ., Keith, D. R., Wang, S., Diao, M. & Zhao, J. Effects of electric vehicle charging stations on the economic vitality of local businesses.Nat. Commun.15, 7437 (2024)
2024
-
[16]
Huang, P. & Ma, Z. Unveiling electric vehicle (ev) charging patterns and their transformative role in electricity balancing and delivery: Insights from real-world data in sweden.Renew. Energy236, 121511 (2024). 14/16
2024
-
[17]
& Timmermans, H
Kim, S., Yang, D., Rasouli, S. & Timmermans, H. Heterogeneous hazard model of pev users charging intervals: Analysis of four year charging transactions data.Transp. Res. Part C: Emerg. Technol.82, 248–260 (2017)
2017
-
[18]
C., Hidalgo, C
Gonzalez, M. C., Hidalgo, C. A. & Barabasi, A.-L. Understanding individual human mobility patterns.Nature453, 779–782 (2008)
2008
-
[19]
Huang, H., Cheng, Y . & Weibel, R. Transport mode detection based on mobile phone network data: A systematic review. Transp. Res. Part C: Emerg. Technol.101, 297–312, DOI: 10.1016/j.trc.2019.02.008 (2019)
-
[20]
Ren, X. & Chow, J. Y . A random-utility-consistent machine learning method to estimate agents’ joint activity scheduling choice from a ubiquitous data set.Transp. Res. Part B: Methodol.166, 396–418, DOI: /10.1016/j.trb.2022.11.005 (2022)
-
[21]
Fu, X., Zhang, Y ., Ort´uzar, J. d. D. & L¨u, G. Activity-travel pattern inference based on multi-source big data.Transp. Rev. 45, 26–48, DOI: 10.1080/01441647.2024.2400341 (2025)
-
[22]
Alsger, A., Tavassoli, A., Mesbah, M., Ferreira, L. & Hickman, M. Public transport trip purpose inference using smart card fare data.Transp. Res. Part C: Emerg. Technol.87, 123–137, DOI: 10.1016/j.trc.2017.12.016 (2018)
-
[23]
C., Moura, S
Xu, Y .,C ¸olak, S., Kara, E. C., Moura, S. J. & Gonz´alez, M. C. Planning for electric vehicle needs by coupling charging profiles with urban mobility.Nat. Energy3, 484–493 (2018)
2018
-
[24]
De Silva, M. M., Clark, C., Nakayama, T. & Yabe, T. Causal spillover effects of electric vehicle charging station placement on local businesses: a staggered adoption study.arXiv preprint arXiv:2511.19507(2025)
arXiv 2025
-
[25]
Babar, Y . & Burtch, G. Recharging retail: Estimating consumer demand spillovers from electric vehicle charging stations. Manuf. & Serv. Oper. Manag.26, 797–813, DOI: 10.1287/MSOM.2022.0519 (2024). 27.Cuebiq. Cuebiq mobility data for research. https://www.cuebiq.com/about/data-for-good/. Accessed: 2025-02-01. 28.Livewire Data Platform. EV Watts. https://l...
-
[26]
Department of Energy
U.S. Department of Energy. Alternative fuels data center: Electric vehicle charging station locations. https://afdc.energy. gov/fuels/electricity locations.html (2025). Accessed: August 2025
2025
-
[27]
Open Charge Map Contributors. Open charge map: Global ev charging location data. https://www.openchargemap.org (2025). Data licensed under CC BY 4.0; accessed August 12, 2025. 31.SafeGraph. Global places (poi) & geometry, DOI: 10.82551/SMXB-1K04 (2022). Accessed August 12, 2025. 32.California Department of Motor Vehicles. Vehicle fuel type count by ZIP co...
-
[28]
& Fingerman, K
Hsu, C.-W. & Fingerman, K. Public electric vehicle charger access disparities across race and income in california.Transp. Policy100, 59–67 (2021)
2021
-
[29]
& King, D
Kuby, M., Cordova-Cruzatty, A., Parker, N. & King, D. Ev charging for multifamily housing: Review of evidence, methods, barriers, and opportunities.Renew. Sustain. Energy Rev.210, 115253 (2025)
2025
-
[30]
& Ettema, D
Zhang, L., van Lierop, D. & Ettema, D. The effect of electric vehicle use on trip frequency and vehicle kilometers traveled (vkt) in the netherlands.Transp. Res. Part A: Policy Pract.192, 104325 (2025)
2025
-
[31]
Final Report, California Air Resources Board (2020)
Tal, G.et al.Advanced plug-in electric vehicle travel and charging behavior final report. Final Report, California Air Resources Board (2020)
2020
-
[32]
Javid, R. J. & Nejat, A. A comprehensive model of regional electric vehicle adoption and penetration.Transp. Policy54, 30–42, DOI: 10.1016/j.tranpol.2016.11.003 (2017)
-
[33]
Nazari, F., Mohammadian, A. K. & Stephens, T. Modeling electric vehicle adoption considering a latent travel pattern construct and charging infrastructure.Transp. Res. Part D: Transp. Environ.72, 65–82, DOI: 10.1016/j.trd.2019.04.010 (2019)
-
[34]
´A., Sprei, F., Gnann, T
Funke, S. ´A., Sprei, F., Gnann, T. & Pl¨otz, P. How much charging infrastructure do electric vehicles need? a review of the evidence and international comparison.Transp. Res. Part D: Transp. Environ.77, 224–242 (2019)
2019
-
[35]
M., Sanyal, A
Habibi, H., Liu, R., Respighi Grasso, G. M., Sanyal, A. & Singh, N. Quantifying specific and systemic factors in the black-white wealth gap in the united states.J. Econ. Race, Policy8, 210–232 (2025)
2025
-
[36]
Global places - poi data (2025)
DEWEY. Global places - poi data (2025). Data last updated [02/07/2025]. Retrieved November 11, 2024, from https://app.deweydata.io/products/63eeb9d8-8439-42b3-a75e-2d9cbdf64cb8/package
2025
-
[37]
& Tal, G
Canepa, K., Hardman, S. & Tal, G. An early look at plug-in electric vehicle adoption in disadvantaged communities in california.Transp. Policy78, 19–30 (2019). 15/16
2019
-
[38]
Vehicle registration transactions by department of licensing
Washington State Department of Licensing. Vehicle registration transactions by department of licensing. Washington State Open Data Portal (2026). Last updated April 21, 2026
2026
-
[39]
Massachusetts vehicle census
Massachusetts Department of Transportation, Office of Performance Management and Innovation. Massachusetts vehicle census. MassDOT / Metropolitan Area Planning Council (MAPC) (2023). 46.Parve, S., Kumar, H. & Vining, M. EValuateCO: Colorado electric vehicle dashboard. Atlas Public Policy (2024)
2023
-
[40]
Let’s talk about bias: A solution-oriented approach to representativeness in mobility data (2024)
Lake, B. Let’s talk about bias: A solution-oriented approach to representativeness in mobility data (2024). Accessed: 2026-02-15. Acknowledgements T.Y . and J.Y .J.C. acknowledge support by the National Science Foundation under grant number BCS 2425021. Author contributions statement C.C., A.D., M.C., J.Y .J.C., and T.Y . designed the algorithms, performe...
2024
discussion (0)
Sign in with ORCID, Apple, or X to comment. Anyone can read and Pith papers without signing in.