GROSS: German Rail Open-Source SUMO Scenario
Pith reviewed 2026-06-28 08:11 UTC · model grok-4.3
The pith
GROSS pipeline generates Germany-wide rail scenarios for SUMO with far fewer teleportations than standard methods.
A machine-rendered reading of the paper's core claim, the machinery that carries it, and where it could break.
Core claim
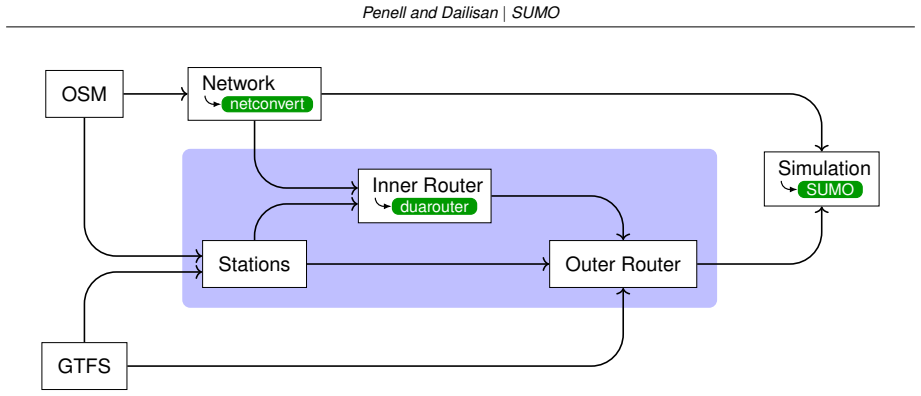
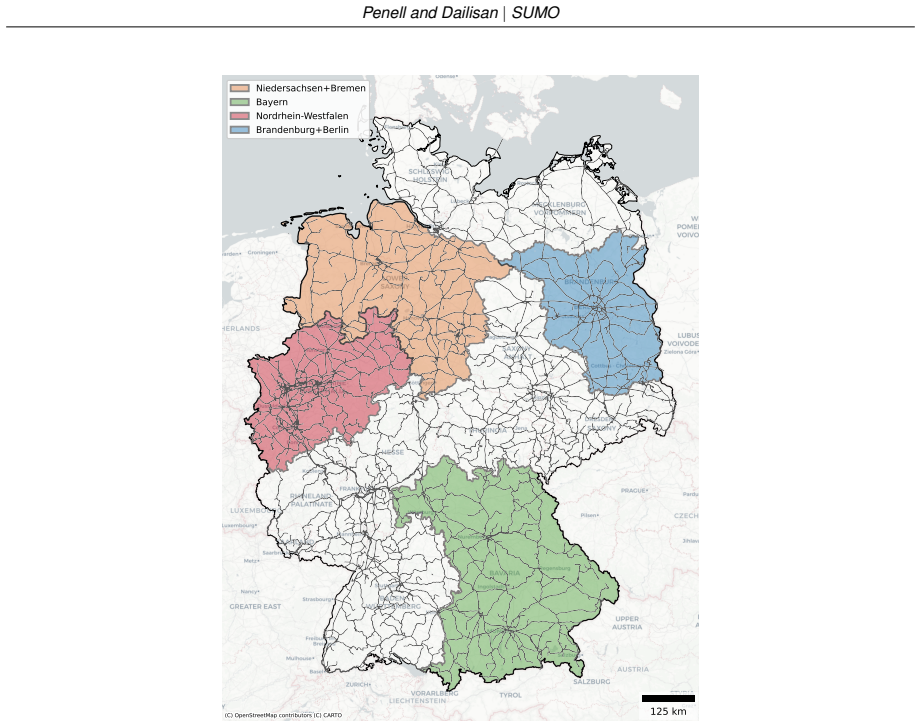
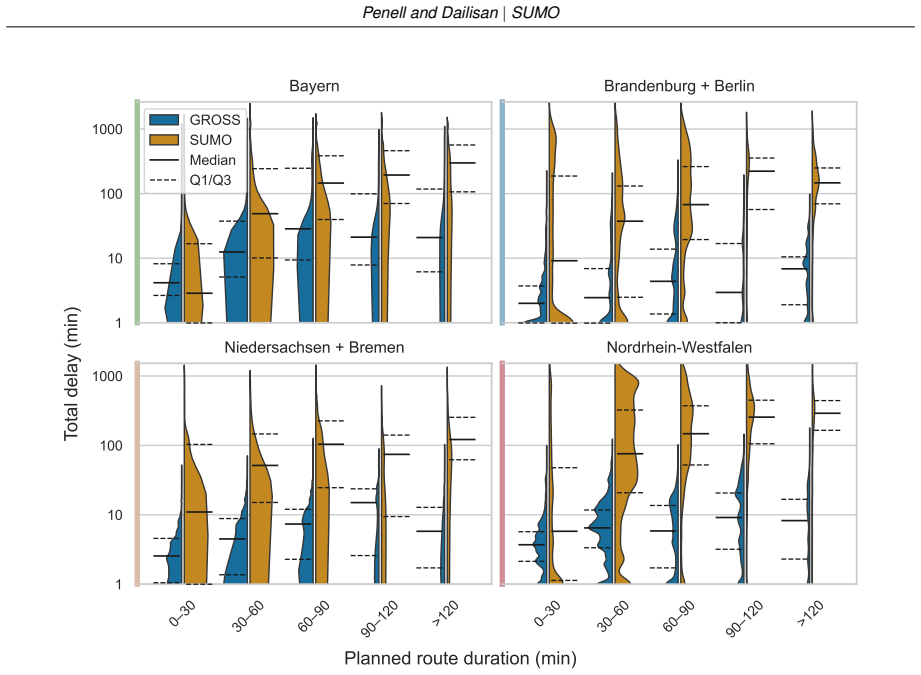
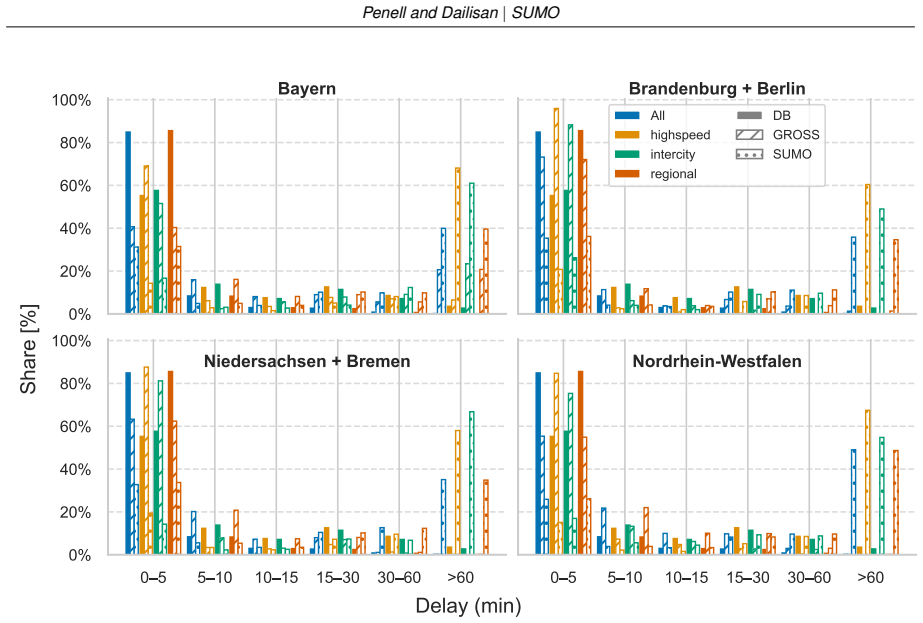
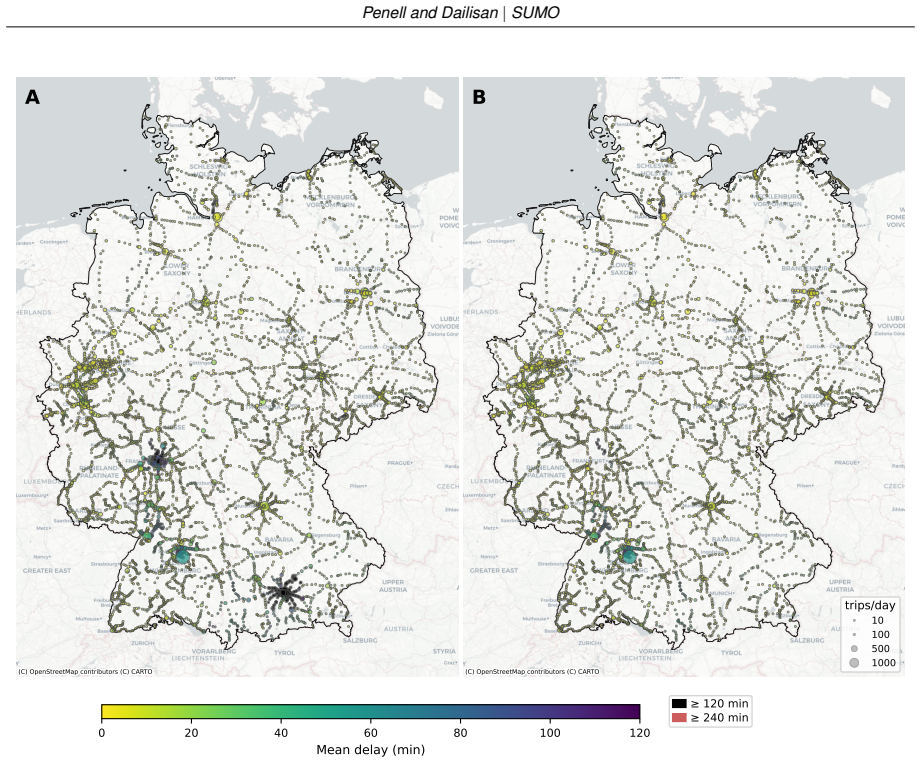
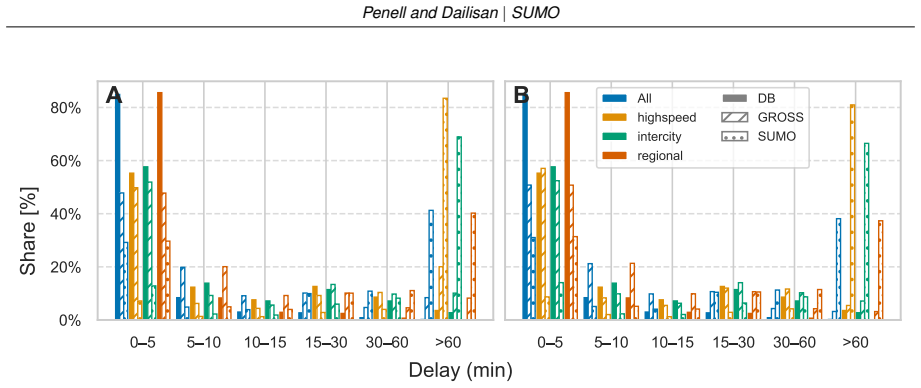
GROSS addresses inconsistencies between OSM geometry and GTFS stop assignments through topology-aware stop mapping via a hierarchical station model, followed by station-level routing with validation and targeted repair. Across multiple German regions this yields reductions in average teleportations per vehicle by factors of 1.7 to 76.8 times, shorter simulated delays relative to the vanilla SUMO pipeline, and the capacity to generate an end-to-end Germany-wide scenario with 35,925 trips that can be compared against operator-reported delay statistics.
What carries the argument
The hierarchical station model combined with station-level routing validation and targeted repair, which resolves geometry-assignment inconsistencies to produce stable rail simulations.
If this is right
- Reduces average teleportations per vehicle by a factor of 1.7-76.8 times compared with the vanilla SUMO pipeline.
- Produces shorter delays in the resulting simulations.
- Enables generation of a Germany-wide scenario containing 35,925 trips that supports direct comparison with operator-reported delay statistics.
- Lowers the barrier to constructing scalable, fully open rail simulations at country scale.
Where Pith is reading between the lines
- The same data-combination approach could be reused for rail networks in other countries that publish OSM and GTFS data.
- Improved stability may allow more reliable modeling of how delays propagate across large rail networks.
- Remaining long delays point to the need for richer timetable metadata or explicit dispatch rules in future extensions.
Load-bearing premise
The hierarchical station model and station-level routing with validation and targeted repair will correctly resolve inconsistencies between OSM geometry and GTFS stop assignments without creating new routing anomalies or unstable simulations.
What would settle it
Generate the same regional scenarios with both the vanilla SUMO conversion and GROSS, then compare measured teleportation counts and delay distributions to check whether GROSS consistently produces the reported 1.7-76.8 times reduction and closer alignment with real operator delay data.
Figures
read the original abstract
Microscopic simulation enables reproducible evaluation in intelligent transportation systems, yet most open SUMO scenarios and toolchains remain road-traffic centric, leaving rail underrepresented despite its importance for public transport and its sensitivity to network-wide disruptions. We present the German Rail Open-Source Scenario (GROSS), an open pipeline that combines OpenStreetMap railway infrastructure with GTFS schedules to generate nation-scale rail scenarios for SUMO (Simulation of Urban MObility). Existing conversions often rely on geometry-only stop-to-track matching and inconsistent platform/track assignments, which can create routing anomalies and unstable simulations dominated by teleportation artefacts. GROSS addresses this with topology-aware stop mapping via a hierarchical station model, followed by station-level routing with validation and targeted repair. Across multiple German regions, GROSS reduces average teleportations per vehicle by a factor of 1.7--76.8$\times$, shortens delays compared to the vanilla SUMO pipeline, and it enables end-to-end generation of a Germany-wide scenario with 35\,925 trips for comparisons with operator-reported delay statistics. While the remaining long delays highlight limitations in available timetable metadata and rail dispatch modeling, GROSS lowers the barrier to building scalable, fully open rail simulations and to studying delay propagation at country scale.
Editorial analysis
A structured set of objections, weighed in public.
Referee Report
Summary. The manuscript presents GROSS, an open pipeline integrating OpenStreetMap railway infrastructure with GTFS schedules to generate nation-scale rail scenarios for SUMO. It introduces a hierarchical station model followed by station-level routing, validation, and targeted repair to address inconsistencies in stop-to-track matching that cause routing anomalies and teleportation artifacts in existing geometry-only conversions. The central claims are empirical: across multiple German regions the approach reduces average teleportations per vehicle by factors of 1.7--76.8× and shortens delays relative to the vanilla SUMO pipeline, while also enabling generation of a Germany-wide scenario containing 35,925 trips that can be compared against operator-reported delay statistics.
Significance. If the reported improvements hold, the work meaningfully lowers the barrier to reproducible, open rail microsimulation at country scale and supports studies of delay propagation in public transport networks. The provision of an end-to-end open pipeline together with a national scenario constitutes a concrete contribution; the direct empirical evidence via teleportation reductions across regions supplies falsifiable support for the pipeline's effectiveness. These elements address a documented gap in rail-centric SUMO tooling.
major comments (2)
- [Pipeline overview] Pipeline overview: the hierarchical station model and the subsequent validation-plus-targeted-repair steps are described at a high level without explicit criteria for inconsistency detection, pseudocode, or concrete examples of repair actions; this detail is required to evaluate whether the procedure resolves OSM-GTFS mismatches without introducing new routing anomalies, which underpins the central stability claim.
- [Results] Results: the teleportation reduction factors (1.7--76.8×) and delay comparisons are stated as aggregate ranges without per-region tables, vehicle counts, variance measures, or error bars, and without release of raw simulation outputs; this omission prevents independent verification of robustness and makes the quantitative claims difficult to assess.
minor comments (2)
- [Abstract] Abstract: the final sentence contains an awkward repetition ('and it enables'); rephrasing would improve readability.
- The manuscript should include a direct pointer to the open-source repository and data artifacts already in the abstract or introduction to maximize accessibility.
Simulated Author's Rebuttal
We thank the referee for the constructive comments and positive assessment of the work's significance. We address each major comment below, indicating planned revisions where appropriate.
read point-by-point responses
-
Referee: [Pipeline overview] Pipeline overview: the hierarchical station model and the subsequent validation-plus-targeted-repair steps are described at a high level without explicit criteria for inconsistency detection, pseudocode, or concrete examples of repair actions; this detail is required to evaluate whether the procedure resolves OSM-GTFS mismatches without introducing new routing anomalies, which underpins the central stability claim.
Authors: We agree that the current high-level description limits evaluation of the procedure. In the revised manuscript we will expand the relevant section to provide explicit inconsistency-detection criteria (including distance thresholds and topology mismatch rules), pseudocode for the hierarchical station model and targeted-repair steps, and concrete before/after examples of repair actions. These additions will clarify how OSM-GTFS mismatches are resolved while avoiding new routing anomalies. revision: yes
-
Referee: [Results] Results: the teleportation reduction factors (1.7--76.8×) and delay comparisons are stated as aggregate ranges without per-region tables, vehicle counts, variance measures, or error bars, and without release of raw simulation outputs; this omission prevents independent verification of robustness and makes the quantitative claims difficult to assess.
Authors: We acknowledge that aggregate ranges alone hinder verification. The revised results section will include per-region tables reporting vehicle counts, mean teleportations per vehicle, variance measures, and error bars, together with the corresponding delay statistics. Full raw simulation outputs are impractically large for direct release; however, we will make the generated scenarios, summary statistics, and complete open pipeline code available in the repository to support reproduction and independent assessment of the reported improvements. revision: partial
Circularity Check
No significant circularity
full rationale
The paper describes an empirical data-processing pipeline that ingests OSM geometry and GTFS schedules, applies a hierarchical station model plus validation/repair steps, and measures resulting simulation stability (teleportation counts, delays) against a geometry-only baseline and external operator statistics. No equations, fitted parameters, or derivations are presented that reduce to their own inputs by construction. No load-bearing self-citations or uniqueness theorems are invoked. The reported gains are direct empirical outputs of the pipeline, not statistical artifacts of fitting or renaming. This is a standard engineering contribution whose central claims rest on observable simulation behavior rather than any circular reduction.
Axiom & Free-Parameter Ledger
axioms (1)
- domain assumption OpenStreetMap railway infrastructure and GTFS schedules contain sufficient and consistent data for nation-scale rail simulation after hierarchical mapping and repair
Reference graph
Works this paper leans on
-
[1]
P . A. Lopez et al., “Microscopic Traffic Simulation using SUMO,” in2018 21st International Conference on Intelligent Transportation Systems (ITSC), Nov. 2018, pp. 2575–2582. DOI: 10.1109/ITSC.2018.8569938. Accessed: Feb. 9, 2026
-
[2]
Traffic simulation for all: A real world traffic scenario from the city of bologna,
L. Bieker, D. Krajzewicz, A. Morra, C. Michelacci, and F . Cartolano, “Traffic simulation for all: A real world traffic scenario from the city of bologna,” inModeling Mobility with Open Data. Springer International Publishing, 2015, pp. 47–60, ISBN: 9783319150246. DOI: 10.1007/978-3-319-15024-6 4
-
[3]
IEEE Intelligent Transportation Systems Magazine , author =
L. Codeca, R. Frank, S. Faye, and T. Engel, “Luxembourg sumo traffic (lust) scenario: Traffic demand evaluation,”IEEE Intelligent Transportation Systems Magazine, vol. 9, no. 2, pp. 52–63, 2017, ISSN: 1939-1390. DOI: 10.1109/mits.2017.2666585. [Online]. Available: http://dx.doi.org/10.1109/MITS.2017.2666585
-
[4]
Towards multimodal mobility simulation of c-its: The monaco sumo traffic scenario,
L. Codeca and J. Harri, “Towards multimodal mobility simulation of c-its: The monaco sumo traffic scenario,” in2017 IEEE Vehicular Networking Conference (VNC), IEEE, Nov. 2017, pp. 97–100. DOI: 10.1109/vnc.2017.8275627. [Online]. Available: http://dx.doi.org /10.1109/VNC.2017.8275627
-
[5]
A large-scale traffic scenario of berlin for evaluating smart mobility applications,
K. Schrab, R. Protzmann, and I. Radusch, “A large-scale traffic scenario of berlin for evaluating smart mobility applications,” inSmart Energy for Smart Transport. Springer Nature Switzerland, 2023, pp. 276–287, ISBN: 9783031237218. DOI: 10.1007/978-3-03 1-23721-8 24. [Online]. Available: http://dx.doi.org/10.1007/978-3-031-23721-8 24
-
[6]
In: 2023 IEEE 26th International Con- ference on Intelligent Transportation Systems (ITSC)
Y . Y amazaki, Y . Tamura, X. D´efago, E. Javanmardi, and M. Tsukada, “Tost: Tokyo sumo traffic scenario,” in2023 IEEE 26th International Conference on Intelligent Transportation Systems (ITSC), IEEE, Sep. 2023, pp. 3597–3604. DOI: 10.1109/itsc57777.2023.10422
-
[7]
In: 2023 IEEE 26th International Con- ference on Intelligent Transportation Systems (ITSC)
[Online]. Available: http://dx.doi.org/10.1109/ITSC57777.2023.10422517
-
[8]
Getting Real: The Challenge of Building and Validating a Large-Scale Digital Twin of Barcelona’s Traffic with Empirical Data,
J. Argota S ´anchez-Vaquerizo, “Getting Real: The Challenge of Building and Validating a Large-Scale Digital Twin of Barcelona’s Traffic with Empirical Data,”ISPRS International Journal of Geo-Information, vol. 11, no. 1, p. 24, Dec. 2021, ISSN: 2220-9964. DOI: 10.3 390/ijgi11010024. Accessed: Feb. 18, 2026
2021
-
[9]
L. N. Alegre,SUMO-RL, https://github.com/LucasAlegre/sumo-rl, 2019
2019
-
[10]
M. Korecki, D. Dailisan, and D. Helbing, “How well do reinforcement learning approaches cope with disruptions? the case of traffic signal control,”IEEE Access, vol. 11, pp. 36 504– 36 515, 2023. DOI: 10.1109/ACCESS.2023.3266644
-
[11]
Democratizing traffic control in smart cities,
M. Korecki, D. Dailisan, J. Y ang, and D. Helbing, “Democratizing traffic control in smart cities,”Transportation Research Part C: Emerging Technologies, vol. 160, p. 104 511, Mar. 2024, ISSN: 0968-090X. DOI: 10.1016/j.trc.2024.104511
-
[12]
Fairlane: A multi-agent approach to priority lane management in diverse traffic composition,
R. K. Dubey, D. Dailisan, J. Argota S ´anchez–Vaquerizo, and D. Helbing, “Fairlane: A multi-agent approach to priority lane management in diverse traffic composition,”Trans- portation Research Part C: Emerging Technologies, vol. 171, p. 104 919, Feb. 2025, Penell and Dailisan|SUMO ISSN: 0968-090X. DOI: 10.1016/j.trc.2024.104919. [Online]. Available: http:...
-
[13]
Reducing car dependence in the heart of Europe: Lessons from Germany, Austria, and Switzerland,
R. Buehler, J. Pucher, R. Gerike, and T. G ¨otschi, “Reducing car dependence in the heart of Europe: Lessons from Germany, Austria, and Switzerland,”Transport Reviews, vol. 37, no. 1, pp. 4–28, Jan. 2017, ISSN: 0144-1647. DOI: 10.1080/01441647.2016.1177799. Accessed: Feb. 2, 2026
-
[14]
The effect of infrastructure on worker mobility: Evidence from high-speed rail expansion in Germany,
D. F . Heuermann and J. F . Schmieder, “The effect of infrastructure on worker mobility: Evidence from high-speed rail expansion in Germany,”Journal of Economic Geography, vol. 19, no. 2, pp. 335–372, Mar. 2019, ISSN: 1468-2702. DOI: 10 . 1093 / jeg / lby019. Accessed: Feb. 2, 2026
2019
-
[15]
The potential of high-speed rail freight in Europe: How is a modal shift from road to rail possible for low-density high value cargo?
M. Boehm, M. Arnz, and J. Winter, “The potential of high-speed rail freight in Europe: How is a modal shift from road to rail possible for low-density high value cargo?”European Transport Research Review, vol. 13, no. 1, p. 4, Jan. 2021, ISSN: 1866-8887. DOI: 10.1 186/s12544-020-00453-3. Accessed: Feb. 2, 2026
2021
-
[16]
Systemic risk approach to mitigate delay cascading in railway networks,
S. Daniotti, V. D. P . Servedio, J. Kager, A. Robben-Baldauf, and S. Thurner, “Systemic risk approach to mitigate delay cascading in railway networks,”npj Sustainable Mobility and Transport, vol. 1, no. 1, p. 15, Dec. 2024, ISSN: 3004-8664. DOI: 10.1038/s44333-0 24-00012-6. Accessed: Feb. 9, 2026
-
[17]
O. Cats and E. Jenelius, “Beyond a complete failure: The impact of partial capacity degra- dation on public transport network vulnerability,”Transportmetrica B: Transport Dynamics, vol. 6, no. 2, pp. 77–96, Dec. 2016, ISSN: 2168-0582. DOI: 10.1080/21680566.2016.12 67596. [Online]. Available: http://dx.doi.org/10.1080/21680566.2016.1267596
-
[18]
Defining robustness of a rail- way timetable,
T. Dewilde, P . Sels, D. Cattrysse, and P . Vansteenwegen, “Defining robustness of a rail- way timetable,” in4th International Seminar on Railway Operations Modelling and Anal- ysis (IAROR) : RailRome 2011, Proceedings, Ghent University, Department of Industrial Management, 2011. HDL: 1854/LU-1163245. Accessed: Feb. 9, 2026
2011
-
[19]
OpenStreetMap contributors,Planet dump retrieved from https://download.geofabrik.de, https://www.openstreetmap.org, 2026
2026
-
[20]
Accessed: Feb
DELFI e.V.,DELFI-Archive, https://archiv.opendata-oepnv.de/VRR/DELFI/Soll- Fahrplandaten%20(GTFS)/2025/. Accessed: Feb. 19, 2026
2025
-
[21]
Alvarez Lopez et al.,Simulation of urban mobility (sumo), version 1.26.0, Jan
P . Alvarez Lopez et al.,Simulation of urban mobility (sumo), version 1.26.0, Jan. 2026. DOI: 10.5281/zenodo.18406080. [Online]. Available: https://doi.org/10.5281/zenodo.184 06080
-
[22]
Litman,Towards More Comprehensive and Multi-Modal Transport Evaluation
T. Litman,Towards More Comprehensive and Multi-Modal Transport Evaluation. Victoria Transport Policy Institute, 2013
2013
-
[23]
DLR-TS,sumo-berlin: A SUMO scenario of Berlin, https://github.com/DLR-TS/sumo-ber lin, 2026
2026
-
[24]
Forward & backward, left & right - OpenStreetMap Wiki,
OpenStreetMap Wiki contributors. “Forward & backward, left & right - OpenStreetMap Wiki,” Accessed: Apr. 15, 2026. [Online]. Available: https://wiki.openstreetmap.org/wiki /Forward %26 backward, left %26 right#Identifying the direction of a .27way.27
2026
-
[25]
Mobility database,
Mobility Database. “Mobility database,” Mobility Database, Accessed: Apr. 15, 2026. [On- line]. Available: https://mobilitydatabase.org
2026
-
[26]
National Access Points — Mobility and Transport — European Commission,
European Commission. “National Access Points — Mobility and Transport — European Commission,” Accessed: Apr. 15, 2026. [Online]. Available: https://transport.ec.europa.e u/transport-themes/smart-mobility/road/its-directive-and-action-plan/national-access-po ints en
2026
-
[27]
10, 2026
Entur AS,Entur/netex-gtfs-converter-java, Apr. 10, 2026. Accessed: Apr. 15, 2026. [On- line]. Available: https://github.com/entur/netex-gtfs-converter-java Penell and Dailisan|SUMO Appendix Teleportation heatmap A SUMO B GROSS 10 2 10 1 100 101 102 103 T eleportation Counts Figure A1.Spatial distributions of teleportation between SUMO (left) and GROSS (ri...
2026
discussion (0)
Sign in with ORCID, Apple, or X to comment. Anyone can read and Pith papers without signing in.