ABCD: The Nuclear Structure of the Little Red Dots Revealted through Absorption, Break, Continuum, and Decrement
Pith reviewed 2026-06-28 05:40 UTC · model grok-4.3
The pith
Little red dots show a clumpy gaseous torus around the central disk with broad-line clouds along polar directions, making their spectra depend on viewing angle.
A machine-rendered reading of the paper's core claim, the machinery that carries it, and where it could break.
Core claim
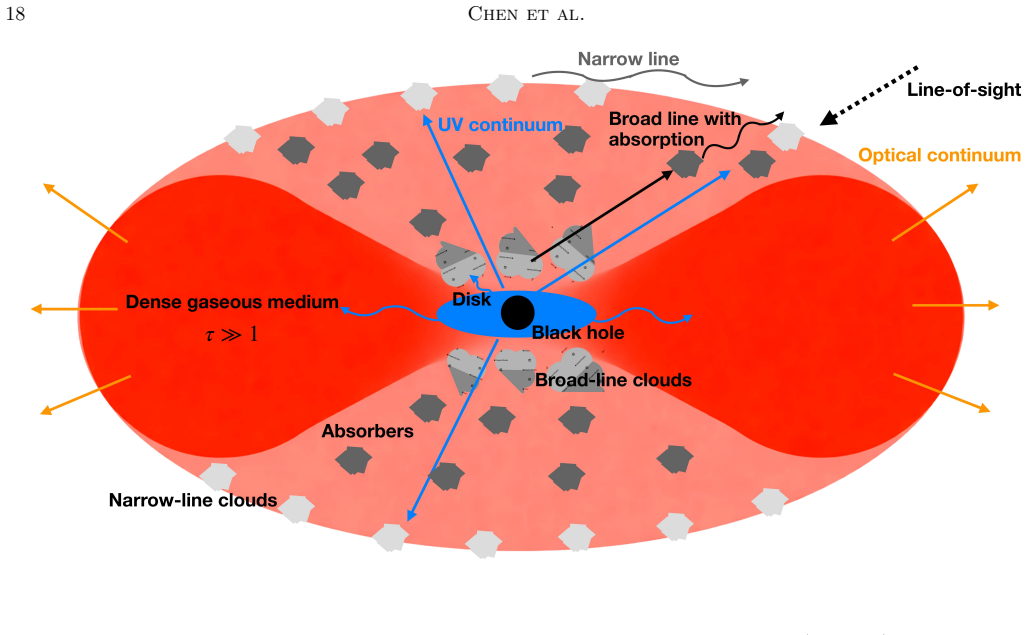
The distinctive spectral and continuum properties of little red dots are explained via a viewing angle-dependent nuclear structure in which an optically thick, clumpy gaseous torus surrounds the central accretion disk, with broad-line clouds and absorbers distributed along the less-obscured polar directions.
What carries the argument
Viewing angle-dependent nuclear structure consisting of an optically thick clumpy gaseous torus around the accretion disk plus polar broad-line clouds and absorbers
If this is right
- Narrow-line Balmer decrements remain consistent with case B recombination plus mild dust attenuation across the sample.
- Broad-line decrements match photoionization models only for gas densities at or above 10^9 cm^{-3}.
- Balmer absorption lines indicate absorber covering factors exceeding 50 percent in six sources.
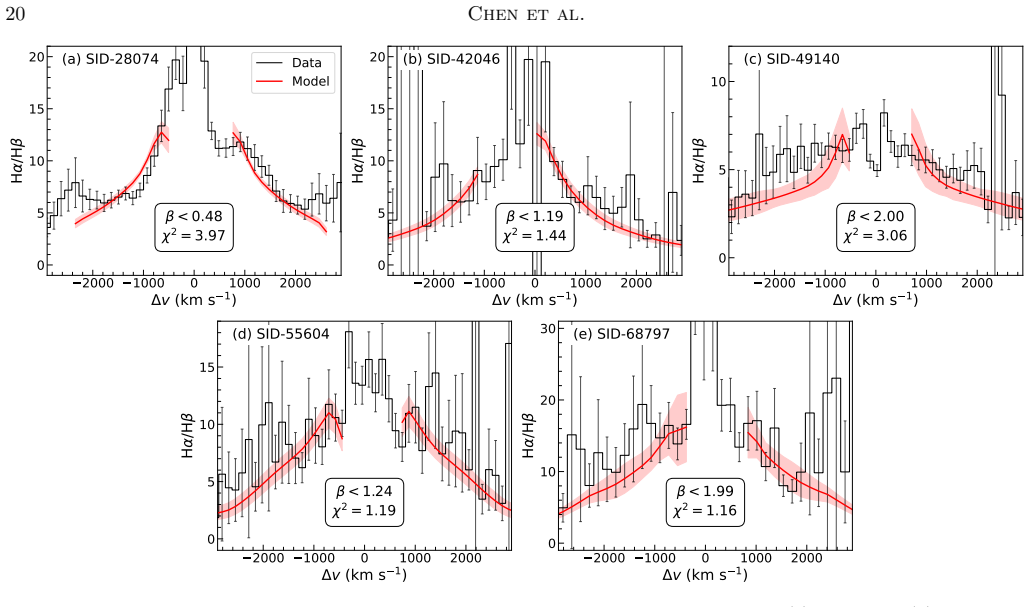
- A radial density profile with power-law index below 2 reproduces the centrally peaked decrements in three sources under the virial assumption.
- The luminosity inferred from broad and narrow H-alpha matches the observed continuum through photoionization.
Where Pith is reading between the lines
- If the torus-plus-polar-cloud geometry holds, little red dots may represent the same central engine as other active galaxies viewed at particular angles.
- The link between blueshifted absorption and elevated narrow-line decrements suggests outflows carry dust that affects the observed narrow-line ratios.
- The model predicts that sources viewed more face-on would show weaker absorption and lower Balmer decrements.
Load-bearing premise
The model that reproduces the velocity-resolved Balmer decrements assumes virialized dynamics in the broad-line region.
What would settle it
High signal-to-noise spectra of additional little red dots that show velocity-resolved Balmer decrement profiles requiring a radial density power-law index of 2 or greater, or that lack high-covering-factor absorbers in sources with blueshifted lines.
Figures
read the original abstract
We present a spectroscopic analysis of 14 little red dots (LRDs) at redshifts $2.2 < z < 6.7$ using NIRSpec/MSA prism and medium-resolution grating observations, aiming to constrain the nuclear gas structure through Balmer emission-line profiles, absorption features, relative line intensities, and continuum properties. We simultaneously decompose the broad, narrow, and absorption components of ${\rm H \alpha}$, ${\rm H \beta}$, and ${\rm H \gamma}$, and measure both integrated line ratios and velocity-resolved Balmer decrements. The narrow-line Balmer decrements are broadly consistent with Case~B recombination modified by mild dust attenuation, while the broad-line decrements are elevated to levels consistent with photoionization models of high-density gas at $n_{\rm H} \gtrsim 10^9\ {\rm cm^{-3}}$. Velocity-resolved Balmer decrements in five sources with highest signal-to-noise ratio are centrally peaked. Assuming virialized broad-line region dynamics, our model can reproduce the Balmer decrement profiles in three sources using a radial density profile with a power-law index $\beta<2$. The Balmer absorption lines detected in six sources yield absorber covering factors exceeding $50\%$. Sources with blueshifted absorption lines tend to have elevated narrow-line Balmer decrement, suggesting a connection between dust content and the presence of outflow. Comparing the incident luminosity inferred from broad and narrow ${\rm H \alpha}$ emission with the continuum suggests that both the UV and optical continuum and the line emission are linked by photoionization. We propose that the distinctive spectral and continuum properties of LRDs can be explained via a viewing angle-dependent nuclear structure in which an optically thick, clumpy gaseous torus surrounds the central accretion disk, with broad-line clouds and absorbers distributed along the less-obscured polar directions.
Editorial analysis
A structured set of objections, weighed in public.
Referee Report
Summary. The manuscript analyzes NIRSpec/MSA spectra of 14 little red dots (LRDs) at 2.2 < z < 6.7. It decomposes broad, narrow, and absorption components of Hα, Hβ, and Hγ, measures integrated line ratios and velocity-resolved Balmer decrements, and reports centrally peaked decrements in the five highest-S/N sources. Assuming virialized BLR dynamics, a radial density profile with power-law index β<2 is stated to reproduce the decrement profiles in three sources; absorber covering factors exceed 50% in six sources. The authors propose that LRD properties arise from a viewing-angle-dependent nuclear structure consisting of an optically thick clumpy gaseous torus surrounding the accretion disk, with broad-line clouds and absorbers along less-obscured polar directions.
Significance. If the quantitative reproduction of the velocity-resolved decrements holds under the stated assumptions, the work would supply a unified geometric picture linking the continuum shape, elevated broad-line decrements, absorption features, and narrow-line properties of LRDs through orientation effects. This could inform models of high-redshift AGN structure and the physical nature of the LRD population.
major comments (3)
- [Abstract] Abstract: the claim that the model reproduces the centrally peaked velocity-resolved Balmer decrements in three sources rests on an assumed virialized BLR plus a radial density power-law index β<2, yet no error bars, χ² values, or quantitative comparison to alternative kinematic models (e.g., outflows) are provided; this step is load-bearing for the proposed torus-plus-polar-cloud geometry.
- [Abstract] Abstract: the power-law index β is described as chosen such that the model matches the observed decrements, while the torus geometry is simultaneously constructed to account for the same absorption and continuum data; this introduces circularity that weakens the claim that the geometry is directly constrained by the observations.
- [Abstract] Abstract: blueshifted absorption is reported in six sources, which is consistent with outflows, yet the model assumes purely virialized BLR dynamics; the tension between these kinematic indicators is not addressed and directly affects the reliability of the β<2 density-profile inference.
minor comments (1)
- [Abstract] The abstract states that narrow-line decrements are 'broadly consistent' with Case B but does not quantify the range of implied E(B-V) values or compare them to standard dust laws.
Simulated Author's Rebuttal
We thank the referee for their constructive comments, which help clarify the presentation of our results. We address each major comment point by point below and will revise the manuscript to incorporate the suggested improvements.
read point-by-point responses
-
Referee: [Abstract] Abstract: the claim that the model reproduces the centrally peaked velocity-resolved Balmer decrements in three sources rests on an assumed virialized BLR plus a radial density power-law index β<2, yet no error bars, χ² values, or quantitative comparison to alternative kinematic models (e.g., outflows) are provided; this step is load-bearing for the proposed torus-plus-polar-cloud geometry.
Authors: We agree that quantitative support for the model fits would strengthen the claim. In the revised manuscript we will add error bars to the velocity-resolved Balmer decrement profiles, report χ² values for the β<2 power-law fits to the three sources, and include a short discussion comparing the virialized model to outflow alternatives, noting that the observed profile symmetries favor virial motion. revision: yes
-
Referee: [Abstract] Abstract: the power-law index β is described as chosen such that the model matches the observed decrements, while the torus geometry is simultaneously constructed to account for the same absorption and continuum data; this introduces circularity that weakens the claim that the geometry is directly constrained by the observations.
Authors: The value of β is obtained solely from fitting the velocity-resolved decrements under the virial assumption. The clumpy torus geometry is motivated independently by the continuum spectral shape, the measured absorption covering factors, and the narrow-line properties. We will revise the text to make this separation of constraints explicit and remove any appearance of circularity. revision: yes
-
Referee: [Abstract] Abstract: blueshifted absorption is reported in six sources, which is consistent with outflows, yet the model assumes purely virialized BLR dynamics; the tension between these kinematic indicators is not addressed and directly affects the reliability of the β<2 density-profile inference.
Authors: The manuscript already notes that blueshifted absorption correlates with elevated narrow-line decrements and suggests an outflow connection. The broad-line profiles used for the decrement analysis remain symmetric, consistent with virial motion, while the absorption may arise from a separate component. We will expand the discussion section to address this kinematic distinction and its limited impact on the BLR density-profile inference. revision: yes
Circularity Check
Reproduction of Balmer decrement profiles achieved by fitting radial density index β<2 to the same observations
specific steps
-
fitted input called prediction
[Abstract]
"Assuming virialized broad-line region dynamics, our model can reproduce the Balmer decrement profiles in three sources using a radial density profile with a power-law index β<2."
The index β is adjusted to match the centrally peaked velocity-resolved decrements observed in the three high-S/N sources; the claimed reproduction is therefore achieved by construction through fitting the free parameter to the target data rather than deriving it from external constraints or first principles.
full rationale
The paper's central quantitative support for the proposed viewing-angle-dependent nuclear structure (clumpy torus + polar BLR/absorbers) is the statement that a model assuming virialized dynamics reproduces the velocity-resolved decrements in three sources when a power-law density index β<2 is adopted. Because β is selected specifically to match the observed profiles, this reproduction is a direct consequence of the parameter choice rather than an independent prediction or test of the geometry. Other elements (narrow-line decrements, absorption covering factors, continuum comparisons) provide context but do not independently constrain the torus+polar distribution. This constitutes one instance of fitted input called prediction, yielding partial circularity in the derivation chain while leaving room for independent interpretive content.
Axiom & Free-Parameter Ledger
free parameters (2)
- radial density power-law index β =
<2
- gas density n_H =
>=10^9 cm^{-3}
axioms (1)
- domain assumption Broad-line region gas follows virialized dynamics
invented entities (1)
-
optically thick clumpy gaseous torus
no independent evidence
Forward citations
Cited by 1 Pith paper
-
Little Red Dots as Supermassive Analogs of SS 433
LRDs are interpreted as high-inclination hyper-Eddington accreting SMBHs analogous to SS 433, with V-shaped SEDs, X-ray weakness, and Balmer breaks emerging from disk self-shielding geometry.
Reference graph
Works this paper leans on
-
[1]
B., Casey, C
Akins, H. B., Casey, C. M., Berg, D. A., et al. 2025a, , 980, L29
-
[2]
B., Casey, C
Akins, H. B., Casey, C. M., Lambrides, E., et al. 2025b, , 991, 37
-
[3]
T., Bogd\'an, \'A, Kov\'acs, O., et al
Ananna, T. T., Bogd\'an, \'A, Kov\'acs, O., et al. 2024, , 969, L18
2024
-
[4]
1993, ARA&A, 31, 473
Antonucci, R. 1993, ARA&A, 31, 473
1993
-
[5]
2026, , submitted (arXiv:2601.10573)
Asada, Y., Inayoshi, K., Fei, Q., Fujimoto, S., & Willott, C. 2026, , submitted (arXiv:2601.10573)
Pith/arXiv arXiv 2026
-
[6]
B., Finkelstein, S
Bagley, M. B., Finkelstein, S. L., Koekemoer, A. M., et al. 2023, , 946, L12
2023
-
[7]
A., Ferland, G
Baldwin, J. A., Ferland, G. J., Martin, P. G., et al. 1991, , 374, 580
1991
-
[8]
1996, A&A, 117, 393
Bertin, E., & Arnouts, S. 1996, A&A, 117, 393
1996
-
[9]
1952, , 112, 195
Bondi, H. 1952, , 112, 195
1952
-
[10]
B., van Dokkum, P
Brammer, G. B., van Dokkum, P. G., & Coppi, P. 2008, , 686, 1503
2008
-
[11]
B., van Dokkum, P
Brammer, G. B., van Dokkum, P. G., Franx, M., et al. 2012, , 200, 13
2012
-
[12]
2025, , 544, L167
Brazzini, M., D'Eugenio, F., Maiolino, R., et al. 2025, , 544, L167
2025
-
[13]
2011, , 728, 58
Burlon, D., Ajello, M., Greiner, J., et al. 2011, , 728, 58
2011
-
[14]
P., & Anderson, D
Burnham, K. P., & Anderson, D. R. 2002, Model Selection and Multimodel Inference, (2nd edn)(New York, Springer-Verlag)
2002
-
[15]
C., et al
Calzetti, D., Armus, L., Bohlin, R. C., et al. 2000, , 533, 682
2000
-
[16]
Capriotti, E. R. 1964, , 139, 225
1964
-
[17]
J., Gronke, M., Matthee, J., et al
Chang, S. J., Gronke, M., Matthee, J., et al. 2026, , 545, staf2131
2026
-
[18]
2023, RMxAA, 59, 327
Chatzikos, M., Bianchi, S., Camilloni, F., et al. 2023, RMxAA, 59, 327
2023
-
[19]
C., Li, R., & Inayoshi, K
Chen, C.-H., Ho, L. C., Li, R., & Inayoshi, K. 2025a, , 989, L12
-
[20]
C., Li, R., & Zhuang, M.-Y
Chen, C.-H., Ho, L. C., Li, R., & Zhuang, M.-Y. 2025b, , 983, 60
-
[21]
Chen, K., Li, Z., Inayoshi, K., & Ho, L. C. 2025c, , 994, L42
-
[22]
Crenshaw, D. M. 1986, , 62, 821
1986
-
[23]
2025a, A&A, 697, A189
de Graaff, A., Brammer, G., Weibel, A., et al. 2025a, A&A, 697, A189
-
[24]
de Graaff, A., Hviding, R. E., Naidu, R. P., et al. 2026, , submitted (arXiv:2511.21820)
arXiv 2026
-
[25]
2024, A&A, 684, A87
de Graaff, A., Rix, H.-W., Carniani, S., et al. 2024, A&A, 684, A87
2024
-
[26]
P., et al
de Graaff, A., Rix, H.-W., Naidu, R. P., et al. 2025b, A&A, 701, A168
-
[27]
2026, , 545, staf2117
D'Eugenio, F., Juod z balis, I., Ji, X., et al. 2026, , 545, staf2117
2026
-
[28]
2008, , , 383, 581
Dong, X., Wang, T., Wang, J., et al. 2008, , , 383, 581
2008
-
[29]
Draine, B. T. 2011, Physics of the Interstellar and Intergalactic Medium (Princeton, NJ: Princeton Univ. Press)
2011
-
[30]
Fabian, A. C. 1999, , 308, L39
1999
-
[31]
P., Chisholm, J., Atek, H., et al
Fei, Q., Fujimoto, S., Naidu, R. P., Chisholm, J., Atek, H., et al. 2026, , 1003, 244
2026
-
[32]
C., Li, S
Feng, H. C., Li, S. S., Bai, J. M., Liu, H. T., Lu, K. X., et al. 2024, , 976, 176
2024
-
[33]
T, Verner, D
Ferland, G., Korista, K. T, Verner, D. A., et al. 1998, PASP, 110, 761
1998
-
[34]
Frank, J., King, A., & Raine, D. J. 2002, Accretion Power in Astrophysics: Third Edition (Cambridge: Cambridge Univ. Press)
2002
-
[35]
2024, Nature, 628, 57
Furtak, L., Labb\'e, I., Zitrin, A., et al. 2024, Nature, 628, 57
2024
-
[36]
D., Clayton, G
Gordon, K. D., Clayton, G. C., Misselt, K. A., et al. 2003, , 594, 279
2003
-
[37]
E., & Ho, L
Greene, J. E., & Ho, L. C. 2005, , 630, 122
2005
-
[38]
E., Labb\'e, I., Goulding, A
Greene, J. E., Labb\'e, I., Goulding, A. D., et al. 2024, , 964, 39
2024
-
[39]
E., Setton, D
Greene, J. E., Setton, D. J., Furtak, L. J., et al. 2026, ApJ, 996, 129
2026
-
[40]
E., Strader, J., & Ho, L
Greene, J. E., Strader, J., & Ho, L. C. 2020, ARA&A, 58, 257
2020
-
[41]
A., Kocevski, D
Grogin, N. A., Kocevski, D. D., Faber, S. M., et al. 2011, , 197, 35
2011
-
[42]
B.\ 2007, , 133, 4, 1271
Hall, P. B.\ 2007, , 133, 4, 1271
2007
-
[43]
E., Watson, D., Brammer, G., et al
Heintz, K. E., Watson, D., Brammer, G., et al. 2024, Sci, 384, 890
2024
-
[44]
C., Filippenko, A
Ho, L. C., Filippenko, A. V., & Sargent, W. L. W. 1997, , 112, 315
1997
-
[45]
C., & Kim, M
Ho, L. C., & Kim, M. 2009, , 184, 398
2009
-
[46]
E., de Graaff, A., Miller, T
Hviding, R. E., de Graaff, A., Miller, T. B., et al. 2025, A&A, 702, A57
2025
-
[47]
V., Narayan, R., & Abramowicz, M
Igumenshchev, I. V., Narayan, R., & Abramowicz, M. A. 2003, , 592, 1042
2003
-
[48]
C ., La Mura, G., et al
Ili\'c, D., Popovi\'c, L. C ., La Mura, G., et al. 2012, A&A, 543, A142
2012
-
[49]
2025, , 988, L22
Inayoshi, K. 2025, , 988, L22
2025
-
[50]
Inayoshi, K., & Ho, L. C. 2026, (arXiv:2512.03130)
arXiv 2026
-
[51]
2024, , 973, L49
Inayoshi, K., & Ichikawa, K. 2024, , 973, L49
2024
-
[52]
2025, , 980, L27
Inayoshi, K., & Maiolino, R. 2025, , 980, L27
2025
-
[53]
2026a, ApJ, 1000, 90
Inayoshi, K., Murase, K., & Kashiyama, K. 2026a, ApJ, 1000, 90
-
[54]
C., & Haiman, Zolt\'an 2026b, , 1002, 25
Inayoshi, K., Shangguan, J., Chen, X., Ho, L. C., & Haiman, Zolt\'an 2026b, , 1002, 25
-
[55]
Ishibashi, W., & Fabian, A. C. 2015, , 451, 93
2015
-
[56]
R., D'Eugenio, F., Maiolino, R., Isobe, Y., Juod z balis, I., et al
Ivey, L. R., D'Eugenio, F., Maiolino, R., Isobe, Y., Juod z balis, I., et al. 2026, , submitted (arXiv:2604.09177)
Pith/arXiv arXiv 2026
-
[57]
J., & Branch, D
Jeffery, D. J., & Branch, D. 1990, Jerusalem Winter School for Theoretical Physics. Supernovae (Teaneck, NJ: Publishing Co., Singapore)
1990
-
[58]
1961, Theory of Probability, 3rd Ed
Jeffery, H. 1961, Theory of Probability, 3rd Ed. (Oxford: Oxford Univ. Press)
1961
-
[59]
2025, , 544, 3900
Ji, X., Maiolino, R., \" U bler, H., et al. 2025, , 544, 3900
2025
-
[60]
Jones, B. L., Kocevski, D. D., Pacucci, F., Taylor, A. J., Finkelstein, S. L., et al. 2026, , submitted (arXiv:2510.07376)
arXiv 2026
-
[61]
2024, , 535, 853
Juod z balis, I., Ji, X., Maiolino, R., et al. 2024, , 535, 853
2024
-
[62]
M., et al
Juod z balis, I., Maiolino, R., Baker, W. M., et al. 2026a, , 546, 86
-
[63]
2026b, Nature, 653, 1017
Juod z balis, I., Marconcini, C., D'Eugenio, F., et al. 2026b, Nature, 653, 1017
-
[64]
1999, ASPC, 162, 223
Kaspi, S., & Netzer, H. 1999, ASPC, 162, 223
1999
-
[65]
C.\ 2007, , 665, 2, 1489
Kelly, B. C.\ 2007, , 665, 2, 1489
2007
-
[66]
Kido, D., Ioka, K., Hotokezaka, K., Inayoshi, K., & Irwin, C. M. 2025, , 544, 3407
2025
-
[67]
2024, A&A, 691, A52
Killi, M., Watson, D., Brammer, G., et al. 2024, A&A, 691, A52
2024
-
[68]
D., Finkelstein, S
Kocevski, D. D., Finkelstein, S. L., Barro, G., et al. 2025, , 986, 126
2025
-
[69]
M., Faber, S
Koekemoer, A. M., Faber, S. M., Ferguson, H. C., et al. 2011, , 197, 36
2011
-
[70]
E., et al
Kokorev, V., Caputi, K., Greene, J. E., et al. 2024, , 968, 38
2024
- [71]
-
[72]
2025, , 995, 24
Kokubo, M., & Harikane, Y. 2025, , 995, 24
2025
-
[73]
2013, A&A, 549, A100
Kollatschny, W., & Zetzl, M. 2013, A&A, 549, A100
2013
-
[74]
2026, A&A, submitted (arXiv:2604.08687)
Korber, D., Marques-Chaves, R., Schaerer, D., et al. 2026, A&A, submitted (arXiv:2604.08687)
Pith/arXiv arXiv 2026
-
[75]
1997, , 108, 401
Korista, K., Baldwin, J., Ferland, G., et al. 1997, , 108, 401
1997
-
[76]
Kormendy, J., & Ho, L. C. 2013, ARA&A, 51, 511
2013
-
[77]
1980, , 43, 305
Kron, R. 1980, , 43, 305
1980
-
[78]
2018, , 480, 1247
Kubota, A., & Done, C. 2018, , 480, 1247
2018
-
[79]
2019, , 489, 524
Kubota, A., & Done, C. 2019, , 489, 524
2019
-
[80]
2024, A&A, 684, A52
Kuhn, L., Shangguan, J., Davies, R., et al. 2024, A&A, 684, A52
2024
discussion (0)
Sign in with ORCID, Apple, or X to comment. Anyone can read and Pith papers without signing in.