Removal of Multivariate Environmental Influences in Structural Health Monitoring through Conditional Covariances and Supervised Learning
Pith reviewed 2026-06-28 04:54 UTC · model grok-4.3
The pith
Environmental conditions alter not only means but also covariances among SHM sensor outputs, which standard response surface models cannot remove.
A machine-rendered reading of the paper's core claim, the machinery that carries it, and where it could break.
Core claim
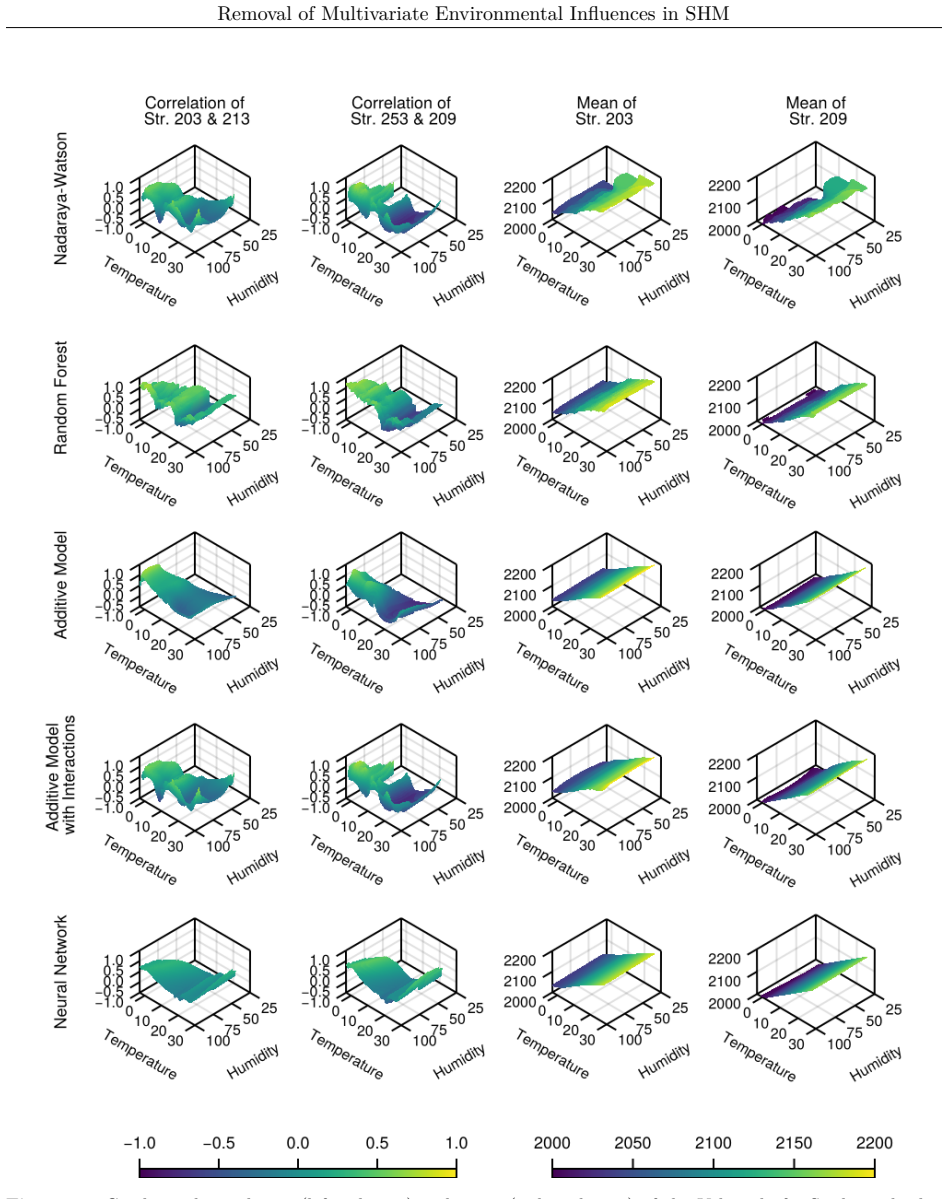
Environmental influences on SHM data extend to the covariance structure of the multivariate outputs, and this structure can be estimated as a function of the environmental variables by kernel regression, random forests, additive models, or deep networks; the resulting conditional covariance matrices, once subtracted or normalized, remove the higher-order confounding that mean-only response surface models leave behind.
What carries the argument
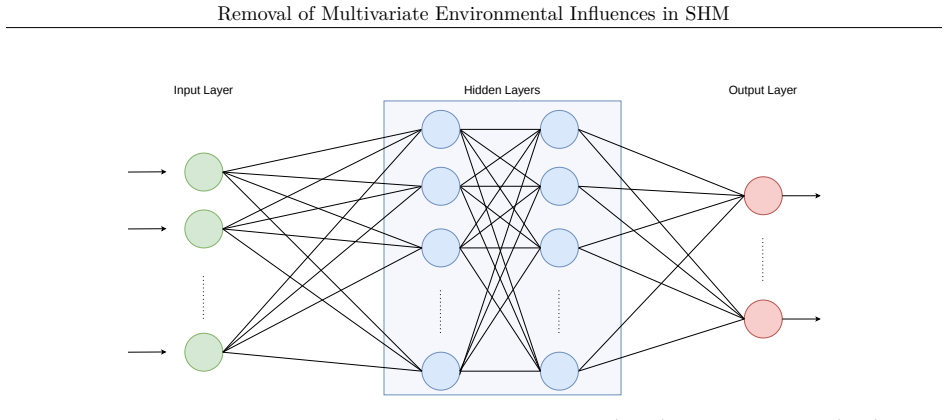
Supervised estimators (kernel, random forest, additive, deep learning) that map environmental features to the full conditional covariance matrix of the vector of sensor outputs.
If this is right
- The corrected data fed into damage-detection algorithms will contain fewer spurious changes driven by weather or traffic.
- Eigenfrequency vectors and multi-location strain readings both become usable after the same covariance adjustment.
- Method performance can be ranked on artificial data before deployment on the Vahrendorfer Stadtweg and KW51 bridges.
- Existing SHM pipelines require only an added conditional-covariance step rather than new hardware.
Where Pith is reading between the lines
- The same conditional-covariance step could be inserted into any multivariate monitoring task where correlations carry diagnostic information.
- Extending the approach to conditional skewness or kurtosis might capture still higher-order environmental effects.
- Real-time updating of the covariance estimator could support online SHM under continuously changing conditions.
Load-bearing premise
The chosen supervised learning methods recover the true dependence of output covariances on environmental conditions from the observed training samples.
What would settle it
Apply the conditional-covariance correction to a dataset from an undamaged bridge under documented environmental variation and check whether the corrected covariance matrices remain statistically indistinguishable from those recorded under a fixed reference environment.
Figures

read the original abstract
In structural health monitoring (SHM) systems, data is collected from a multitude of sensors measuring, for example, vibration or strain in the structure, along with additional features that capture environmental or operational information. It is well known that changes in the measured sensor outputs do not necessarily originate from structural damage but are often induced by environmental changes. One popular approach to account for these effects is regressing the system outputs on the confounding factors, also known as "response surface modeling". Afterward, the predicted values are subtracted from the observed ones to obtain corrected data with the environmental effects (supposedly) removed. However, the evaluation of real-world SHM data shows that environmental conditions may affect not only the expected output values but also higher-order statistical moments, particularly the variances of and the covariances and correlations between the output quantities, such as eigenfrequencies of different modes or strain sensors at different locations. By construction, the (supervised) machine learning techniques commonly used for response surface modeling cannot account for those higher-order effects. To address these issues, we present and discuss several approaches for identifying and quantifying multivariate confounding effects on output covariances and correlations: a nonparametric, kernel-based estimator, a random forest, a semiparametric additive model, and a deep learning approach. Furthermore, we show how the resulting conditional covariance matrices can be used in an SHM pipeline. We compare the competing methods on both artificial data and real-world load test data from the Vahrendorfer Stadtweg bridge in Hamburg, Germany, as well as eigenfrequency data from the railway bridge KW51 near Leuven, Belgium.
Editorial analysis
A structured set of objections, weighed in public.
Referee Report
Summary. The paper claims that environmental conditions in SHM affect not only means but also variances and covariances of sensor outputs, which standard response-surface modeling cannot capture. It proposes four supervised learning estimators (kernel, random forest, additive model, deep learning) for conditional covariance matrices and shows how to integrate them into an SHM pipeline, with comparisons performed on artificial data and real load-test data from the Vahrendorfer bridge and KW51 railway bridge.
Significance. If the conditional-covariance estimates demonstrably improve downstream damage detection, the approach would extend response-surface methods to higher-order moments and could reduce false alarms in operational SHM. The explicit comparison of four distinct estimators on both synthetic and field data is a constructive contribution.
major comments (1)
- [Abstract] Abstract: the manuscript states that the four estimators are compared on the Vahrendorfer and KW51 datasets and that the resulting conditional covariance matrices are used in an SHM pipeline, yet reports no quantitative metrics (change in false-alarm rate, ROC-AUC shift, Mahalanobis separation, or similar) that would confirm a detectable gain over mean-only correction. This validation step is load-bearing for the central claim that the methods 'meaningfully improve' the pipeline.
Simulated Author's Rebuttal
We thank the referee for the constructive review and positive assessment of the paper's potential contribution. We address the single major comment below and will incorporate the suggested evaluation in a revised version.
read point-by-point responses
-
Referee: [Abstract] Abstract: the manuscript states that the four estimators are compared on the Vahrendorfer and KW51 datasets and that the resulting conditional covariance matrices are used in an SHM pipeline, yet reports no quantitative metrics (change in false-alarm rate, ROC-AUC shift, Mahalanobis separation, or similar) that would confirm a detectable gain over mean-only correction. This validation step is load-bearing for the central claim that the methods 'meaningfully improve' the pipeline.
Authors: We agree that quantitative metrics demonstrating improvement in downstream damage detection (e.g., false-alarm rates or separation measures when using conditional covariances versus mean-only response surface correction) would strengthen the practical relevance of the work. The current manuscript focuses on the estimation accuracy of the conditional covariance matrices themselves (via comparisons on synthetic and field data) and illustrates their use in an SHM pipeline through the Mahalanobis distance, without performing a full damage-injection study. We will revise the manuscript to add such an evaluation on the Vahrendorfer and KW51 datasets, including simulated damage scenarios to report changes in detection performance. revision: yes
Circularity Check
No significant circularity detected
full rationale
The paper applies four standard supervised learning estimators (kernel, random forest, additive model, deep learning) to predict conditional covariance matrices from environmental covariates, then inserts those matrices into an SHM pipeline. None of the estimators is defined in terms of the downstream SHM metric, no prediction is obtained by fitting a parameter to a subset and renaming the fit, and no uniqueness theorem or ansatz is imported via self-citation. The artificial-data and real-bridge comparisons constitute independent checks rather than tautological reductions. The derivation chain therefore remains self-contained.
Axiom & Free-Parameter Ledger
free parameters (1)
- model hyperparameters
axioms (1)
- domain assumption Environmental and operational variables are observed and serve as valid predictors for conditional second-moment statistics.
Reference graph
Works this paper leans on
-
[1]
C. Alakus, D. Larocque, and A. Labbe. Covariance regression with random forests. BMC Bioinformatics, 24 0 (258), 2023. doi:10.1186/s12859-023-05377-y
-
[2]
J. Bezanson, A. Edelman, S. Karpinski, and V. B. Shah. Julia: A fresh approach to numerical computing. SIAM R eview , 59 0 (1): 0 65--98, 2017. doi:10.1137/141000671
-
[3]
C. M. Bishop. Pattern Recognition and Machine Learning. Springer New York, NY, 2006. ISSN 978-1-4939-3843-8
2006
-
[4]
D. Conn and G. Li. An oracle property of the Nadaraya–Watson kernel estimator for high-dimensional nonparametric regression . Scandinavian Journal of Statistics, 46 0 (3): 0 735--764, 2019. doi:10.1111/sjos.12370
-
[5]
E. Cross, K. Koo, J. Brownjohn, and K. Worden. Long-term monitoring and data analysis of the Tamar Bridge . Mechanical Systems and Signal Processing, 35 0 (1-2): 0 16--34, 2013. doi:10.1016/j.ymssp.2012.08.026
-
[6]
E. J. Cross, K. Worden, and Q. Chen. Cointegration: a novel approach for the removal of environmental trends in structural health monitoring data. Proceedings of the Royal Society A: Mathematical, Physical and Engineering Sciences, 467 0 (2133): 0 2712--2732, 2011. doi:10.1098/rspa.2011.0023
-
[7]
E. J. Cross, G. Manson, K. Worden, and S. G. Pierce. Features for damage detection with insensitivity to environmental and operational variations. In Proceedings of the Royal Society A, volume 486, pages 4098--4122, 2012. doi:10.1098/rspa.2012.0031
-
[8]
A. Cury, C. Cremona, and J. Dumoulin. Long-term monitoring of a PSC box girder bridge: Operational modal analysis, data normalization and structural modification assessment . Mechanical Systems and Signal Processing, 33: 0 13--37, 2012. doi:10.1016/j.ymssp.2012.07.005
-
[9]
B. de Ville. Decision trees. WIREs Computational Statistics, 5 0 (6): 0 448--455, 2013. doi:10.1002/wics.1278
-
[10]
F. Deng, S. Wei, X. Jin, Z. Chen, and H. Li. Damage identification of long-span bridges based on the correlation of probability distribution of monitored quasi-static responses. Mechanical Systems and Signal Processing, 186: 0 109908, 2023. doi:10.1016/j.ymssp.2022.109908
-
[11]
N. Dervilis and K. Worden and E.J. Cross. On robust regression analysis as a means of exploring environmental and operational conditions for SHM data. Journal of Sound and Vibration, 347: 0 279-296, 2015. doi:10.1016/j.jsv.2015.02.039
-
[12]
C. Farrar and K. Worden. Structural Health Monitoring: A Machine Learning Perspective. John Wiley & Sons, Ltd, 2013. doi:10.1002/9781118443118
-
[13]
C. R. Farrar, P. J. Cornwell, S. W. Doebling, and M. B. Prime. Structural health monitoring studies of the alamosa canyon and i-40 bridges. Technical report, Los Alamos National Lab.(LANL), Los Alamos, NM (United States), 2000
2000
-
[14]
C. Flexa, W. Gomes, and C. Sales. Data normalization in structural health monitoring by means of nonlinear filtering. In 2019 8th Brazilian Conference on Intelligent Systems (BRACIS), pages 204--209, 2019. doi:10.1109/BRACIS.2019.00044
-
[15]
J. H. Friedman. Regularized discriminant analysis. Journal of the American Statistical Association, 84 0 (405): 0 165--175, 1989. doi:10.1080/01621459.1989.10478752
-
[16]
Gasser and H.-G
T. Gasser and H.-G. M \"u ller. Kernel estimation of regression functions. In T. Gasser and M. Rosenblatt, editors, Smoothing Techniques for Curve Estimation, pages 23--68, Berlin, Heidelberg, 1979. Springer Berlin Heidelberg. ISBN 978-3-540-38475-5
1979
-
[17]
Q. Han, Q. Ma, J. Xu, and M. Liu. Structural health monitoring research under varying temperature condition: a review. Journal of Civil Structural Health Monitoring, 11: 0 149--173, 2021. doi:10.1007/s13349-020-00444-x
-
[18]
Hotelling
H. Hotelling. Multivariate quality control illustrated by the air testing of sample bombsights. In C. Eisenhart, M. Hastay, and W. Wallis, editors, Techniques of Statistical Analysis, pages 111--184, New York, 1947. McGraw-Hill
1947
-
[19]
J.-z. Huang, S.-J. Yuan, D. sheng Li, and H. nan Li. A kernel canonical correlation analysis approach for removing environmental and operational variations for structural damage identification. Journal of Sound and Vibration, 548: 0 117516, 2023. doi:10.1016/j.jsv.2022.117516
-
[20]
M. Innes. Flux: Elegant machine learning with Julia . Journal of Open Source Software, 3 0 (25): 0 602, 2018. doi:10.21105/joss.00602
-
[21]
Fashionable Modelling with Flux
M. Innes, E. Saba, K. Fischer, D. Gandhi, M. C. Rudilosso, N. M. Joy, T. Karmali, A. Pal, and V. Shah. Fashionable modelling with flux. CoRR, abs/1811.01457, 2018. doi:10.48550/arXiv.1811.01457
work page internal anchor Pith review Pith/arXiv arXiv doi:10.48550/arxiv.1811.01457 2018
-
[22]
A. Jesus, P. Brommer, R. Westgate, K. Koo, J. Brownjohn, and I. Laory. Bayesian structural identification of a long suspension bridge considering temperature and traffic load effects. Structural Health Monitoring, 18 0 (4): 0 1310--1323, 2019. doi:10.1177/1475921718794299
-
[23]
A. Keshmiry, S. Hassani, M. Mousavi, and U. Dackermann. Effects of environmental and operational conditions on structural health monitoring and non-destructive testing: A systematic review. Buildings, 13 0 (4), 2023. doi:10.3390/buildings13040918
-
[24]
S. Kim, H. Kim, and Y. Hwang. Data-driven dynamic response forecasting and anomaly detection in long-span bridges. Journal of Civil Structural Health Monitoring, 15: 0 3045--3062, 2025. doi:10.1007/s13349-025-00952-8
-
[25]
M. Koehncke, Y. Jaelani, A. Mendler, L. Neumann, P. Wittenberg, A. Rode-Klemm, J. Grashorn and S. Kessler. Data Set of Load Tests and Structural Health Monitoring of a concrete boxgirder bridge . Zenodo, mar 2026 b . doi:10.5281/zenodo.20522191
-
[26]
M. Koehncke, Y. Jaelani, A. Mendler, L. Neumann, P. Wittenberg, A. Rode-Klemm, and S. Kessler. Data set of load tests and structural health monitoring of a concrete boxgirder bridge. arXiv preprint arXiv:2412.15713, 2026 a . doi:10.48550/arXiv.2412.15713
-
[27]
K. Kumar, P. Kumar Biswas, and N. Dhang. Time series-based SHM using PCA with application to ASCE benchmark structure. Journal of Civil Structural Health Monitoring, 10: 0 899--911, 2020. doi:10.1007/s13349-020-00423-2
-
[28]
Liaw and M
A. Liaw and M. Wiener. Classification and Regression by randomForest . R News, 2 0 (3): 0 18--22, 2002. URL https://CRAN.R-project.org/doc/Rnews/
2002
-
[29]
C. A. Lowry, W. H. Woodall, C. W. Champ, and S. E. Rigdon. A Multivariate Exponentially Weighted Moving Average Control Chart . Technometrics, 34 0 (1): 0 46--53, 1992. doi:10.2307/1269551
-
[30]
B. López Cabrera and F. Schulz. Volatility linkages between energy and agricultural commodity prices. Energy Economics, 54: 0 190--203, 2016. doi:10.1016/j.eneco.2015.11.018
-
[31]
J. M. Lucas and M. S. Saccucci. Exponentially weighted moving average control schemes: Properties and enhancements. Technometrics, 32 0 (1): 0 1--12, 1990. doi:10.1080/00401706.1990.10484583
-
[32]
K. Maes and G. Lombaert. Monitoring data for railway bridge KW51 in Leuven, Belgium, before, during, and after retrofitting. V1.0 . 2020. doi:10.5281/zenodo.3745914
-
[33]
K. Maes and G. Lombaert. Monitoring railway bridge KW51 before, during, and after retrofitting. Journal of Bridge Engineering, 26 0 (3): 0 04721001, 2021. doi:10.1061/(ASCE)BE.1943-5592.0001668
-
[34]
K. Maes, L. Van Meerbeck , E. Reynders and G. Lombaert. Validation of vibration-based structural health monitoring on retrofitted railway bridge KW51. Mechanical Systems and Signal Processing, 165 0 (3): 0 108380, 2021. doi:10.1016/j.ymssp.2021.108380
-
[35]
F. Magalhães, A. Cunha, and E. Caetano. Vibration based structural health monitoring of an arch bridge: From automated OMA to damage detection . Mechanical Systems and Signal Processing, 28: 0 212--228, 2012. doi:10.1016/j.ymssp.2011.06.011
-
[36]
H.-Q. Mu, Z.-J. Zheng, X.-H. Wu, and C. Su. Bayesian network-based modal frequency–multiple environmental factors pattern recognition for the Xinguang Bridge using long-term monitoring data . Journal of Low Frequency Noise, Vibration and Active Control, 39 0 (3): 0 545--559, 2020. doi:10.1177/1461348418786520
-
[37]
L. Neumann, P. Wittenberg, A. Mendler, and J. Gertheiss. Confounder-adjusted covariances of system outputs and applications to structural health monitoring. Mechanical Systems and Signal Processing, 224, 2025. doi:10.1016/j.ymssp.2024.111983
-
[38]
Higher-Order Multivariate Environmental Influences in Structural Health Monitoring
L. Neumann, P. Wittenberg, and J. Gertheiss. Higher-order multivariate environmental influences in structural health monitoring. arXiv preprint arXiv:2603.22950, 2026 a . doi:10.48550/arXiv.2603.229503
work page internal anchor Pith review Pith/arXiv arXiv doi:10.48550/arxiv.2603.229503 2026
-
[39]
L. Neumann, P. Wittenberg, A. Mendler, and J. Gertheiss. Signal and feature reconstruction in structural health monitoring under varying environmental conditions. Engineering Structures, 361: 0 122865, 2026 b . doi:10.1016/j.engstruct.2026.122865
-
[40]
Y. Ni, X. Hua, K. Fan, and J. Ko. Correlating modal properties with temperature using long-term monitoring data and support vector machine technique. Engineering Structures, 27 0 (12): 0 1762--1773, 2005. doi:10.1016/j.engstruct.2005.02.020
-
[41]
E. Page. Continuous inspection schemes. Biometrika, 41 0 (1-2): 0 100--115, 1954. doi:10.1093/biomet/41.1-2.100
-
[42]
A. Petersen, S. Deoni, and H.-G. M \"u ller. Fréchet estimation of time-varying covariance matrices from sparse data, with application to the regional co-evolution of myelination in the developing brain . The Annals of Applied Statistics, 13 0 (1): 0 393--419, 2019. doi:10.1214/18-AOAS1195
-
[43]
R: A Language and Environment for Statistical Computing
R Core Team . R: A Language and Environment for Statistical Computing. R Foundation for Statistical Computing, Vienna, Austria, 2025. URL https://www.R-project.org/
2025
-
[44]
E. Reynders, G. Wursten, and G. D. Roeck. Output-only structural health monitoring in changing environmental conditions by means of nonlinear system identification. Structural Health Monitoring, 13 0 (1): 0 82--93, 2014. doi:10.1177/1475921713502836
-
[45]
N. Rezazadeh, A. De Luca, D. Perfetto, M. R. Salami, and G. Lamanna. Systematic critical review of structural health monitoring under environmental and operational variability: approaches for baseline compensation, adaptation, and reference-free techniques. Smart Materials and Structures, 34 0 (7): 0 073001, 2025. doi:10.1088/1361-665X/ade7db
-
[46]
D. Rumelhart, G. Hinton, and R. Williams. Learning representations by back-propagating errors. Nature, 323: 0 533–536, 1986. doi:10.1038/323533a0
-
[47]
H. Sohn, M. Dzwonczyk, E. G. Straser, A. S. Kiremidjian, K. H. Law, and T. Meng. An experimental study of temperature effect on modal parameters of the Alamosa Canyon Bridge . Earthquake Engineering & Structural Dynamics, 28 0 (8): 0 879--897, 1999. 10.1002/(SICI)1096-9845(199908)28:8\
-
[48]
D. A. Tibaduiza, L. E. Mujica, J. Rodellar, and A. Güemes. Structural damage detection using principal component analysis and damage indices. Journal of Intelligent Material Systems and Structures, 27 0 (2): 0 233--248, 2016. doi:10.1177/1045389X14566520
-
[49]
E. Viefhues, M. Döhler, F. Hille, and L. Mevel. Fault detection for linear parameter varying systems under changes in the process noise covariance. IFAC-PapersOnLine, 53 0 (2): 0 13668--13673, 2020. doi:10.1016/j.ifacol.2020.12.868. 21st IFAC World Congress
-
[50]
Z. Wang, D.-H. Yang, T.-H. Yi, G.-H. Zhang, and J.-G. Han. Eliminating environmental and operational effects on structural modal frequency: A comprehensive review. Structural Control and Health Monitoring, 29 0 (11): 0 e3073, 2022. doi:10.1002/stc.3073
-
[51]
Y. Wei, Z. Chen, Z.-S. Ye, and E. Pan. High-dimensional process monitoring under time-varying operating conditions via covariate-regulated principal component analysis. Reliability Engineering & System Safety, 252: 0 110440, 2024. doi:10.1016/j.ress.2024.110440
-
[52]
T. R. Willemain and G. C. Runger. Designing control charts using an empirical reference distribution. Journal of Quality Technology, 28 0 (1): 0 31--38, 1996. doi:10.1080/00224065.1996.11979634
-
[53]
P. Wittenberg, L. Neumann, K. Maes, and J. Gertheiss. Covariate-Dependent Functional Principal Component Analysis for SHM . arXiv preprint arXiv:2603.18279, 2026. doi:10.48550/arXiv.2603.18279
-
[54]
S. Wood. Generalized Additive Models: An Introduction with R. Chapman and Hall/CRC, 2 edition, 2017
2017
-
[55]
S. N. Wood. Fast stable restricted maximum likelihood and marginal likelihood estimation of semiparametric generalized linear models. Journal of the Royal Statistical Society: Series B (Statistical Methodology), 73 0 (1): 0 3--36, 2011. doi:10.1111/j.1467-9868.2010.00749.x
-
[56]
K. Worden, G. Manson, and C. Surace. Aspects of novelty detection. Key Engineering Materials, 347: 0 3--16, 2007. doi:10.4028/www.scientific.net/KEM.347.3
-
[57]
J. Yin, Z. Geng, R. Li, and H. Wang. Nonparametric covariance model. Statistica Sinica 20, pages 469--479, 2010
2010
-
[58]
Y.-H. Zhou and F. A. Wright. Hypothesis testing at the extremes: fast and robust association for high-throughput data. Biostatistics, 16: 0 611--625, 2015. doi:10.1093/biostatistics/kxv007
-
[59]
Y. Zhu, Y.-Q. Ni, D. Inaudi, and I. Laory. A temperature-driven MPCA method for structural anomaly detection. Engineering Structures, 190: 0 447--458, 2019. doi:10.1016/j.engstruct.2019.04.004
discussion (0)
Sign in with ORCID, Apple, or X to comment. Anyone can read and Pith papers without signing in.