The Influence of Opacity on Inferred MHD Wave Signatures in the Lower Solar Atmosphere
Pith reviewed 2026-06-28 03:52 UTC · model grok-4.3
The pith
Opacity effects in spectral inversions produce apparent phase shifts in low-frequency magnetic oscillations within solar pores.
A machine-rendered reading of the paper's core claim, the machinery that carries it, and where it could break.
Core claim
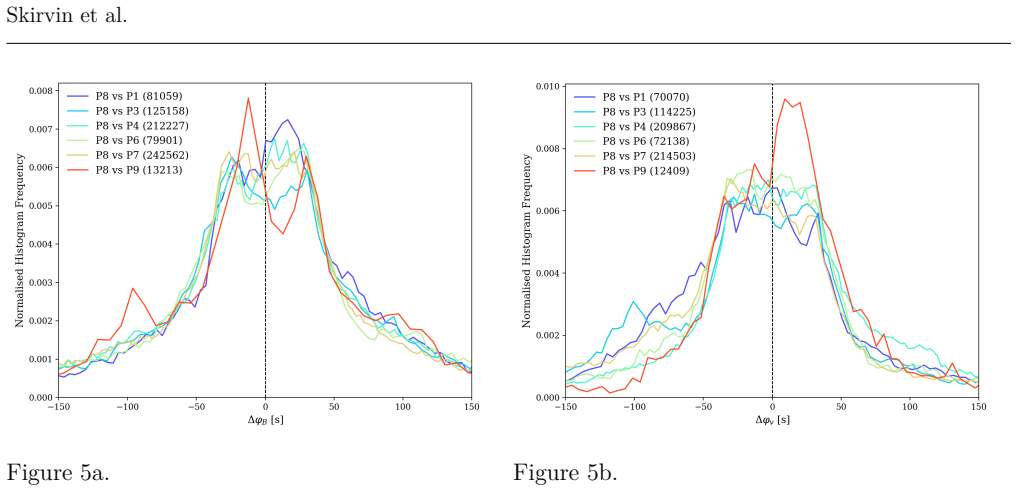
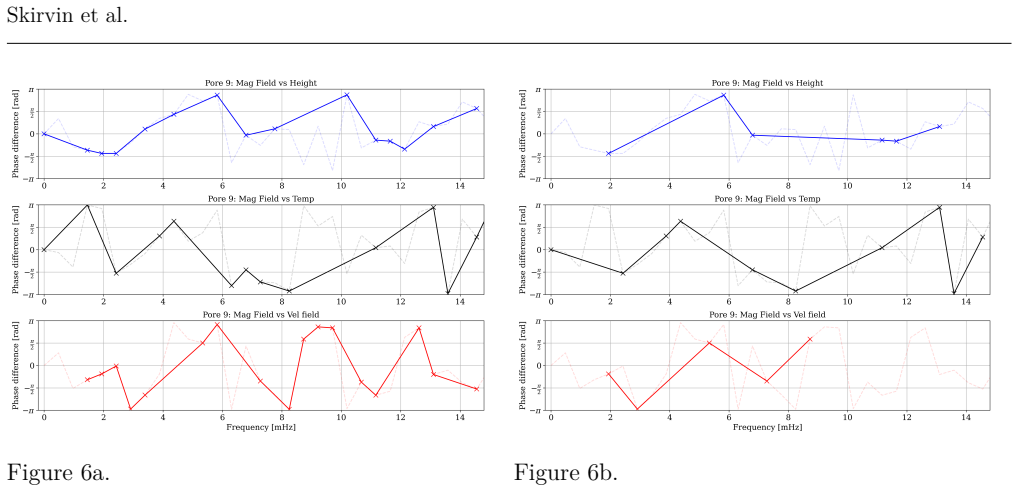
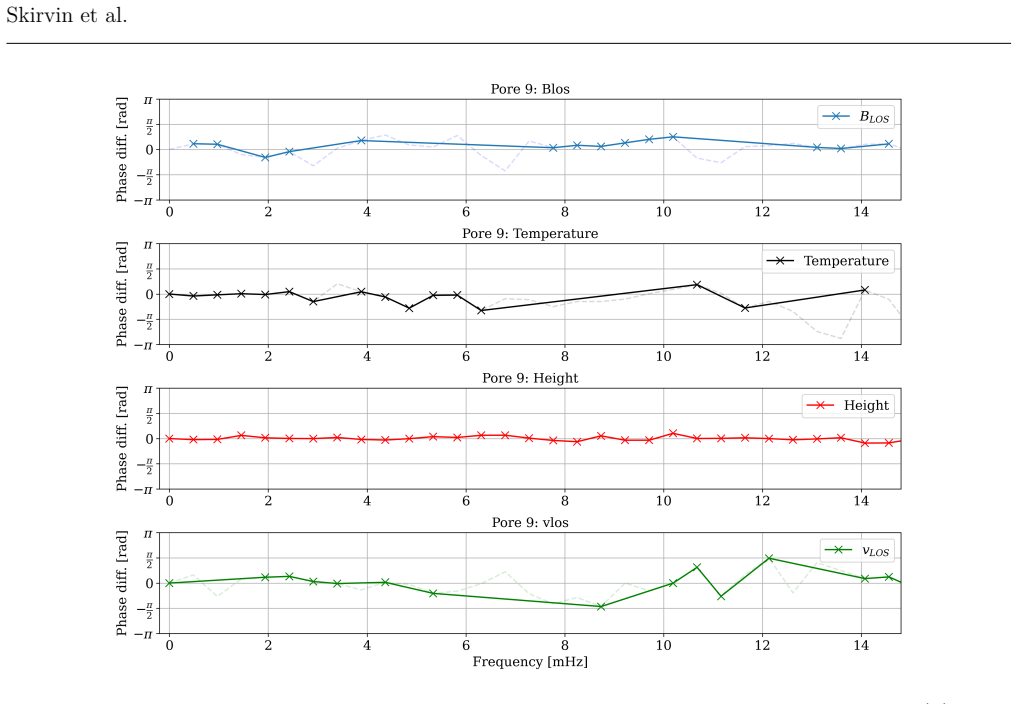
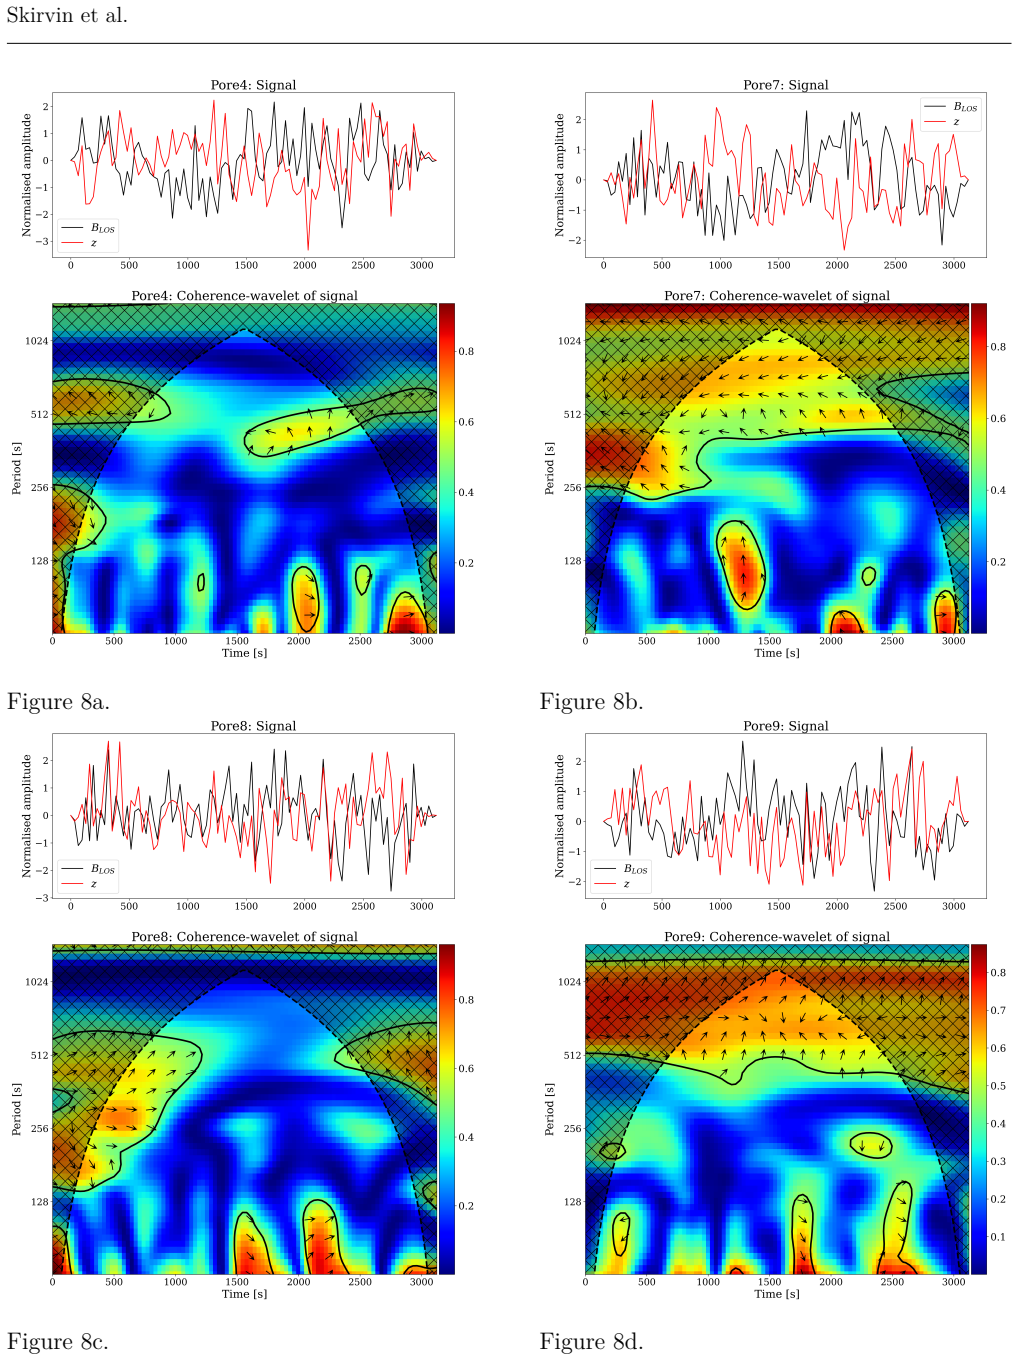
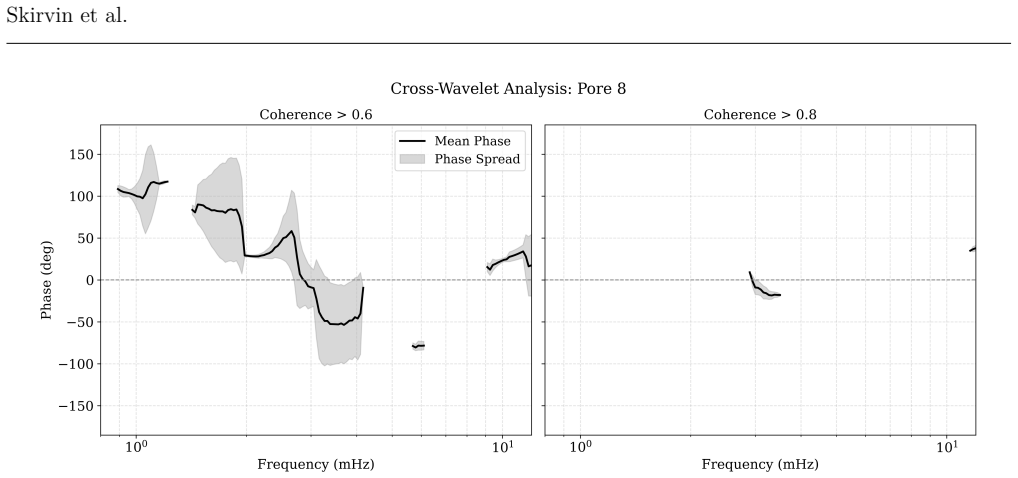
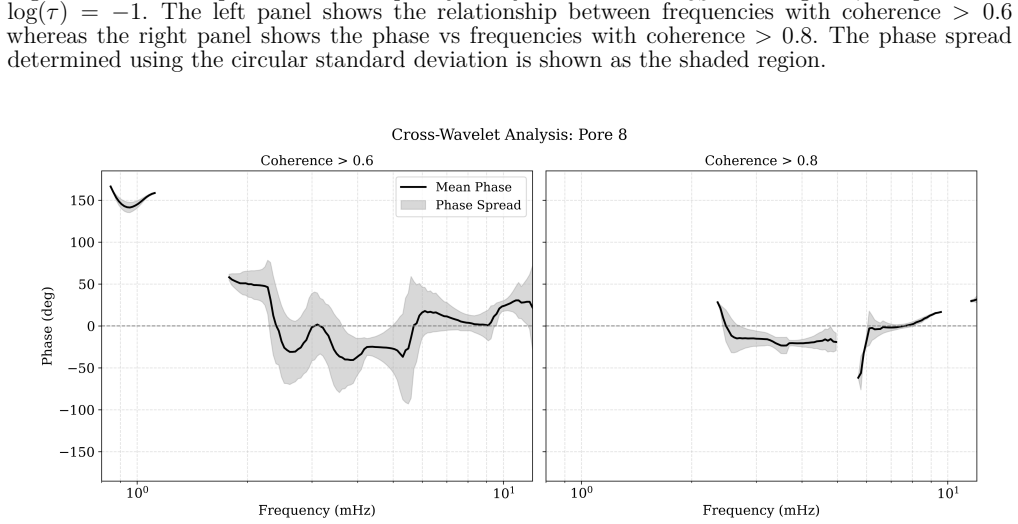
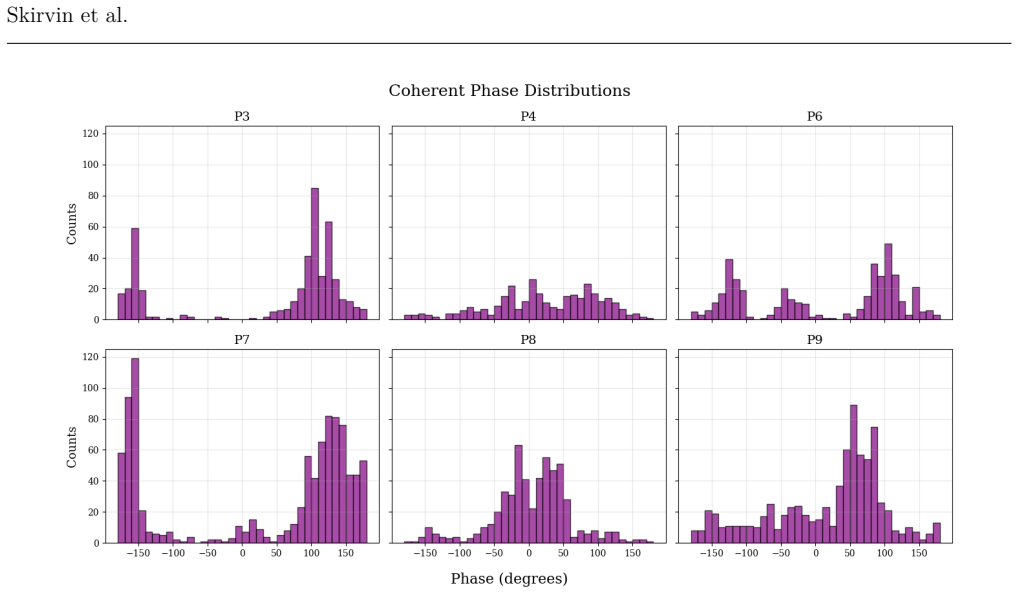
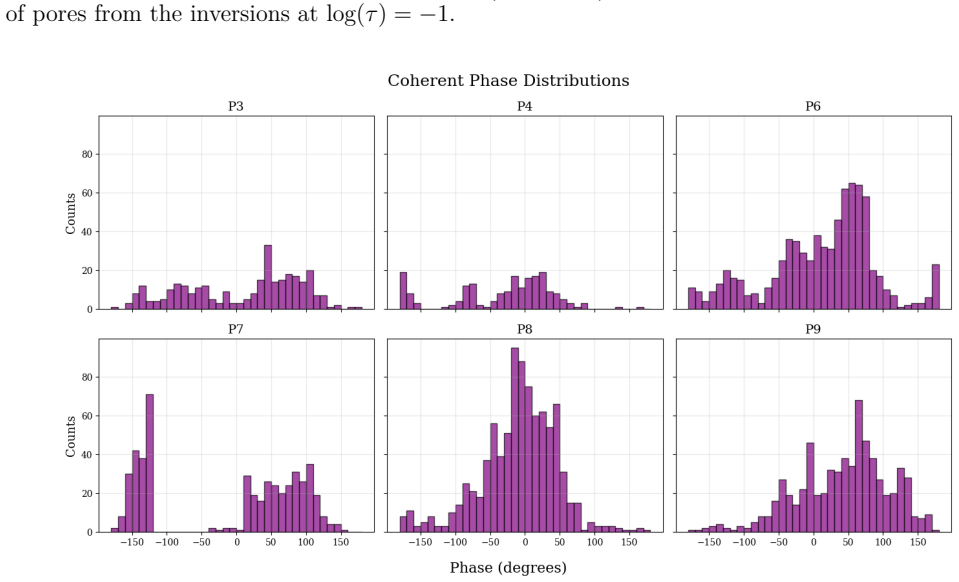
Higher-frequency oscillations exhibit strong coherences with in-phase fluctuations between the line-of-sight magnetic field and geometric height across atmospheric layers, consistent with upward-propagating magneto-acoustic waves, whereas coherent lower-frequency oscillations display significant phase differences that arise from opacity effects contaminating the inversion response.
What carries the argument
Frequency-dependent phase and coherence between the inverted line-of-sight magnetic field (blos) and geometric height (z) obtained from SIR inversions at multiple optical depths.
If this is right
- Magnetic field time series below 6 mHz cannot be read directly as wave propagation without an opacity correction term.
- Energy flux calculations that combine velocity and magnetic signals must apply different weighting or filtering above and below the 6 mHz boundary.
- Multi-layer inversions remain usable for high-frequency waves but require an additional diagnostic layer to isolate opacity-induced shifts at lower frequencies.
- Interpretation pipelines for future high-resolution magnetographs should incorporate an explicit check for frequency-dependent phase jumps before attributing them to wave behavior.
Where Pith is reading between the lines
- Similar opacity-induced phase offsets may appear in other spectral lines or instruments whenever the line formation height varies strongly with temperature or density.
- Forward-modeling studies that inject known waves into realistic atmospheres could quantify how large an opacity swing is needed to reproduce the observed low-frequency lags.
- If the effect is general, existing catalogs of pore oscillations may need re-processing to separate true wave power from inversion artifacts before statistical studies of energy transport are updated.
Load-bearing premise
The phase differences seen at lower frequencies are produced by opacity variations inside the inversion rather than by the actual wave physics or by instrumental or reduction artifacts.
What would settle it
A controlled forward-modeling experiment in which an atmosphere with known upward waves is inverted with and without artificial opacity fluctuations; the low-frequency phase offset should appear only in the opacity-perturbed case.
Figures
read the original abstract
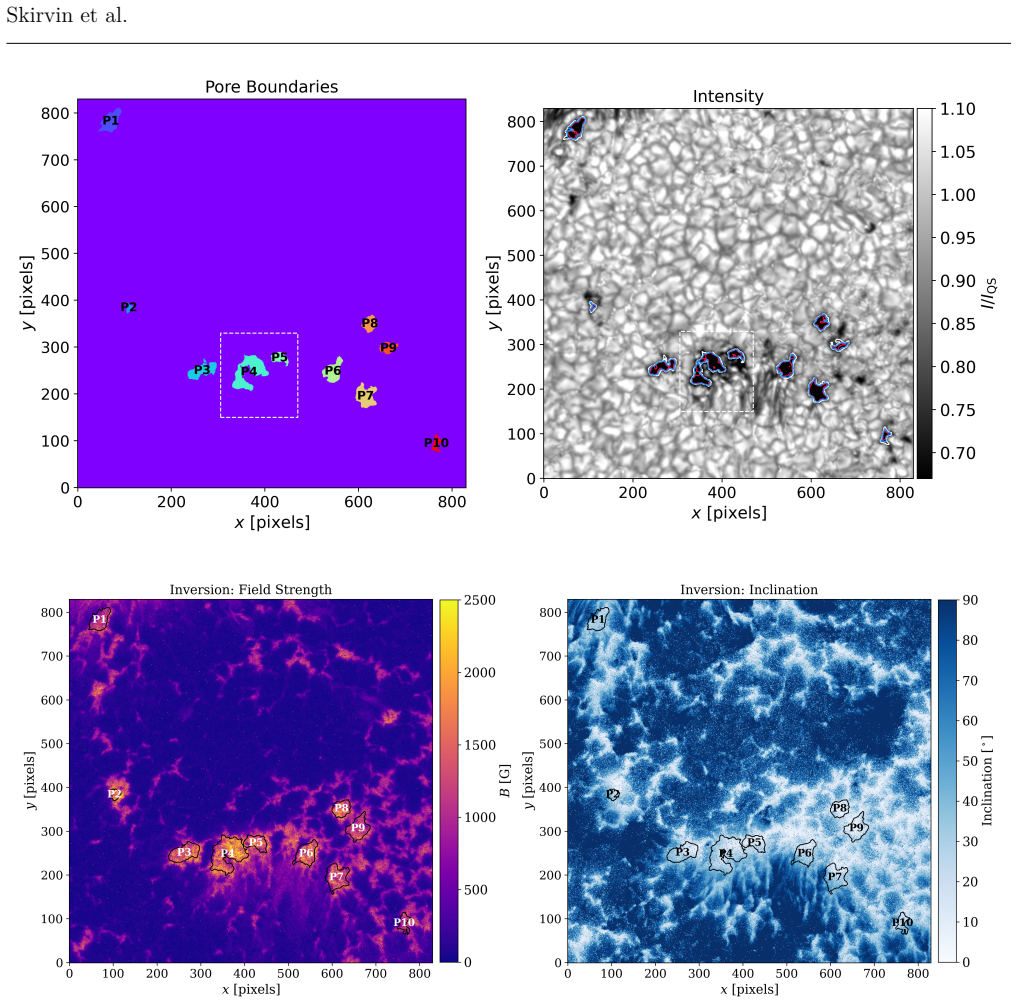
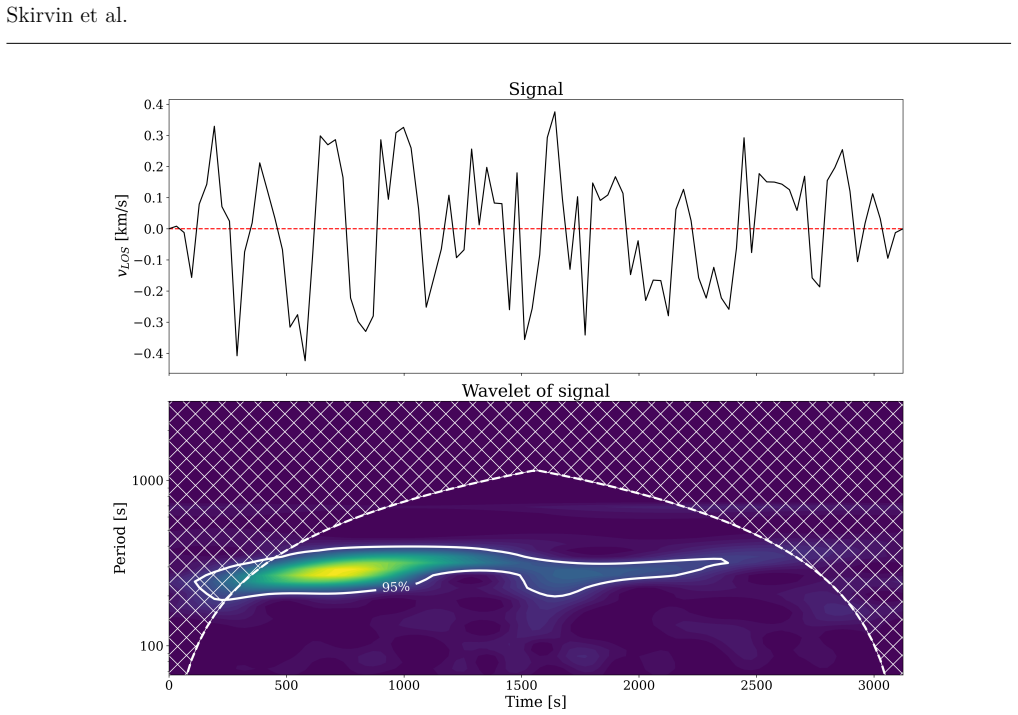
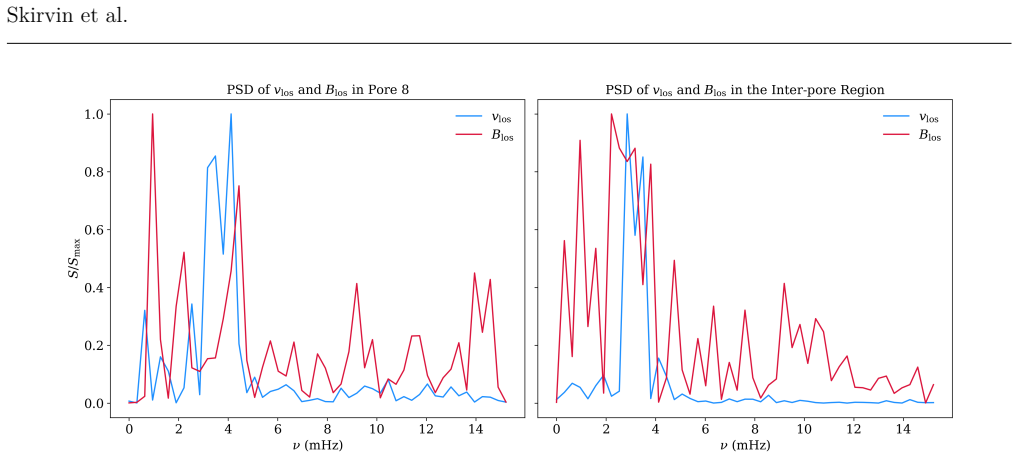
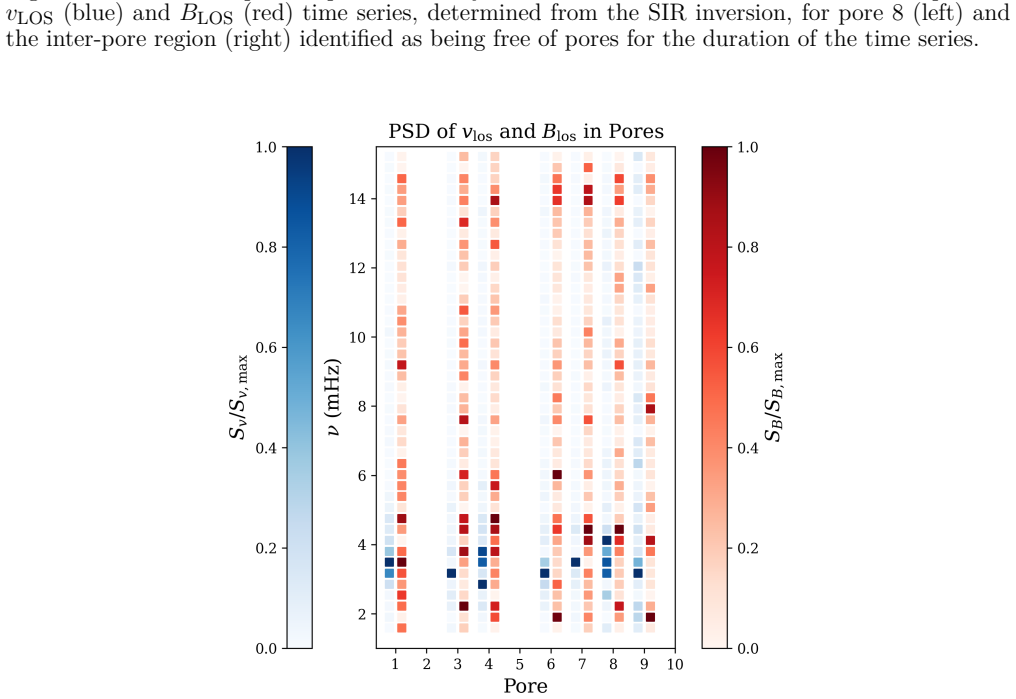
Magnetohydrodynamic wave activity in small-scale magnetic structures, such as solar pores, provides key insights into energy transport in the lower solar atmosphere. This study presents high-resolution observations of ten solar pores contained within a 43 x 43 Mm$^2$ field of view, obtained with the CRISP instrument at the Swedish 1-m Solar Telescope. We investigate the temporal behaviour of the line-of-sight velocity (vlos) and magnetic field (blos) oscillations within the pore structures. Using SIR inversions, we analyse the oscillatory signals at multiple optical depths (log $\tau$ levels) to assess how variations in geometric height (z) and temperature relate to the observed blos fluctuations. Our results reveal that higher-frequency oscillations (> 6 mHz) exhibit strong coherences with in-phase fluctuations between blos and z across atmospheric layers, consistent with upward-propagating magneto-acoustic waves. In contrast, coherent lower-frequency oscillations display significant phase differences, which may arise from opacity effects contaminating the inversion response. These findings highlight the importance of accounting for opacity effects when interpreting magnetic oscillations, with direct implications for forthcoming high-precision magnetic diagnostics from facilities such as DKIST.
Editorial analysis
A structured set of objections, weighed in public.
Referee Report
Summary. The paper analyzes high-resolution CRISP observations of ten solar pores in a 43×43 Mm² FOV, using SIR inversions to examine oscillations in v_los and B_los at multiple log τ levels. It reports that >6 mHz oscillations show strong coherence with in-phase B_los–z fluctuations across layers, consistent with upward-propagating magneto-acoustic waves, whereas lower-frequency coherent signals exhibit phase differences that may result from opacity effects in the inversion response functions.
Significance. If the frequency-dependent phase behavior can be robustly attributed to opacity contamination, the result would identify an important systematic in inversion-based diagnostics of MHD waves in the lower atmosphere and carry implications for high-precision magnetic observations with DKIST. The use of a multi-pore statistical sample is a positive aspect of the observational design.
major comments (2)
- [Results] Results section (phase-difference analysis): The attribution of lower-frequency (<6 mHz) phase differences between B_los and z to opacity effects in SIR inversions is presented without any quantitative test. No synthetic forward modeling, opacity-perturbed response functions, or controlled inversion experiments on known wave fields are described to isolate this mechanism from regularization, height-of-formation shifts, or intrinsic wave physics.
- [Abstract and Results] Abstract and Results: No error bars, coherence spectra, data-exclusion criteria, or quantitative measures (e.g., phase-difference histograms or significance thresholds) are supplied to support the claimed distinction at 6 mHz or the coherence values, preventing assessment of whether the reported frequency dependence is statistically robust.
minor comments (1)
- [Abstract] The abstract states the field of view and number of pores but does not indicate the total duration of the time series or the temporal cadence, both of which are needed to evaluate the frequency resolution around 6 mHz.
Simulated Author's Rebuttal
We thank the referee for their thoughtful comments, which have helped us improve the clarity and robustness of our analysis. We respond to each major comment below.
read point-by-point responses
-
Referee: [Results] Results section (phase-difference analysis): The attribution of lower-frequency (<6 mHz) phase differences between B_los and z to opacity effects in SIR inversions is presented without any quantitative test. No synthetic forward modeling, opacity-perturbed response functions, or controlled inversion experiments on known wave fields are described to isolate this mechanism from regularization, height-of-formation shifts, or intrinsic wave physics.
Authors: We acknowledge that our interpretation of the lower-frequency phase differences as potentially due to opacity effects is based on observational patterns rather than direct quantitative modeling. The manuscript presents this as a possible explanation ('may arise from'), consistent with known limitations of inversion techniques. While we did not perform synthetic forward modeling in this study, as our focus was on analyzing a large observational dataset from ten pores, we agree that such tests would be valuable. In the revised version, we have expanded the discussion to include references to prior work on inversion response functions and explicitly state that the opacity hypothesis requires future validation through simulations. We have also toned down the language to emphasize the observational findings over the causal attribution. revision: partial
-
Referee: [Abstract and Results] Abstract and Results: No error bars, coherence spectra, data-exclusion criteria, or quantitative measures (e.g., phase-difference histograms or significance thresholds) are supplied to support the claimed distinction at 6 mHz or the coherence values, preventing assessment of whether the reported frequency dependence is statistically robust.
Authors: We agree that providing these quantitative details will enhance the statistical rigor of the paper. In the revised manuscript, we have added error bars to the phase difference and coherence plots in the Results section, included example coherence spectra, specified the coherence threshold (> 0.6) used for selecting significant signals, and added histograms of phase differences across the frequency bands with significance levels determined from noise simulations. These additions confirm that the transition at approximately 6 mHz is statistically significant in our sample. revision: yes
Circularity Check
No significant circularity in observational analysis
full rationale
The paper performs an observational study of solar pore oscillations using existing CRISP data and standard SIR inversions. It reports frequency-dependent coherence and phase behaviors between blos and z, then offers an interpretive hypothesis that lower-frequency phase differences 'may arise from opacity effects'. No mathematical derivation, fitted parameter, or prediction is defined in terms of itself; the central claim is an untested attribution rather than a self-referential result. No self-citation chains or ansatzes are invoked as load-bearing steps. The work is self-contained against external data and does not reduce any claimed result to its own inputs by construction.
Axiom & Free-Parameter Ledger
Reference graph
Works this paper leans on
-
[1]
Asplund, M., Grevesse, N., Sauval, A. J., and Scott, P. (2009). The Chemical Composition of the Sun. Annual Review of Astronomy and Astrophysics 47, 481–522. doi:10.1146/annurev.astro.46. 060407.145222 Bailén, F. J., Orozco Suárez, D., and del Toro Iniesta, J. C. (2023). Fabry-Pérot etalons in solar astronomy. A review. Astrophysics and Space Science 368,
-
[2]
I., Vargas Domínguez, S., Utz, D., Veronig, A
doi:10.1007/s10509-023-04212-3 Campos Rozo, J. I., Vargas Domínguez, S., Utz, D., Veronig, A. M., and Hanslmeier, A. (2023). Exploring magnetic field properties at the boundary of solar pores: A comparative study based on SDO-HMI observations. Astronomy & Astrophysics 674, A91. doi:10.1051/0004-6361/202346389 de la Cruz Rodríguez, J., Löfdahl, M. G., Sütt...
-
[3]
doi:10.1088/0004-637X/806/1/132 Grant, S. D. T., Jess, D. B., Stangalini, M., Jafarzadeh, S., Fedun, V., Verth, G., et al. (2022). The Propagation of Coherent Waves Across Multiple Solar Magnetic Pores. The Astrophysical Journal 938,
-
[4]
doi:10.3847/1538-4357/ac91ca Houston, S. J., Jess, D. B., Asensio Ramos, A., Grant, S. D. T., Beck, C., Norton, A. A., et al. (2018). The Magnetic Response of the Solar Atmosphere to Umbral Flashes. The Astrophysical Journal 860,
-
[5]
doi:10.3847/1538-4357/aab366 Frontiers 16 Skirvin et al. Jafarzadeh, S., Jess, D. B., Stangalini, M., Grant, S. D. T., Higham, J. E., Pessah, M. E., et al. (2025). Wave analysis tools. Nature Reviews Methods Primers 5,
-
[6]
doi:10.1038/ s43586-025-00392-0 Jafarzadeh, S., Schiavo, L. A. C. A., Fedun, V., Solanki, S. K., Stangalini, M., Calchetti, D., et al. (2024). Sausage, kink, and fluting magnetohydrodynamic wave modes identified in solar magnetic pores by Solar Orbiter/PHI. Astronomy & Astrophysics 688, A2. doi:10.1051/0004-6361/ 202449685 Jess, D. B., Jafarzadeh, S., Key...
-
[7]
doi:10.1007/s41116-022-00035-6 Jess, D. B., Keys, P. H., Stangalini, M., and Jafarzadeh, S. (2021). High-resolution wave dynamics in the lower solar atmosphere. Philosophical Transactions of the Royal Society of London Series A 379, 20200169. doi:10.1098/rsta.2020.0169 Jess, D. B., Morton, R. J., Verth, G., Fedun, V., Grant, S. D. T., and Giagkiozis, I. (...
-
[8]
doi:10.3847/1538-4357/aab432 Lites, B. W., White, O. R., and Packman, D. (1982). Photoelectric observations of propagating sunspot oscillations. The Astrophysical Journal 253, 386–392. doi:10.1086/159642 Morton, R. J., Erdélyi, R., Jess, D. B., and Mathioudakis, M. (2011). Observations of Sausage Modes in Magnetic Pores. The Astrophysical Journal Letters ...
-
[9]
doi:10.1007/ s41614-023-00118-3 Murabito, M., Stangalini, M., Baker, D., Valori, G., Jess, D. B., Jafarzadeh, S., et al. (2021). Investigating the origin of magnetic perturbations associated with the FIP Effect. Astronomy & Astrophysics 656, A87. doi:10.1051/0004-6361/202141504 Nelson, C. J., Campbell, R. J., and Mathioudakis, M. (2021). Oscillations in t...
-
[10]
doi:10.1086/171862 Frontiers 17 Skirvin et al. Scharmer, G. B., Bjelksjo, K., Korhonen, T. K., Lindberg, B., and Petterson, B. (2003a). The 1-meter Swedish solar telescope. In Innovative Telescopes and Instrumentation for Solar Astrophysics, eds. S. L. Keil and S. V. A vakyan. vol. 4853 of Society of Photo-Optical Instrumentation Engineers (SPIE) Conferen...
-
[11]
International Conference on Applied Physics and Industrial Engineering 2012 Torrence, C
doi:https://doi.org/10.1016/j.phpro.2012.02.317. International Conference on Applied Physics and Industrial Engineering 2012 Torrence, C. and Compo, G. P. (1998). A Practical Guide to Wavelet Analysis. Bulletin of the American Meteorological Society 79, 61–78. doi:10.1175/1520-0477(1998)079<0061:APGTWA> 2.0.CO;2 Van Doorsselaere, T., Srivastava, A. K., An...
-
[12]
1007/s11214-020-00770-y Van Noort, M., Rouppe Van Der Voort, L., and Löfdahl, M
doi:10. 1007/s11214-020-00770-y Van Noort, M., Rouppe Van Der Voort, L., and Löfdahl, M. G. (2005). Solar Image Restoration By Use Of Multi-frame Blind De-convolution With Multiple Objects And Phase Diversity. Solar Physics 228, 191–215. doi:10.1007/s11207-005-5782-z Yadav, N., Cameron, R. H., and Solanki, S. K. (2021). Slow magneto-acoustic waves in simu...
discussion (0)
Sign in with ORCID, Apple, or X to comment. Anyone can read and Pith papers without signing in.