Stress Amplified Resilience: ESG and Joint Fragility in Equity Markets
Pith reviewed 2026-06-27 23:06 UTC · model grok-4.3
The pith
Higher ESG scores lower the probability of joint equity fragility during market stress periods.
A machine-rendered reading of the paper's core claim, the machinery that carries it, and where it could break.
Core claim
The central claim is that ESG functions as a stress-amplified resilience factor in equity markets. In the joint analysis a one-standard-deviation rise in ESG is associated with a 0.92 percentage point drop in the probability of severe cofragility during stress months, roughly 9 percent below baseline. This negative association survives double machine learning adjustment for observable firm traits. Pillar-level results indicate stronger unconditional resilience from environmental scores and clearer stress amplification from social scores.
What carries the argument
The cofragility state variable that registers the joint occurrence of downside returns, volatility spikes, and illiquidity inside the same firm-month.
If this is right
- The ESG association with returns concentrates in the extreme downside tail only during stress months.
- Higher ESG links to smaller volatility spikes when aggregate market conditions weaken.
- The illiquidity channel shows a more persistent ESG association whose relevance grows when market-wide trading deteriorates.
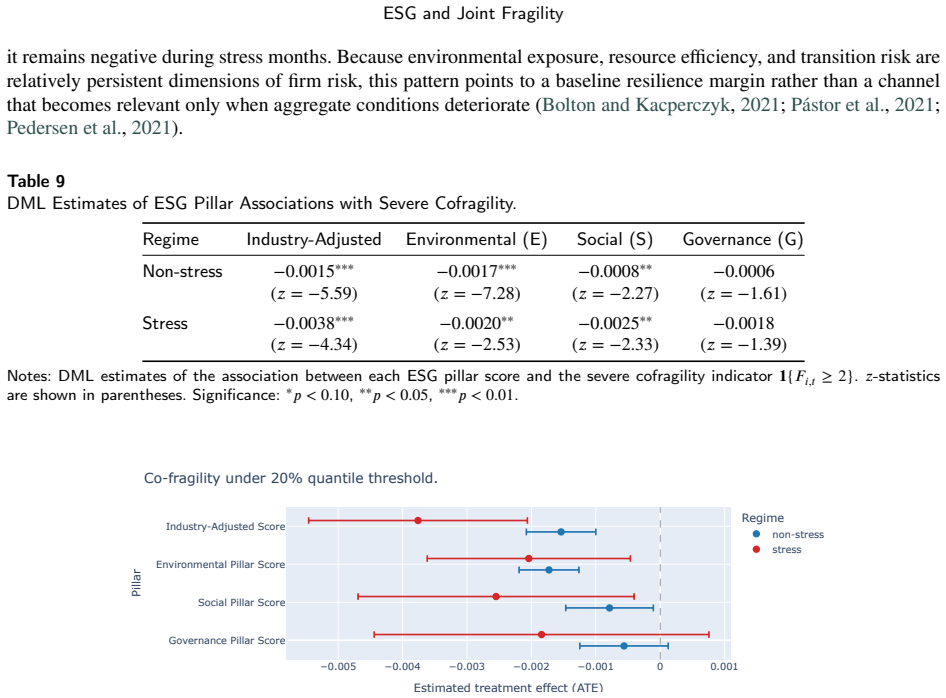
- Environmental pillar scores exhibit stronger baseline resilience while social pillar scores exhibit clearer stress amplification.
Where Pith is reading between the lines
- Portfolio construction could treat ESG scores as inputs to tail-risk overlays that target joint rather than single-channel events.
- Stress-testing frameworks for equity portfolios might add cofragility probabilities as a diagnostic alongside conventional volatility or beta measures.
- Pillar-specific monitoring could guide allocation toward environmental scores for baseline stability and social scores for stress-period protection.
Load-bearing premise
The cofragility state variable accurately captures clustered fragility without substantial measurement error or arbitrary thresholds.
What would settle it
Re-estimating the probability reduction after replacing the joint cofragility indicator with separate channel events or alternative downside thresholds that produce no ESG association would falsify the central result.
Figures
read the original abstract
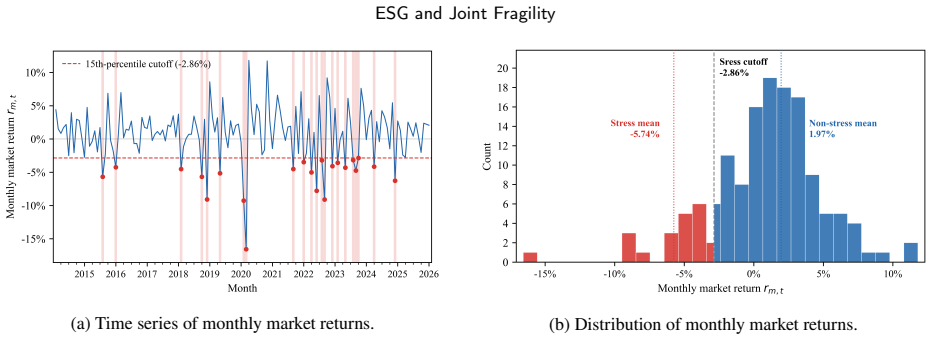
Market stress rarely harms investors through one channel alone. Losses, volatility spikes, and deteriorating tradability often arrive together. We examine whether ESG is associated with lower exposure to clustered fragility in equity markets. Using monthly data on S&P 500 constituents from 2014 to 2025, we study downside returns, volatility, illiquidity, and a cofragility state that captures their joint occurrence within the same firm month. The evidence supports a stress-amplified resilience interpretation rather than an unconditional ESG return premium. In the return channel, the ESG association is concentrated in the extreme downside tail during stress months. In the volatility channel, higher ESG is associated with smaller risk spikes when aggregate conditions are weak. In the illiquidity channel, the association is more persistent, suggesting a liquidity-quality component whose relevance increases when market-wide trading conditions deteriorate. The central evidence comes from the joint analysis: a one-standard-deviation increase in ESG lowers the stress-period probability of severe cofragility by 0.92 percentage points, about 9% relative to the baseline. Double Machine Learning shows a similar negative ESG association after flexible adjustment for observable firm characteristics. Pillar evidence suggests stronger baseline resilience for Environmental scores and clearer stress amplification for Social scores. Overall, the findings characterize ESG as a multi-channel fragility signal for tail-risk monitoring, stress analysis, and pillar-level ESG assessment.
Editorial analysis
A structured set of objections, weighed in public.
Referee Report
Summary. The paper claims that ESG is associated with lower exposure to clustered fragility (joint downside returns, volatility spikes, and illiquidity within the same firm-month) in equity markets, with effects amplified during stress periods. Using monthly S&P 500 data 2014-2025, separate channel analyses and a joint cofragility indicator show that a 1-SD ESG increase reduces stress-period severe cofragility probability by 0.92 pp (~9% relative to baseline). Double Machine Learning yields a similar negative association after flexible controls for firm characteristics; pillar results suggest stronger baseline effects for Environmental scores and stress amplification for Social scores. The interpretation favors stress-amplified resilience over an unconditional ESG premium.
Significance. If the central estimate holds under scrutiny, the work offers a multi-channel view of ESG as a fragility signal relevant to tail-risk monitoring and stress analysis, distinguishing stress-period effects from unconditional ones. The application of Double Machine Learning for high-dimensional adjustment is a clear methodological strength, as is the joint (rather than separate) fragility metric.
major comments (2)
- [Cofragility definition] Cofragility definition (section introducing the joint state variable): the indicator requires explicit thresholds/quantiles for each of the three components (downside returns, volatility spikes, illiquidity). The headline 0.92 pp reduction is reported for 'severe cofragility'; without documented robustness to plausible alternative cutoffs (e.g., 5th vs. 10th percentile or different volatility/illiquidity measures), it is unclear whether the result is driven by threshold choice. This is load-bearing for the joint-analysis claim.
- [DML results] Double Machine Learning results (section reporting the 0.92 pp estimate): the specification, exact functional form of the cofragility outcome, choice of nuisance estimators, and handling of standard errors or clustering are not detailed enough to assess whether the partial effect survives the flexible controls. The stress-period subsample definition and any data exclusions also need explicit reporting, as they directly affect the probability reduction.
minor comments (2)
- [Abstract] The abstract states the sample ends in 2025; clarify whether this includes partial-year data or ends in 2024, and state the exact number of firm-months.
- Table or figure presenting baseline cofragility probabilities by stress vs. non-stress months would help readers gauge the economic magnitude of the 0.92 pp shift.
Simulated Author's Rebuttal
We thank the referee for the constructive comments. We address each major comment below and will revise the manuscript to incorporate the requested clarifications and checks.
read point-by-point responses
-
Referee: [Cofragility definition] Cofragility definition (section introducing the joint state variable): the indicator requires explicit thresholds/quantiles for each of the three components (downside returns, volatility spikes, illiquidity). The headline 0.92 pp reduction is reported for 'severe cofragility'; without documented robustness to plausible alternative cutoffs (e.g., 5th vs. 10th percentile or different volatility/illiquidity measures), it is unclear whether the result is driven by threshold choice. This is load-bearing for the joint-analysis claim.
Authors: We agree that explicit thresholds for the three components of the joint state variable and robustness to alternative cutoffs are necessary to support the headline result on severe cofragility. The manuscript defines the cofragility indicator in the section introducing the joint state variable, but we acknowledge that the current version does not report sensitivity to plausible alternatives. In the revision we will add explicit documentation of the quantiles employed and include robustness tables using alternative cutoffs (e.g., 5th vs. 10th percentile) and alternative volatility and illiquidity measures. These checks will appear in a new appendix. revision: yes
-
Referee: [DML results] Double Machine Learning results (section reporting the 0.92 pp estimate): the specification, exact functional form of the cofragility outcome, choice of nuisance estimators, and handling of standard errors or clustering are not detailed enough to assess whether the partial effect survives the flexible controls. The stress-period subsample definition and any data exclusions also need explicit reporting, as they directly affect the probability reduction.
Authors: We agree that greater detail on the DML implementation is required for readers to evaluate the 0.92 pp estimate. The manuscript reports that Double Machine Learning yields a similar negative association after flexible controls, but does not fully specify the outcome functional form, nuisance estimators, standard-error and clustering procedures, stress-period subsample definition, or data exclusions. In the revision we will expand the relevant methods subsection to provide these details explicitly, including the precise definition of the stress-period subsample and any sample restrictions applied. revision: yes
Circularity Check
No significant circularity; empirical estimate stands on its own
full rationale
The paper's central claim is an empirical association estimated via double machine learning between ESG scores and the probability of a constructed cofragility state. This is a regression output, not a quantity that reduces by the paper's own equations to a fitted parameter or self-citation. No self-definitional loops, fitted-input predictions, uniqueness theorems, or ansatz smuggling appear in the provided text. Threshold choices for defining downside returns, volatility spikes, and illiquidity are measurement decisions that affect the dependent variable but do not make the reported coefficient equivalent to its inputs by construction. The derivation chain is self-contained against external data and standard econometric methods.
Axiom & Free-Parameter Ledger
Reference graph
Works this paper leans on
-
[1]
Journal of Sustainable Finance & Investment , volume=
ESG and Financial Performance: Aggregated Evidence from More than 2000 Empirical Studies , author=. Journal of Sustainable Finance & Investment , volume=. 2015 , doi=
2000
-
[2]
Journal of Corporate Finance , volume=
Firms and Social Responsibility: A Review of ESG and CSR Research in Corporate Finance , author=. Journal of Corporate Finance , volume=. 2021 , doi=
2021
-
[3]
Journal of Financial Economics , volume=
Sustainable Investing in Equilibrium , author=. Journal of Financial Economics , volume=. 2021 , doi=
2021
-
[4]
Journal of Financial Economics , volume=
Responsible Investing: The ESG-Efficient Frontier , author=. Journal of Financial Economics , volume=. 2021 , doi=
2021
-
[5]
Journal of Banking & Finance , volume=
Corporate Social Responsibility and Stock Price Crash Risk , author=. Journal of Banking & Finance , volume=. 2014 , doi=
2014
-
[6]
The Review of Corporate Finance Studies , volume=
Resiliency of Environmental and Social Stocks: An Analysis of the Exogenous COVID-19 Market Crash , author=. The Review of Corporate Finance Studies , volume=. 2020 , doi=
2020
-
[7]
Journal of Business Finance & Accounting , volume=
ESG Did Not Immunize Stocks During the COVID-19 Crisis, but Investments in Intangible Assets Did , author=. Journal of Business Finance & Accounting , volume=. 2021 , doi=
2021
-
[8]
Finance Research Letters , volume=
ESG ETFs and the COVID-19 Stock Market Crash of 2020: Did Clean Funds Fare Better? , author=. Finance Research Letters , volume=. 2022 , doi=
2020
-
[9]
Journal of International Financial Markets, Institutions and Money , volume=
ESG, Liquidity, and Stock Returns , author=. Journal of International Financial Markets, Institutions and Money , volume=. 2022 , doi=
2022
-
[10]
International Review of Financial Analysis , volume=
Can We Enhance Investment with ESG? , author=. International Review of Financial Analysis , volume=. 2025 , doi=
2025
-
[11]
Journal of Financial Economics , volume=
Stock Price Fragility , author=. Journal of Financial Economics , volume=. 2011 , doi=
2011
-
[12]
The Review of Financial Studies , volume=
Market Liquidity and Funding Liquidity , author=. The Review of Financial Studies , volume=. 2009 , doi=
2009
-
[13]
Journal of Financial Economics , volume=
Asset Fire Sales (and Purchases) in Equity Markets , author=. Journal of Financial Economics , volume=. 2007 , doi=
2007
-
[14]
The Journal of Finance , volume=
Fire-Sale Spillovers in Debt Markets , author=. The Journal of Finance , volume=. 2021 , doi=
2021
-
[15]
Journal of Financial Markets , volume=
Illiquidity and Stock Returns: Cross-Section and Time-Series Effects , author=. Journal of Financial Markets , volume=. 2002 , doi=
2002
-
[16]
Journal of Financial Economics , volume=
Commonality in Liquidity , author=. Journal of Financial Economics , volume=. 2000 , doi=
2000
-
[17]
The Journal of Finance , volume=
Social Capital, Trust, and Firm Performance: The Value of Corporate Social Responsibility During the Financial Crisis , author=. The Journal of Finance , volume=. 2017 , doi=
2017
-
[18]
Journal of Financial Economics , volume=
Corporate Immunity to the COVID-19 Pandemic , author=. Journal of Financial Economics , volume=. 2021 , doi=
2021
-
[19]
The Econometrics Journal , volume =
Double/Debiased Machine Learning for Treatment and Structural Parameters , author =. The Econometrics Journal , volume =. 2018 , doi =
2018
-
[20]
Journal of Financial Economics , volume =
R2 Around the World: New Theory and New Tests , author =. Journal of Financial Economics , volume =. 2006 , doi =
2006
-
[21]
Journal of Financial Economics , volume =
Opaque Financial Reports, R2, and Crash Risk , author =. Journal of Financial Economics , volume =. 2009 , doi =
2009
-
[22]
Strategic Management Journal , volume =
The Relationship Between Corporate Social Responsibility and Shareholder Value: An Empirical Test of the Risk Management Hypothesis , author =. Strategic Management Journal , volume =. 2009 , doi =
2009
-
[23]
International Review of Financial Analysis , volume=
ESG Investment Preference and Fund Vulnerability , author=. International Review of Financial Analysis , volume=. 2024 , doi=
2024
-
[24]
Journal of Financial Economics , volume=
The Price of Sin: The Effects of Social Norms on Markets , author=. Journal of Financial Economics , volume=. 2009 , doi=
2009
-
[25]
Journal of Financial Economics , volume=
Do Investors Care About Carbon Risk? , author=. Journal of Financial Economics , volume=. 2021 , doi=
2021
-
[26]
Asia-Pacific Journal of Financial Studies , volume =
ESG and Stock Price Crash Risk: Role of Financial Constraints , author =. Asia-Pacific Journal of Financial Studies , volume =. 2021 , doi =
2021
-
[27]
Finance Research Letters , volume=
ESG Rating and Stock Price Crash Risk: Evidence from China , author=. Finance Research Letters , volume=. 2022 , doi=
2022
-
[28]
International Review of Financial Analysis , volume=
Multi-dimensional Corporate Social Responsibilities and Stock Price Crash Risk: Evidence from China , author=. International Review of Financial Analysis , volume=. 2021 , doi=
2021
-
[29]
International Review of Financial Analysis , volume=
News-based ESG Sentiment and Stock Price Crash Risk , author=. International Review of Financial Analysis , volume=. 2023 , doi=
2023
-
[30]
International Review of Financial Analysis , volume=
Environmental Engagement and Stock Price Crash Risk: Evidence from the European Banking Industry , author=. International Review of Financial Analysis , volume=. 2023 , doi=
2023
-
[31]
International Review of Financial Analysis , volume=
Issuing Bonds During the COVID-19 Pandemic: Was There an ESG Premium? , author=. International Review of Financial Analysis , volume=. 2023 , doi=
2023
-
[32]
Review of Finance , volume=
Aggregate Confusion: The Divergence of ESG Ratings , author=. Review of Finance , volume=. 2022 , doi=
2022
-
[33]
International Review of Financial Analysis , volume=
News or Noise? ESG Disclosure and Stock Price Synchronicity , author=. International Review of Financial Analysis , volume=. 2024 , doi=
2024
-
[34]
Journal of Financial Economics , volume=
Sustainable Investing with ESG Rating Uncertainty , author=. Journal of Financial Economics , volume=. 2022 , doi=
2022
-
[35]
Financial Analysts Journal , volume=
ESG Rating Disagreement and Stock Returns , author=. Financial Analysts Journal , volume=. 2021 , doi=
2021
-
[36]
International Review of Financial Analysis , volume =
The Impact of ESG Rating Divergence on Stock Price Crash Risk , author =. International Review of Financial Analysis , volume =. 2025 , doi =
2025
-
[37]
International Review of Financial Analysis , volume=
Liquidity, Implied Volatility and Tail Risk: A Comparison of Liquidity Measures , author=. International Review of Financial Analysis , volume=. 2020 , doi=
2020
-
[38]
The Review of Financial Studies , volume=
Measuring Systemic Risk , author=. The Review of Financial Studies , volume=. 2017 , doi=
2017
-
[39]
International Review of Financial Analysis , volume=
The ESG Effect on the Cost of Debt Financing: A Sharp RD Analysis , author=. International Review of Financial Analysis , volume=. 2022 , doi=
2022
-
[40]
International Review of Financial Analysis , volume=
ESG Performance and Corporate Risk-Taking: Evidence from China , author=. International Review of Financial Analysis , volume=. 2023 , doi=
2023
-
[41]
Forecasting crashes: trading volume, past returns, and conditional skewness in stock prices , journal =. 2001 , issn =. doi:https://doi.org/10.1016/S0304-405X(01)00066-6 , author =
-
[42]
Corporate tax avoidance and stock price crash risk: Firm-level analysis , journal =. 2011 , issn =. doi:https://doi.org/10.1016/j.jfineco.2010.07.007 , author =
-
[43]
Journal of Financial and Quantitative Analysis , volume=
Stock Liquidity and Stock Price Crash Risk , author=. Journal of Financial and Quantitative Analysis , volume=. 2017 , doi=
2017
-
[44]
Econometrica , volume =
Regression Quantiles , author =. Econometrica , volume =. 1978 , doi =
1978
-
[45]
The Jackknife and the Bootstrap for General Stationary Observations , journal =
K. The Jackknife and the Bootstrap for General Stationary Observations , journal =. 1989 , doi =
1989
-
[46]
Journal of the Royal Statistical Society: Series B (Methodological) , volume =
Regression Models for Ordinal Data , author =. Journal of the Royal Statistical Society: Series B (Methodological) , volume =. 1980 , doi =
1980
-
[47]
The Quarterly Journal of Economics , volume=
Corporate Governance and Equity Prices , author=. The Quarterly Journal of Economics , volume=. 2003 , doi=
2003
-
[48]
Colin and Miller, Douglas L
Cameron, A. Colin and Miller, Douglas L. , title =. 2015 , doi =. https://jhr.uwpress.org/content/50/2/317.full.pdf , journal =
2015
-
[49]
The Journal of Finance , volume=
Do Investors Value Sustainability? A Natural Experiment Examining Ranking and Fund Flows , author=. The Journal of Finance , volume=. 2019 , doi=
2019
-
[50]
The Accounting Review , volume=
Why Is Corporate Virtue in the Eye of The Beholder? The Case of ESG Ratings , author=. The Accounting Review , volume=. 2022 , doi=
2022
-
[51]
Finance Research Letters , volume=
Analyst following and greenwashing decision , author=. Finance Research Letters , volume=. 2023 , publisher=
2023
discussion (0)
Sign in with ORCID, Apple, or X to comment. Anyone can read and Pith papers without signing in.