Mountain Muography for China Jinping Underground Laboratory
Pith reviewed 2026-06-27 23:01 UTC · model grok-4.3
The pith
Cosmic muons detected deep underground reconstruct a directional opacity map of the mountain above that matches satellite terrain models.
A machine-rendered reading of the paper's core claim, the machinery that carries it, and where it could break.
Core claim
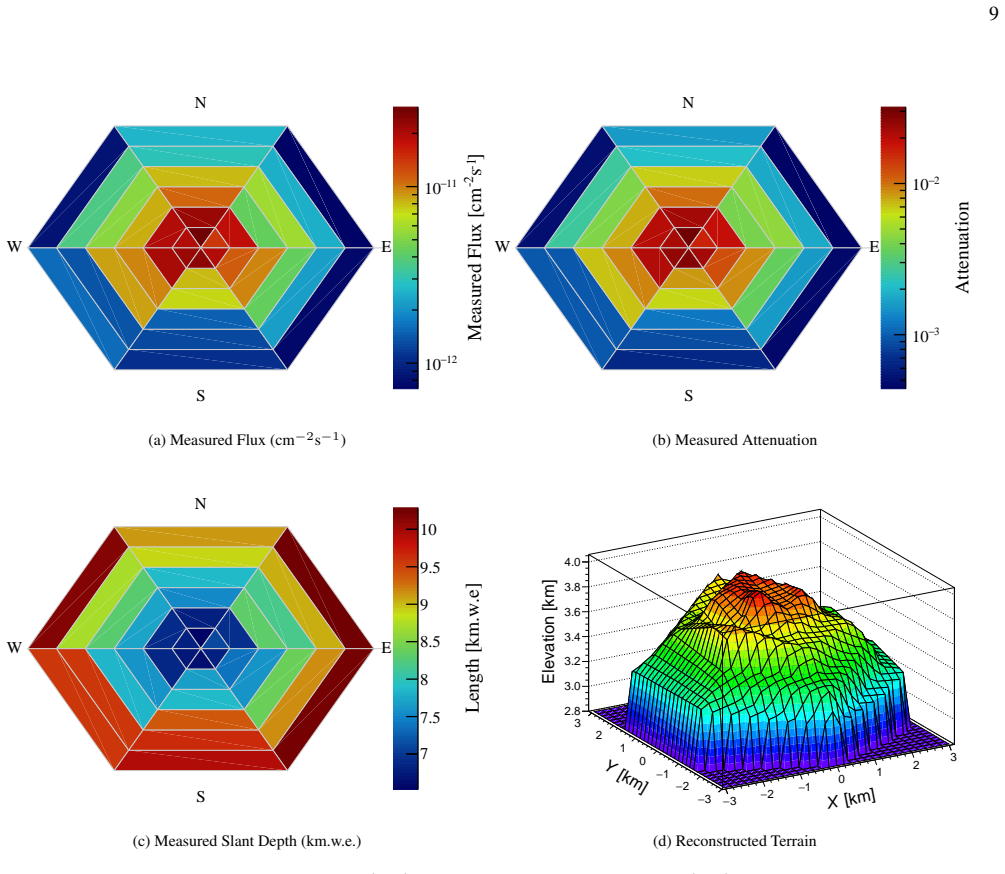
By correlating the predicted surface muon flux distributions with the underground measurements, the authors reconstruct a directional opacity map that constrains the density structure of the overburden and shows excellent agreement with satellite-derived terrain models. This establishes the feasibility of muography at extreme depths with kilometer-scale overburden and provides a validated overburden model for predicting total muon fluxes in multiple experimental halls.
What carries the argument
Directional opacity map obtained by correlating predicted surface muon fluxes with underground detector counts.
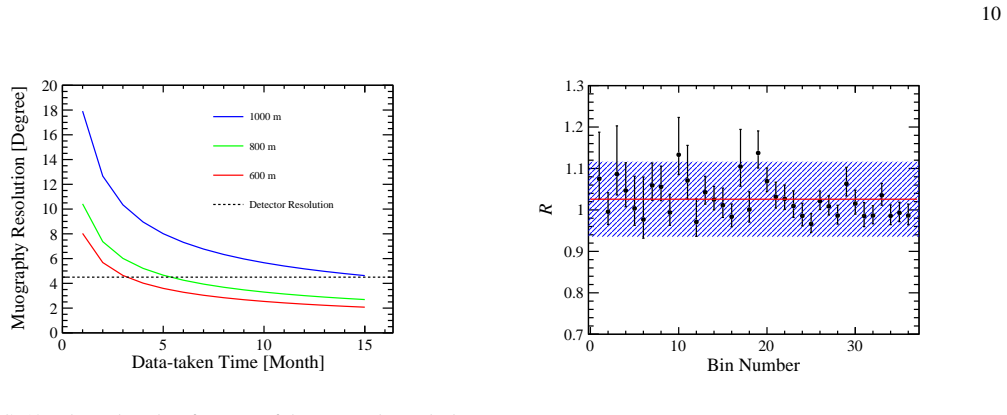
If this is right
- Muography becomes practical for non-invasive density mapping beneath kilometer-scale overburden.
- The method supplies a 3 km lateral range density map at approximately 4.5 degree angular resolution.
- Validated overburden models allow calculation of expected muon backgrounds for physics experiments in multiple halls.
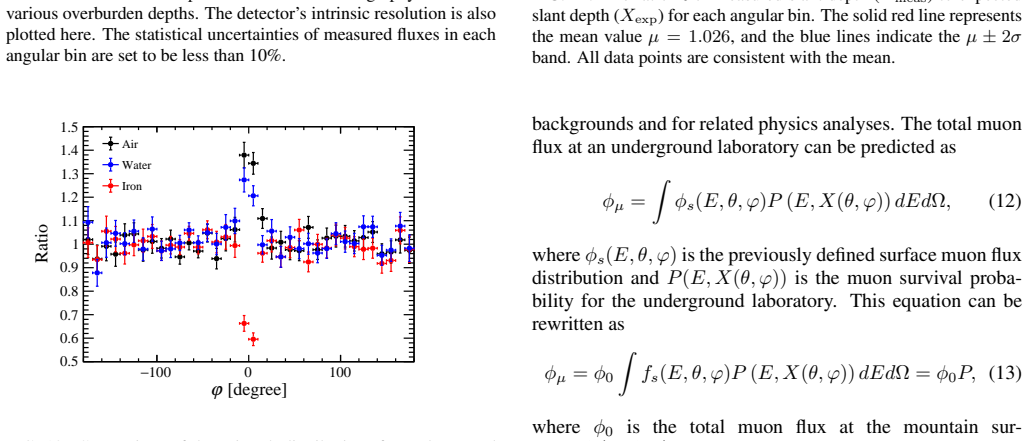
- The same correlation technique supplies a template for geophysical surveys at other large underground sites.
Where Pith is reading between the lines
- Repeated muon measurements over time could detect slow changes in overburden density such as water content shifts.
- The approach could be combined with surface gravity or seismic data to resolve three-dimensional density variations inside the mountain.
- Angular resolution limits mean only density features larger than a few hundred meters across are reliably mapped.
Load-bearing premise
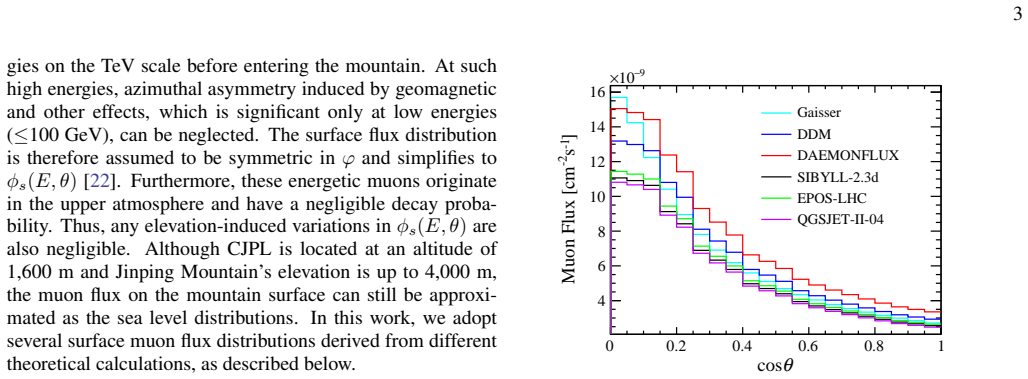
Surface muon flux distributions can be predicted from terrain models with enough accuracy that differences between prediction and underground data arise from real density variations rather than errors in the surface model.
What would settle it
An independent in-situ density measurement at any point inside the mountain that deviates from the value implied by the muon-derived opacity map at the corresponding direction would invalidate the reconstruction.
Figures
read the original abstract
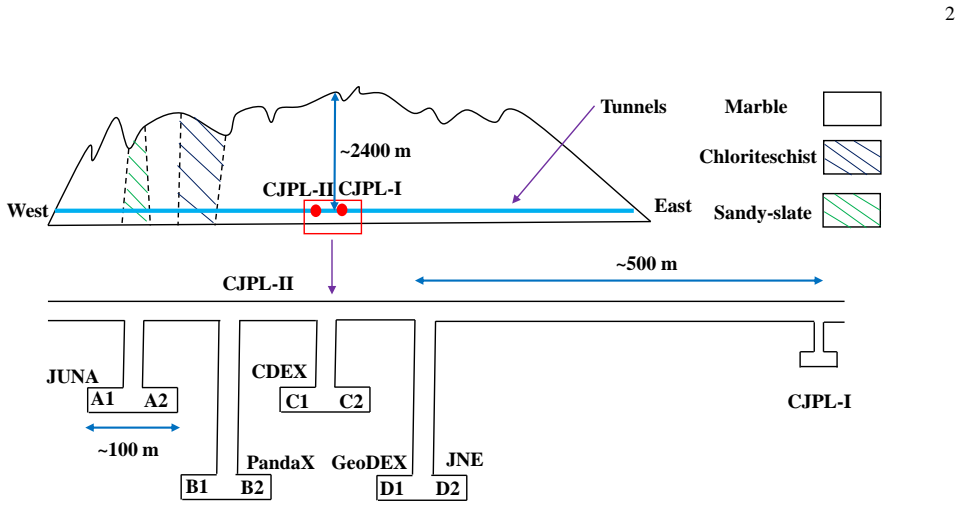
The China Jinping Underground Laboratory (CJPL), located $\sim 2,400$~m beneath Jinping Mountain, is one of the world's deepest and largest ($\sim 300{,}000~\mathrm{m}^3$) underground facilities, hosting dark matter, nuclear astrophysics, and neutrino experiments. We report the first muon radiography (muography) conducted at this extraordinary depth. Cosmic muons detected by a one-ton prototype developed for the Jinping Neutrino Experiment were used to perform non-invasive subsurface density mapping over a 3~km lateral range. The 1.3~m diameter detector provides nearly isotropic acceptance and an angular resolution of $\sim 4.5^\circ$. By correlating the predicted surface muon flux distributions with the underground measurements, we reconstruct a directional opacity map that constrains the density structure of the overburden and shows excellent agreement with satellite-derived terrain models. This work demonstrates the feasibility of muography at extreme depths with kilometer-scale overburden and establishes a robust methodology for future geophysical applications and large-scale facilities, such as the full Jinping Neutrino Experiment. Based on this validated overburden model, we further predict the total muon fluxes for the eight experimental halls in CJPL-II, providing essential input for their physics programs.
Editorial analysis
A structured set of objections, weighed in public.
Referee Report
Summary. The paper reports the first muon radiography (muography) performed at the China Jinping Underground Laboratory (CJPL) at ~2400 m depth. Using a one-ton prototype detector with ~4.5° angular resolution, the authors correlate predicted surface muon flux distributions (from satellite terrain models plus transport calculations) with underground rate measurements to reconstruct a directional opacity map of the overburden. They claim this map shows excellent agreement with satellite-derived terrain models, demonstrate feasibility at extreme depths, and provide predicted muon fluxes for the eight halls of CJPL-II.
Significance. If the quantitative validation holds, the result would establish the first successful muography at kilometer-scale overburden, supplying a validated density model for background estimation in dark-matter and neutrino experiments at CJPL-II and opening a non-invasive geophysical tool for large underground sites. The work supplies no machine-checked proofs or parameter-free derivations, but the experimental demonstration at this depth would be a concrete advance if the reconstruction uncertainties are shown to be sub-dominant.
major comments (2)
- [Abstract] Abstract: the central claim of 'excellent agreement' between the reconstructed directional opacity map and satellite-derived terrain models is stated without any quantitative metric (reduced χ² per angular bin, residual map, goodness-of-fit value, or error bars on the opacity). Because the reconstruction explicitly uses the same terrain models to predict the surface flux that is then compared to data, the absence of these numbers prevents verification that residuals reflect density variations rather than transport or discretization systematics.
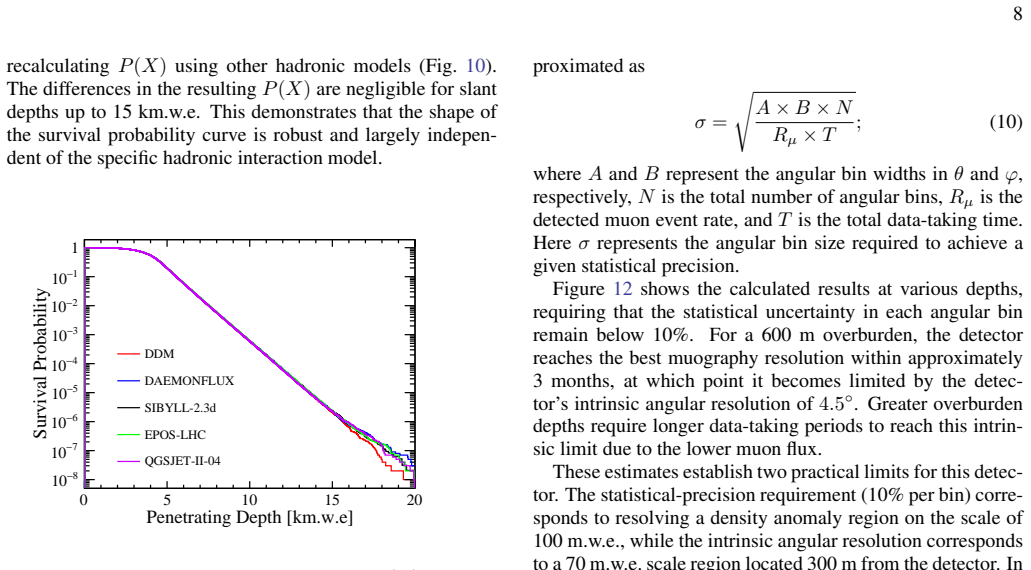
- [Reconstruction method] Reconstruction section (method description following the abstract): the correlation step that converts measured underground rates into directional opacity is presented without the explicit algorithm, binning choices, data-exclusion criteria, or propagation of uncertainties from the high-energy muon spectrum and rock Z/A. At CJPL depths only muons ≳ few TeV survive; the survival probability is exponentially sensitive to these inputs, so the missing details are load-bearing for the claim that the map constrains overburden density structure.
minor comments (1)
- [Abstract] Abstract: the detector diameter (1.3 m) and claimed near-isotropic acceptance are stated without a supporting figure or calculation showing how the angular resolution of ~4.5° is obtained or how acceptance varies with zenith angle at these depths.
Simulated Author's Rebuttal
We thank the referee for the constructive comments on our manuscript. We address each major point below and will revise the paper to incorporate quantitative agreement metrics and expanded methodological details as requested.
read point-by-point responses
-
Referee: [Abstract] Abstract: the central claim of 'excellent agreement' between the reconstructed directional opacity map and satellite-derived terrain models is stated without any quantitative metric (reduced χ² per angular bin, residual map, goodness-of-fit value, or error bars on the opacity). Because the reconstruction explicitly uses the same terrain models to predict the surface flux that is then compared to data, the absence of these numbers prevents verification that residuals reflect density variations rather than transport or discretization systematics.
Authors: We agree that a quantitative metric is needed to support the claim. In revision we will add a reduced χ² value (or equivalent goodness-of-fit statistic), residual maps, and error bars on the opacity in both the abstract and results section. We will also clarify that the terrain model supplies the input flux prediction while the data-driven opacity map is compared to the same model; the comparison tests consistency rather than being fully independent, and the added metrics will allow readers to assess whether residuals exceed expected systematics. revision: yes
-
Referee: [Reconstruction method] Reconstruction section (method description following the abstract): the correlation step that converts measured underground rates into directional opacity is presented without the explicit algorithm, binning choices, data-exclusion criteria, or propagation of uncertainties from the high-energy muon spectrum and rock Z/A. At CJPL depths only muons ≳ few TeV survive; the survival probability is exponentially sensitive to these inputs, so the missing details are load-bearing for the claim that the map constrains overburden density structure.
Authors: We accept that the method section requires additional explicit detail. The revised manuscript will expand the reconstruction description to specify the correlation algorithm, angular binning, data-exclusion criteria, and the propagation of uncertainties arising from the high-energy muon spectrum and rock Z/A values. We will also include a brief sensitivity study showing how variations in these inputs affect the derived opacity map. revision: yes
Circularity Check
Opacity map reconstruction correlates terrain-model predictions with data, rendering subsequent agreement with same models partially dependent
specific steps
-
fitted input called prediction
[Abstract]
"By correlating the predicted surface muon flux distributions with the underground measurements, we reconstruct a directional opacity map that constrains the density structure of the overburden and shows excellent agreement with satellite-derived terrain models."
Predicted fluxes originate from the satellite terrain models; the opacity map is obtained by fitting/correlating those predictions to the measured rates. The resulting map is then claimed to agree with the same terrain models, so the agreement is a direct statistical consequence of the correlation when data and predictions are close, rather than an independent validation of the density structure.
full rationale
The paper's load-bearing reconstruction step uses surface muon flux predictions (generated from satellite terrain models) correlated against underground measurements to produce the directional opacity map. This map is then asserted to show excellent agreement with the identical terrain models. Because the correlation procedure directly adjusts the map to reconcile data with the model predictions, close data-model agreement necessarily produces a map that aligns with the input terrain, making the validation step partially tautological rather than an independent external check. No equations or self-citations are quoted that would raise the score further, and the method retains some independent content from the actual underground counting rates.
Axiom & Free-Parameter Ledger
axioms (1)
- domain assumption Cosmic muon flux at surface can be accurately modeled from terrain topography alone
Reference graph
Works this paper leans on
-
[1]
Shiyong, S
W. Shiyong, S. Manbin, and W. Jian, Bulletin of engineering geology and the environment69, 325 (2010)
2010
-
[2]
J.-P. Chenget al., Ann. Rev. Nucl. Part. Sci.67, 231 (2017), arXiv:1801.00587 [hep-ex]
Pith/arXiv arXiv 2017
-
[3]
Z. H. Zhanget al.(CDEX), Phys. Rev. D108, 052006 (2023), arXiv:2211.07477 [hep-ex]
arXiv 2023
-
[4]
X. Cuiet al.(PandaX-II), Phys. Rev. Lett.128, 171801 (2022), arXiv:2112.08957 [hep-ex]
arXiv 2022
-
[5]
Y . Wuet al., Nucl. Instrum. Meth. A1054, 168400 (2023), arXiv:2212.13158 [hep-ex]
arXiv 2023
-
[6]
X. P. Genget al.(CDEX), JCAP07, 009, arXiv:2309.01843 [hep-ex]
-
[7]
Y . Menget al.(PandaX-4T), Phys. Rev. Lett.127, 261802 (2021), arXiv:2107.13438 [hep-ex]
arXiv 2021
-
[8]
J. F. Beacomet al.(JNE), Chin. Phys. C41, 023002 (2017), arXiv:1602.01733 [physics.ins-det]
Pith/arXiv arXiv 2017
-
[9]
B. Gaoet al.(JUNA), Phys. Rev. Lett.129, 132701 (2022), arXiv:2210.03222 [nucl-ex]
arXiv 2022
-
[10]
Xieet al., International Journal of Mining Science and Tech- nology34, 1 (2024)
H. Xieet al., International Journal of Mining Science and Tech- nology34, 1 (2024)
2024
-
[11]
W. Chen, L. Ma, J.-H. Chen, and H.-Z. Huang, Eur. Phys. J. C 82, 549 (2022), arXiv:2206.09288 [physics.ins-det]
arXiv 2022
-
[12]
X. Mao, Z. Li, S. Dong, J. Li, J. Zhang, J. Pang, Y . Cheng, B. Liao, X. Ouyang, and R. Han, Nucl. Instrum. Meth. A1055, 168391 (2023)
2023
-
[13]
N. M. Shapiro, M. Campillo, L. Stehly, and M. H. Ritzwoller, Science307, 1615 (2005)
2005
-
[14]
Barnoud, V
A. Barnoud, V . Cayol, V . Niess, C. C ˆarloganu, P. Leli `evre, P. Labazuy, and E. Le M ´en´edeu, Geophysical Journal Interna- tional218, 2179 (2019)
2019
-
[15]
Kaiser, Philosophical Transactions of the Royal Society A 377, 20180049 (2019)
R. Kaiser, Philosophical Transactions of the Royal Society A 377, 20180049 (2019)
2019
-
[16]
T. K. Gaisser, R. Engel, and E. Resconi,Cosmic Rays and Par- ticle Physics: 2nd Edition(Cambridge University Press, 2016)
2016
-
[17]
Nagamine, M
K. Nagamine, M. Iwasaki, K. Shimomura, and K. Ishida, Nucl. Instrum. Meth. A356, 585 (1995)
1995
-
[18]
K. N. Borozdin, G. E. Hogan, C. Morris, W. C. Priedhorsky, A. Saunders, L. J. Schultz, and M. E. Teasdale, Nature422, 277 (2003)
2003
-
[19]
Hanet al., JINST15(06), P06019, arXiv:2003.12376 [physics.ins-det]
R. Hanet al., JINST15(06), P06019, arXiv:2003.12376 [physics.ins-det]
arXiv 2003
-
[20]
Tioukov, A
V . Tioukov, A. Alexandrov, C. Bozza, L. Consiglio, N. D’Ambrosio, G. De Lellis, C. De Sio, F. Giudicepietro, G. Macedonio, S. Miyamoto,et al., Scientific reports9, 6695 (2019)
2019
-
[21]
D. Varga, G. Nyitrai, G. Hamar, and L. Ol´ah, Adv. High Energy Phys.2016, 1962317 (2016), arXiv:1607.08494 [physics.ins- det]
Pith/arXiv arXiv 2016
-
[22]
T. K. Gaisser and M. Honda, Ann. Rev. Nucl. Part. Sci.52, 153 (2002), arXiv:hep-ph/0203272
Pith/arXiv arXiv 2002
-
[23]
J. I. Illana, P. Lipari, M. Masip, and D. Meloni, Astropart. Phys. 34, 663 (2011), arXiv:1010.5084 [astro-ph.HE]
Pith/arXiv arXiv 2011
-
[24]
T. K. Gaisser, T. Stanev, S. A. Bludman, and H.-s. Lee, Phys. Rev. Lett.51, 223 (1983)
1983
-
[25]
A. Fedynitch, R. Engel, T. K. Gaisser, F. Riehn, and T. Stanev, EPJ Web Conf.99, 08001 (2015), arXiv:1503.00544 [hep-ph]
Pith/arXiv arXiv 2015
-
[26]
A. Fedynitch, F. Riehn, R. Engel, T. K. Gaisser, and T. Stanev, Phys. Rev. D100, 103018 (2019), arXiv:1806.04140 [hep-ph]
arXiv 2019
-
[27]
H. P. Dembinski, R. Engel, A. Fedynitch, T. Gaisser, F. Riehn, and T. Stanev, PoSICRC2017, 533 (2018), arXiv:1711.11432 [astro-ph.HE]
Pith/arXiv arXiv 2018
-
[28]
J. Albrechtet al., Astrophys. Space Sci.367, 27 (2022), arXiv:2105.06148 [astro-ph.HE]
arXiv 2022
- [29]
-
[30]
T. Pierog, I. Karpenko, J. M. Katzy, E. Yatsenko, and K. Werner, Phys. Rev. C92, 034906 (2015), arXiv:1306.0121 [hep-ph]
Pith/arXiv arXiv 2015
-
[31]
S. Ostapchenko, Phys. Rev. D83, 014018 (2011), arXiv:1010.1869 [hep-ph]
Pith/arXiv arXiv 2011
-
[32]
A. Fedynitch and M. Huber, Phys. Rev. D106, 083018 (2022), arXiv:2205.14766 [astro-ph.HE]. 13
arXiv 2022
-
[33]
J. P. Ya˜nez and A. Fedynitch, Phys. Rev. D107, 123037 (2023), arXiv:2303.00022 [hep-ph]
arXiv 2023
-
[34]
D. E. Groom, N. V . Mokhov, and S. I. Striganov, Atom. Data Nucl. Data Tabl.78, 183 (2001)
2001
-
[35]
W. T. Scott, Rev. Mod. Phys.35, 231 (1963)
1963
-
[36]
W. Woodley, A. Fedynitch, and M.-C. Piro, Phys. Rev. D110, 063006 (2024), arXiv:2406.10339 [hep-ph]
arXiv 2024
-
[37]
Z. Z. Liuet al.(CDEX), Phys. Rev. D105, 052005 (2022), arXiv:2111.11243 [hep-ex]
arXiv 2022
-
[38]
Agostinelliet al.(GEANT4), Nucl
S. Agostinelliet al.(GEANT4), Nucl. Instrum. Meth. A506, 250 (2003)
2003
-
[39]
Allisonet al., IEEE Trans
J. Allisonet al., IEEE Trans. Nucl. Sci.53, 270 (2006)
2006
-
[40]
X. Zhanget al.(JNE), Phys. Rev. D110, 112017 (2024), arXiv:2409.04169 [hep-ex]
arXiv 2024
-
[41]
Z. Guoet al.(JNE), Chin. Phys. C45, 025001 (2021), arXiv:2007.15925 [physics.ins-det]
arXiv 2021
-
[42]
Zhang and J
X. Zhang and J. Li, PoSICRC2025, 452 (2025)
2025
-
[43]
B. Zhang, Z. Wang, and S. Chen, Applied Sciences12, 10.3390/app122110975 (2022), arXiv:2209.11974
-
[44]
T. G. Farret al., Reviews of Geophysics47, 10.1029/2005RG000183 (2007)
-
[45]
S. Aielloet al.(KM3NeT), Eur. Phys. J. C84, 696 (2024), arXiv:2403.11946 [astro-ph.HE]
arXiv 2024
-
[46]
Zheng, S
M. Zheng, S. Li, Z. Feng, H. Xu, and Y . Xiao, International Journal of Mining Science and Technology34, 179 (2024)
2024
-
[47]
A. Fedynitch, W. Woodley, and M.-C. Piro, Astrophys. J.928, 27 (2022), arXiv:2109.11559 [astro-ph.HE]
arXiv 2022
-
[48]
B. Aharmimet al.(SNO), Phys. Rev. D80, 012001 (2009), arXiv:0902.2776 [hep-ex]
Pith/arXiv arXiv 2009
-
[49]
D. P. Deeet al., Quarterly Journal of the Royal Meteorological Society137, 553 (2011)
2011
-
[50]
E. W. Grashorn, J. K. de Jong, M. C. Goodman, A. Habig, M. L. Marshak, S. Mufson, S. Osprey, and P. Schreiner, Astropart. Phys.33, 140 (2010), arXiv:0909.5382 [hep-ex]
Pith/arXiv arXiv 2010
-
[51]
P. Adamsonet al.(MINOS), Phys. Rev. D81, 012001 (2010), arXiv:0909.4012 [hep-ex]
Pith/arXiv arXiv 2010
-
[52]
Zhang, H
P. Zhang, H. Ma, W. Dai, M. Jing, L. Yang, Q. Yue, Z. Zeng, and J. Cheng, Astroparticle Physics , 103147 (2025)
2025
-
[53]
D. Mei and A. Hime, Phys. Rev. D73, 053004 (2006), arXiv:astro-ph/0512125
Pith/arXiv arXiv 2006
discussion (0)
Sign in with ORCID, Apple, or X to comment. Anyone can read and Pith papers without signing in.