Quantifying defensive pressure on the ball carrier in soccer based on minimum arrival time
Pith reviewed 2026-06-27 14:10 UTC · model grok-4.3
The pith
Defensive pressure on the soccer ball carrier equals the minimum time for any opponent to arrive at that spot using a physics motion model.
A machine-rendered reading of the paper's core claim, the machinery that carries it, and where it could break.
Core claim
Defensive pressure is quantified as the opponent minimum arrival time to the ball-carrier location computed from a physics-based motion model. Using synchronized event and tracking data from 306 matches, the quantity decreases during a possession interval and rises again after ball release. Possessions that begin under shorter minimum arrival times produce smaller ball progression, and intentional open-play passes that end under shorter arrival times are more likely to be lost.
What carries the argument
Minimum arrival time to the ball-carrier location, computed from a physics-based motion model applied to tracking data.
If this is right
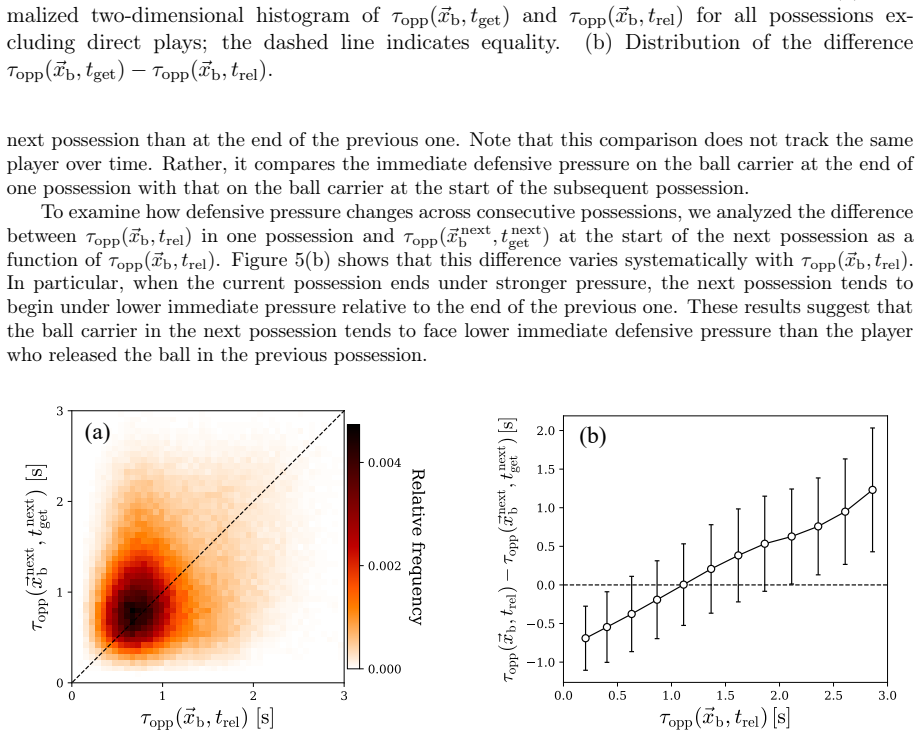
- The minimum arrival time shortens while a team maintains possession and lengthens after the ball is released.
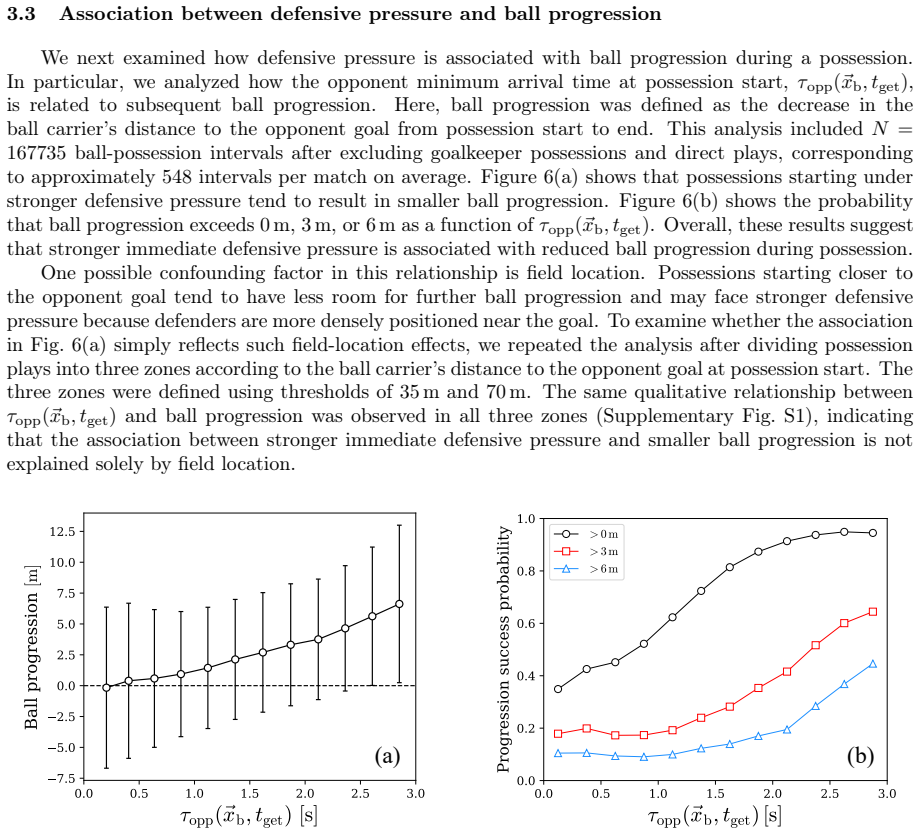
- Possessions that start with shorter minimum arrival times produce smaller net ball progression.
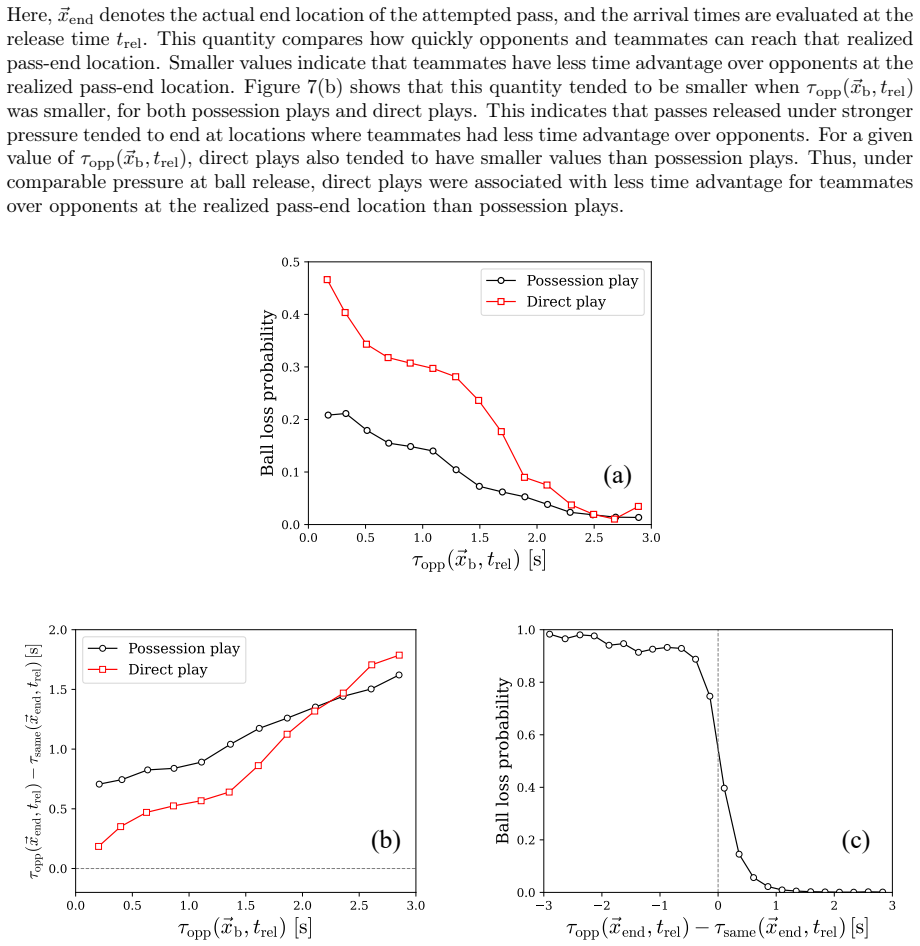
- For intentional open-play passes, possessions that end with shorter minimum arrival times are more likely to result in loss of the ball.
- The quantity supplies a simple baseline for describing pressing intensity directly from tracking data.
Where Pith is reading between the lines
- The same arrival-time calculation could be applied to evaluate how individual players or teams alter pressure levels through positioning choices.
- Coaches could test whether training drills that reduce opponent arrival times improve real-match outcomes.
- The measure offers a way to compare pressing styles across leagues using only position and velocity data without additional modeling layers.
Load-bearing premise
A basic physics model of constant-speed straight-line motion gives an accurate enough picture of how fast any defender can actually reach the ball carrier.
What would settle it
Direct comparison of the model's predicted arrival times against the actual times defenders reach the ball carrier in the same match footage or higher-frequency GPS data; large systematic differences would falsify the claim that the quantity measures real defensive pressure.
Figures
read the original abstract
Defensive pressure on the ball carrier is a fundamental component of soccer tactics. Existing pressure measures often involve additional modeling assumptions, which may reduce interpretability. In this study, we quantify defensive pressure as the opponent minimum arrival time to the ball-carrier location, computed from a physics-based motion model. Using synchronized event and tracking data from all 306 matches in the top division of the Japan Professional Football League during the 2023 season, we analyze the statistical characteristics and temporal evolution of this quantity during ball-possession intervals. The results show that the opponent minimum arrival time tends to decrease during possession and to increase again at the start of the next possession after ball release. We also find that possessions starting under stronger defensive pressure tend to yield smaller ball progression, and that, for intentional open-play passes, possessions ending under stronger pressure are more likely to be lost. These findings indicate that minimum arrival time provides an interpretable and physically grounded measure of immediate defensive pressure on the ball carrier. The proposed framework provides a simple and interpretable baseline for quantifying pressing dynamics from tracking data.
Editorial analysis
A structured set of objections, weighed in public.
Referee Report
Summary. The manuscript proposes quantifying defensive pressure on the soccer ball carrier as the minimum arrival time of opposing players to the ball-carrier location, derived from a physics-based motion model. Using event and tracking data from all 306 matches in the 2023 Japan Professional Football League, the authors analyze its statistical properties during ball possessions, finding that it tends to decrease during possession and increase after ball release. They also report that possessions starting under stronger pressure yield smaller ball progression, and possessions ending under stronger pressure are more likely to end in turnovers for intentional open-play passes.
Significance. If the underlying motion model is validated, the approach offers a simple, interpretable, and physically motivated baseline for assessing pressing dynamics directly from tracking data, avoiding some of the additional assumptions in existing pressure metrics. The empirical correlations with progression and turnover provide initial support for its relevance.
major comments (2)
- [Abstract/Methods description] Abstract/Methods description: The physics-based motion model is referenced but not specified with explicit equations, parameter values, or error bounds. No validation is reported comparing predicted arrival times against observed player trajectories or actual times at which opponents reach the ball-carrier location. This is load-bearing for the central claim that the measure is 'physically grounded,' as unaccounted factors like direction changes or acceleration limits could introduce systematic mismatch.
- [Results section (statistical characteristics and temporal evolution)] Results section (statistical characteristics and temporal evolution): The reported patterns (decrease during possession, correlations with progression and turnover) lack details on exact sample sizes, confidence intervals, or controls for confounders such as pitch location. This limits assessment of whether the data robustly support the interpretability claims.
minor comments (1)
- Clarify data synchronization between event and tracking sources and any applied filters, as this affects reproducibility of the possession-interval analysis.
Simulated Author's Rebuttal
We thank the referee for their thoughtful and constructive comments, which highlight important areas for improving the clarity and robustness of our manuscript. We address each major comment below and will revise the manuscript to incorporate the suggested enhancements.
read point-by-point responses
-
Referee: [Abstract/Methods description] Abstract/Methods description: The physics-based motion model is referenced but not specified with explicit equations, parameter values, or error bounds. No validation is reported comparing predicted arrival times against observed player trajectories or actual times at which opponents reach the ball-carrier location. This is load-bearing for the central claim that the measure is 'physically grounded,' as unaccounted factors like direction changes or acceleration limits could introduce systematic mismatch.
Authors: We agree that the physics-based motion model requires more explicit specification to support the claim of being physically grounded. In the revised manuscript, we will add the explicit equations of the motion model, the parameter values (including maximum speed and acceleration), and associated assumptions or error bounds. We will also include a dedicated discussion of the model's limitations, such as the effects of direction changes and acceleration constraints, and how these may affect predicted arrival times. Direct validation against observed arrival times was not performed in the original submission because the available tracking data does not allow straightforward matching of predicted versus actual opponent arrival events at the ball-carrier location; we will transparently note this limitation while explaining why the model still provides a useful baseline. revision: yes
-
Referee: [Results section (statistical characteristics and temporal evolution)] Results section (statistical characteristics and temporal evolution): The reported patterns (decrease during possession, correlations with progression and turnover) lack details on exact sample sizes, confidence intervals, or controls for confounders such as pitch location. This limits assessment of whether the data robustly support the interpretability claims.
Authors: We acknowledge that additional statistical details are needed to strengthen the results section. In the revised manuscript, we will report the exact sample sizes for the analyzed ball-possession intervals, include confidence intervals or standard errors for the reported temporal trends and correlations, and add controls for pitch location (for example, by stratifying the analyses by pitch zones or including location as a covariate). These revisions will provide a clearer basis for evaluating the robustness of the observed patterns. revision: yes
Circularity Check
No circularity: measure defined from external physics model and tested on independent data
full rationale
The paper defines defensive pressure directly as opponent minimum arrival time computed from a physics-based motion model applied to tracking data. No parameters are fitted to the outcome variables (progression, turnovers); the model is treated as an external input. Statistical associations are then reported on the 2023 J-League dataset without any self-referential loop or renaming of fitted quantities as predictions. No self-citations are load-bearing for the core definition, and the derivation chain does not reduce any claimed result to its own inputs by construction. This is the normal non-circular case for a physics-derived proxy tested against match events.
Axiom & Free-Parameter Ledger
free parameters (1)
- motion model parameters
axioms (1)
- domain assumption The minimum arrival time computed from the motion model directly quantifies immediate defensive pressure.
Reference graph
Works this paper leans on
-
[1]
Andrienko, G., Andrienko, N., Budziak, G., Dykes, J., Fuchs, G., von Landesberger, T., Weber, H.,
-
[2]
Data Mining and Knowledge Discovery 31, 1793–1839
Visual analysis of pressure in football. Data Mining and Knowledge Discovery 31, 1793–1839. doi:10.1007/s10618-017-0513-2
-
[3]
An integrated dataset of spatiotemporal and event data in elite soccer
Bassek, M., Rein, R., Weber, H., Memmert, D., 2025. An integrated dataset of spatiotemporal and event data in elite soccer. Scientific Data 12, 195. doi:10.1038/s41597-025-04505-y
-
[4]
Data-driven detection of counterpressing in professional football
Bauer, P., Anzer, G., 2021. Data-driven detection of counterpressing in professional football. Data Mining and Knowledge Discovery 35, 2009–2049. doi:10.1007/s10618-021-00763-7. 9
-
[5]
Pressing intensity: An intuitive measure for pressing in soccer
Bekkers, J., 2025. Pressing intensity: An intuitive measure for pressing in soccer. arXiv preprint arXiv:2501.04712. doi:10.48550/arXiv.2501.04712
-
[6]
Measuring skill via player dynamics in football dribbling
Brink, L., Ha, S.K., Snowdon, J., Vidal-Codina, F., Rauch, B., Wang, F., Wu, D., López-Felip, M.A., Clanet, C., Hosoi, A.E., 2023. Measuring skill via player dynamics in football dribbling. Scientific Reports 13, 19004. doi:10.1038/s41598-023-45914-6
-
[7]
Official website.https://www.datastadium.co.jp/en
DataStadium Inc., 2026. Official website.https://www.datastadium.co.jp/en. Accessed: 2026- 03-14
2026
-
[8]
Wide open spaces: A statistical technique for measuring space creation in professional soccer, in: Proceedings of the MIT Sloan Sports Analytics Conference, pp
Fernandez, J., Bornn, L., 2018. Wide open spaces: A statistical technique for measuring space creation in professional soccer, in: Proceedings of the MIT Sloan Sports Analytics Conference, pp. 1–19
2018
-
[9]
Forcher, L., Forcher, L., Altmann, S., Jekauc, D., Kempe, M., 2024. The keys of pressing to gain the ball – characteristics of defensive pressure in elite soccer using tracking data. Science and Medicine in Football 8, 161–169. doi:10.1080/24733938.2022.2158213
-
[10]
Geometric analysis and quantitative evaluation of sport teamwork
Fujimura, A., Sugihara, K., 2005. Geometric analysis and quantitative evaluation of sport teamwork. Systems and Computers in Japan 36, 49–58. doi:10.1002/scj.20254
-
[11]
Gudmundsson, J., Horton, M., 2017. Spatio-temporal analysis of team sports. ACM Computing Surveys 50, 1–34. doi:10.1145/3054132
-
[12]
Herold, M., Hecksteden, A., Radke, D., Goes, F., Nopp, S., Meyer, T., Kempe, M., 2022. Off-ball behavior in association football: A data-driven model to measure changes in individual defensive pressure. Journal of Sports Sciences 40, 1412–1425. doi:10.1080/02640414.2022.2081405
-
[13]
Measuring the effectiveness of pressing in soccer
Merckx, S., Robberechts, P., Euvrard, Y., Davis, J., 2021. Measuring the effectiveness of pressing in soccer. Proceedings of the 8th Workshop on Machine Learning and Data Mining for Sports Analytics
2021
-
[14]
Validation of a motion model for soccer players’ sprint by means of tracking data
Narizuka, T., Takizawa, K., Yamazaki, Y., 2023. Validation of a motion model for soccer players’ sprint by means of tracking data. Scientific Reports 13, 865. doi:10.1038/s41598-023-27999-1
-
[15]
Space evaluation in football games via field weight- ing based on tracking data
Narizuka, T., Yamazaki, Y., Takizawa, K., 2021. Space evaluation in football games via field weight- ing based on tracking data. Scientific Reports 11, 5509. doi:10.1038/s41598-021-84939-7
-
[16]
Peters, A., Parmar, N., Davies, M., James, N., 2026. A rule-based approach to classify counterpress- ing – analysis of its risks and relationship with rest defence. International Journal of Performance Analysis in Sport 26, 206–222. doi:10.1080/24748668.2025.2473799
-
[17]
Physics-based modeling of pass probabilities in soccer, in: Proceedings of the MIT Sloan Sports Analytics Conference, pp
Spearman, W., Basye, A., Dick, G., Hotovy, R., Pop, P., 2017. Physics-based modeling of pass probabilities in soccer, in: Proceedings of the MIT Sloan Sports Analytics Conference, pp. 1–14
2017
-
[18]
TacticAI: an AI assistant for football tactics
Wang, Z., Veličković, P., Hennes, D., Tomašev, N., Prince, L., Kaisers, M., Bachrach, Y., Elie, R., Wenliang, L.K., Piccinini, F., Spearman, W., Graham, I., Connor, J., Yang, Y., Recasens, A., Khan, M., Beauguerlange, N., Sprechmann, P., Moreno, P., Heess, N., Bowling, M., Hassabis, D., Tuyls, K., 2024. TacticAI: an AI assistant for football tactics. Natu...
discussion (0)
Sign in with ORCID, Apple, or X to comment. Anyone can read and Pith papers without signing in.