Extending Prais-Winsten Regression to Panel Data with Higher-Order Autoregressive Errors: A Simulation Study
Pith reviewed 2026-06-27 08:29 UTC · model grok-4.3
The pith
A Prais-Winsten AR(k) extension for panel data yields higher power than the Driscoll-Kraay estimator while keeping Type I error near nominal levels.
A machine-rendered reading of the paper's core claim, the machinery that carries it, and where it could break.
Core claim
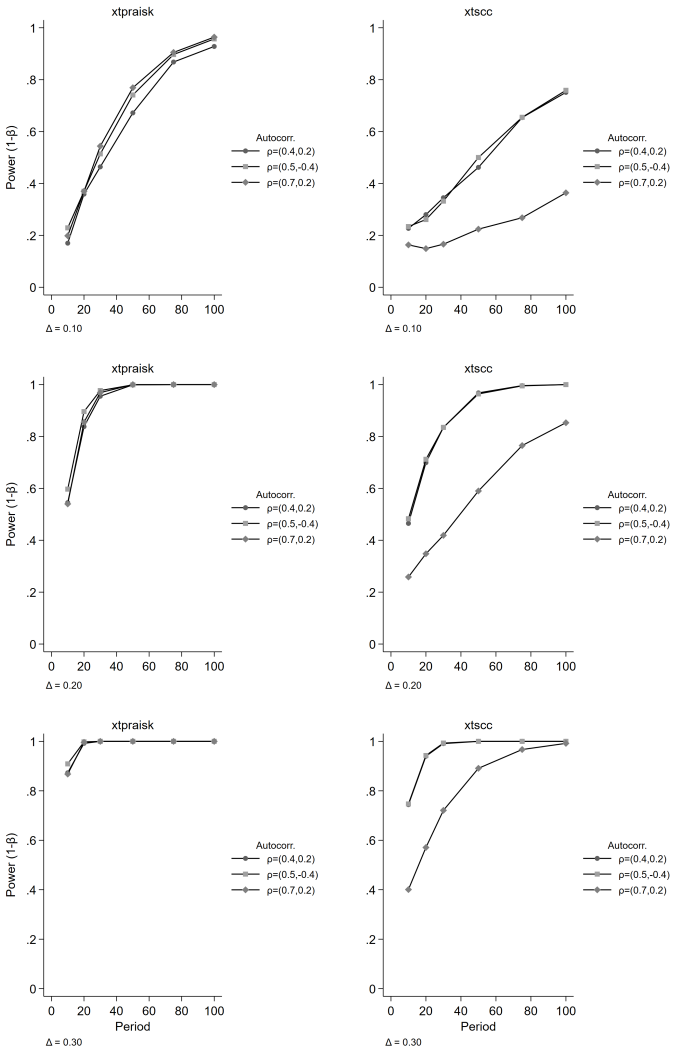
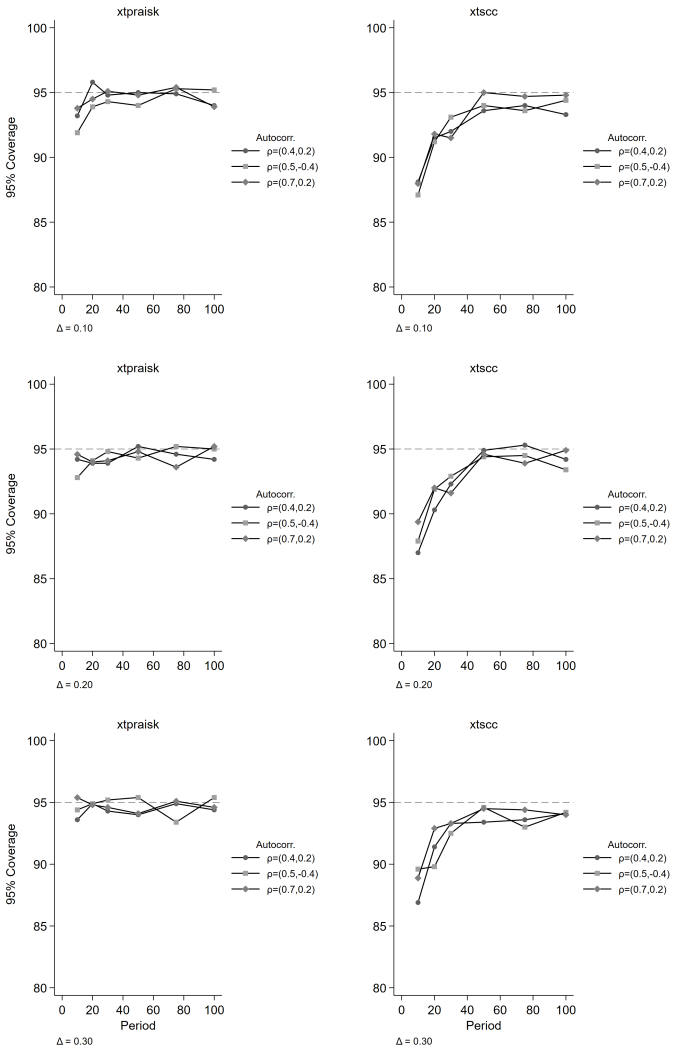
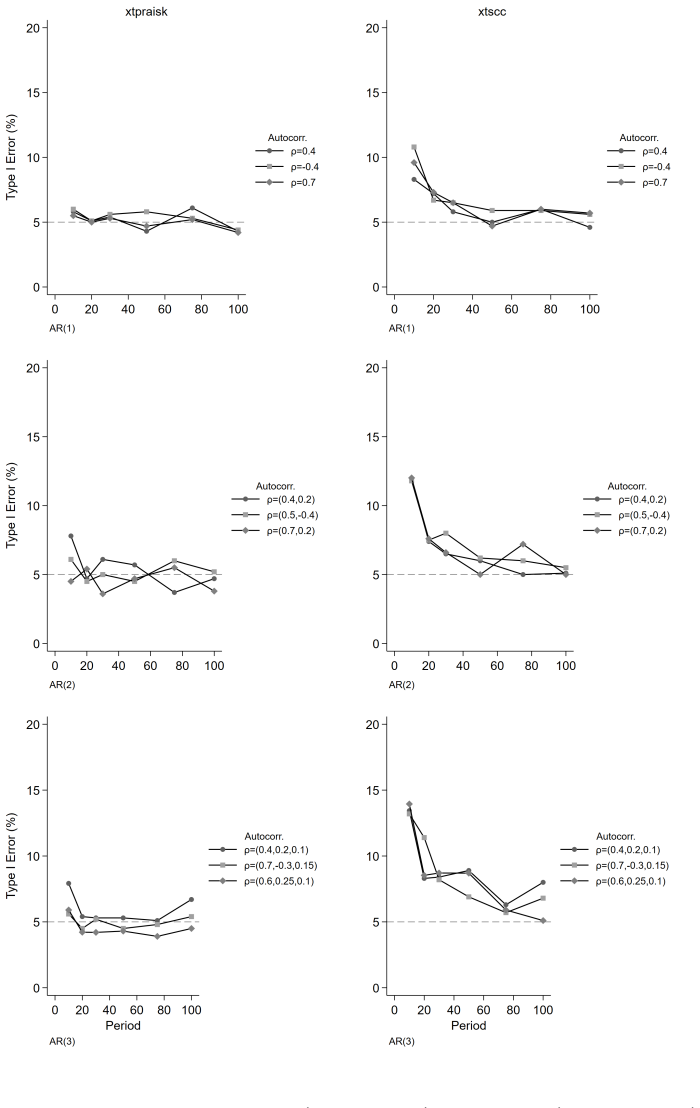
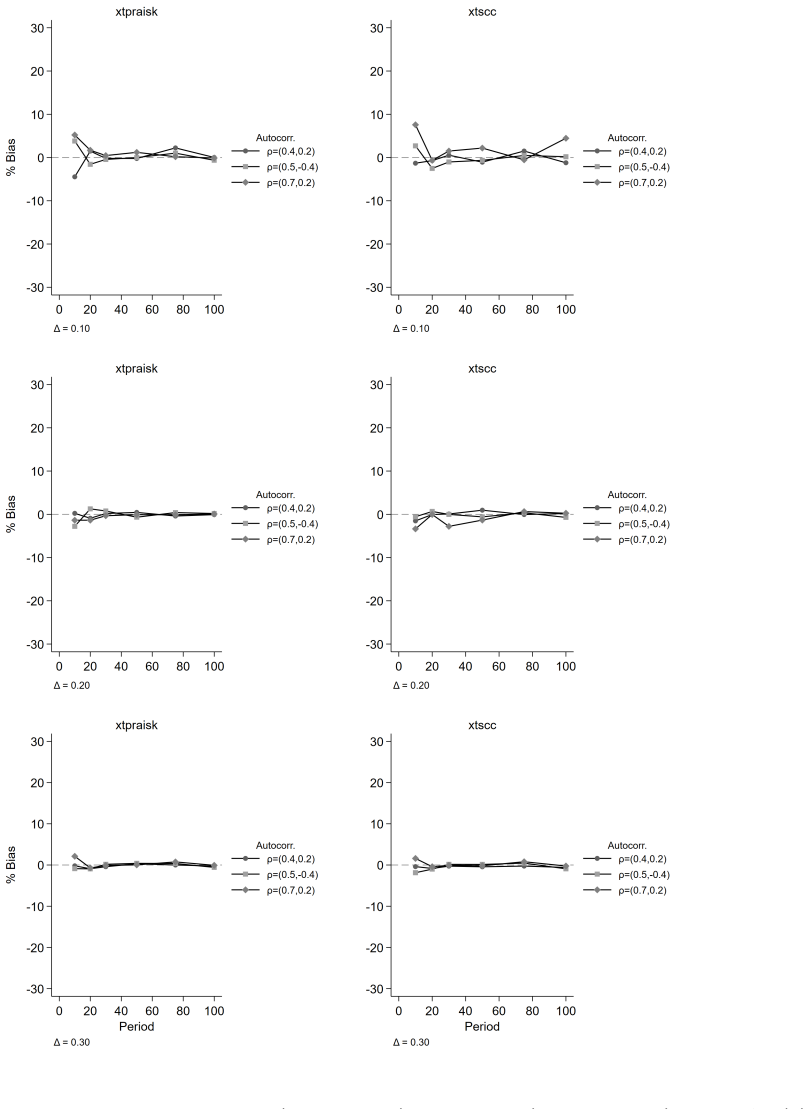
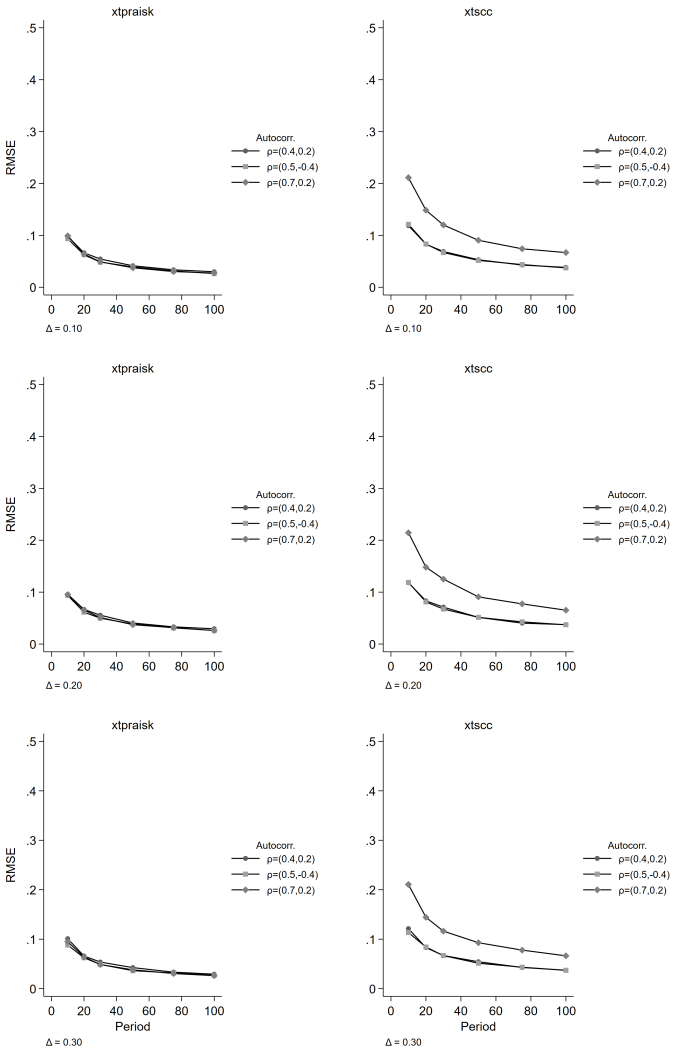
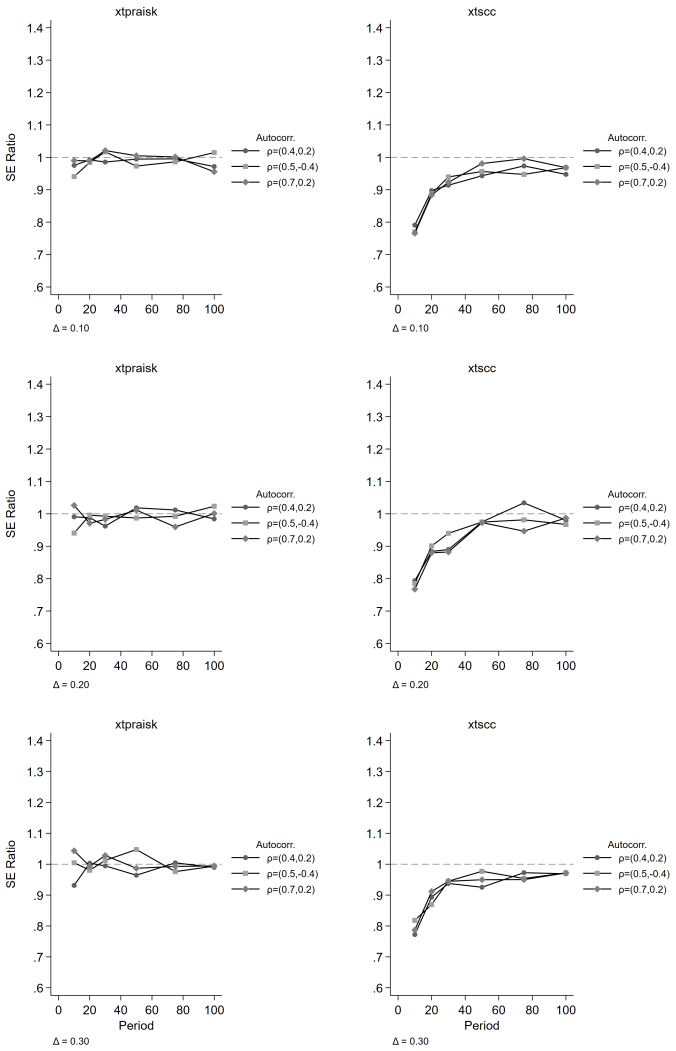
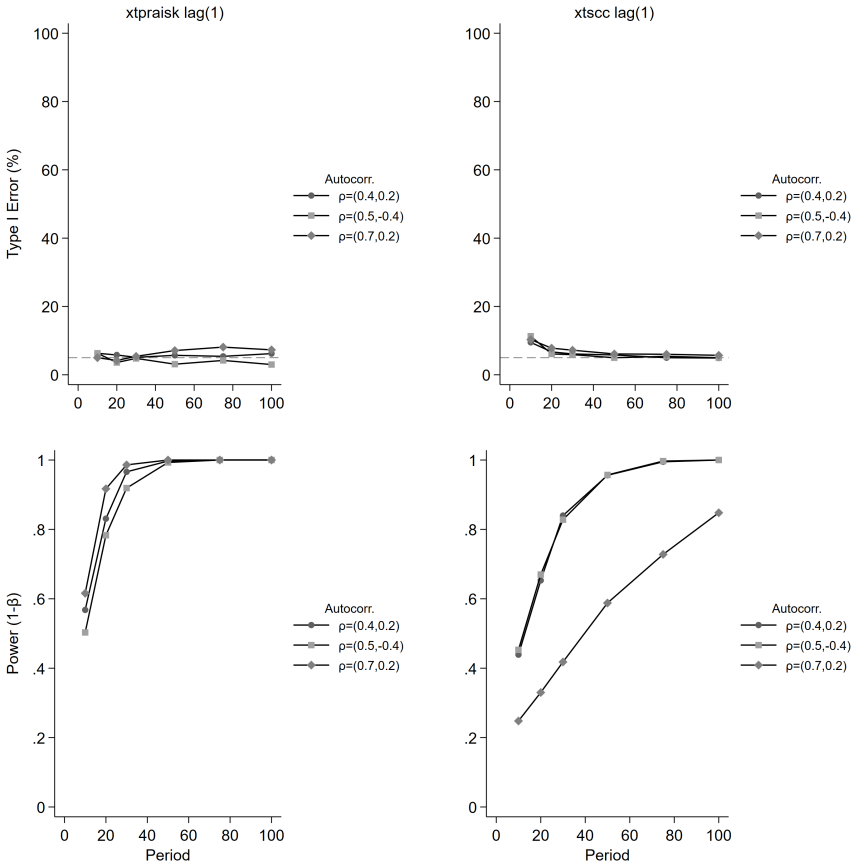
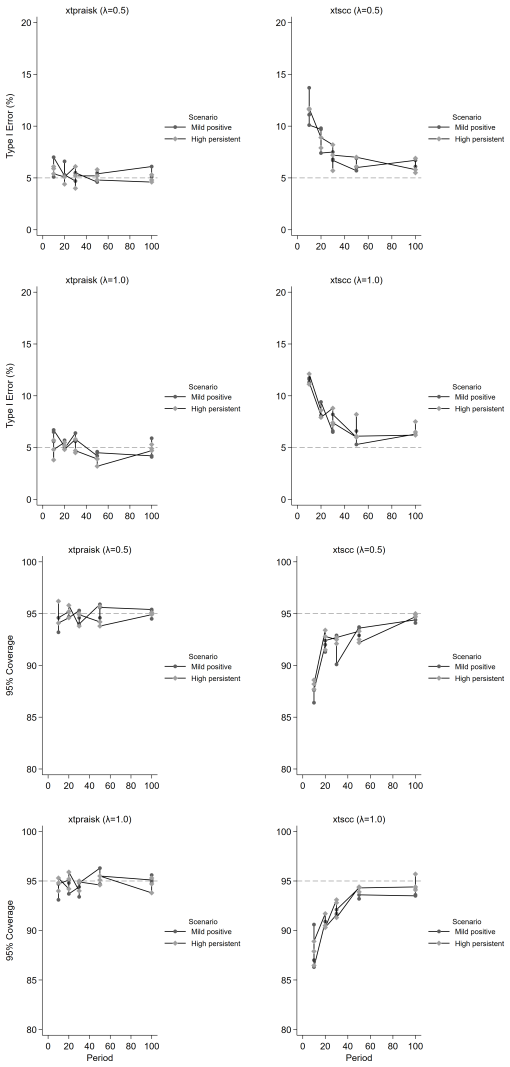
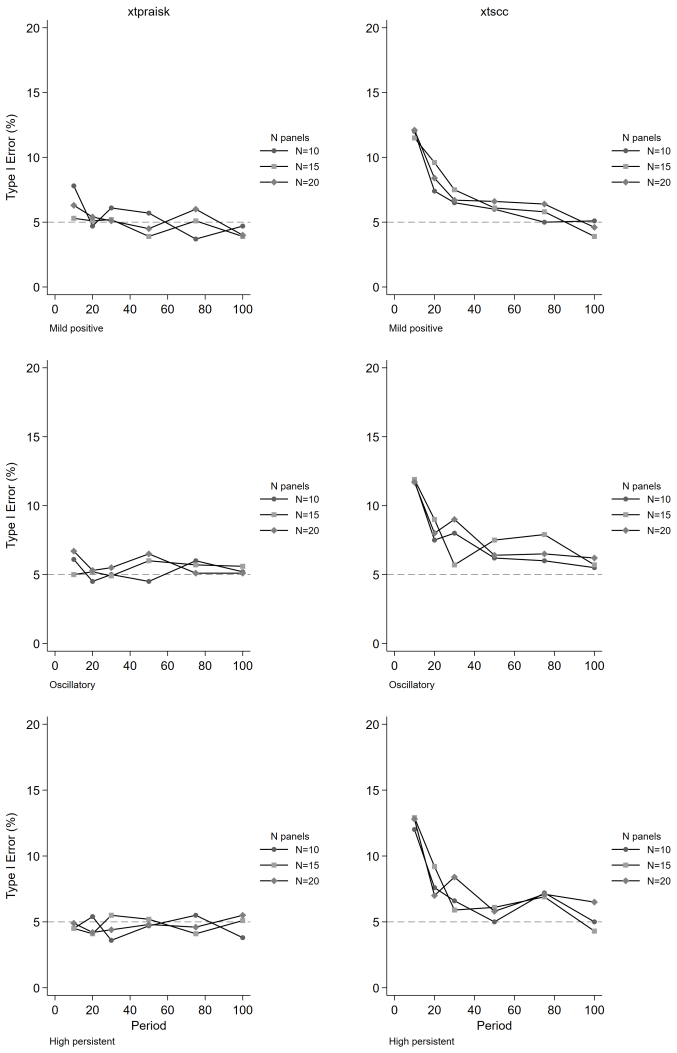
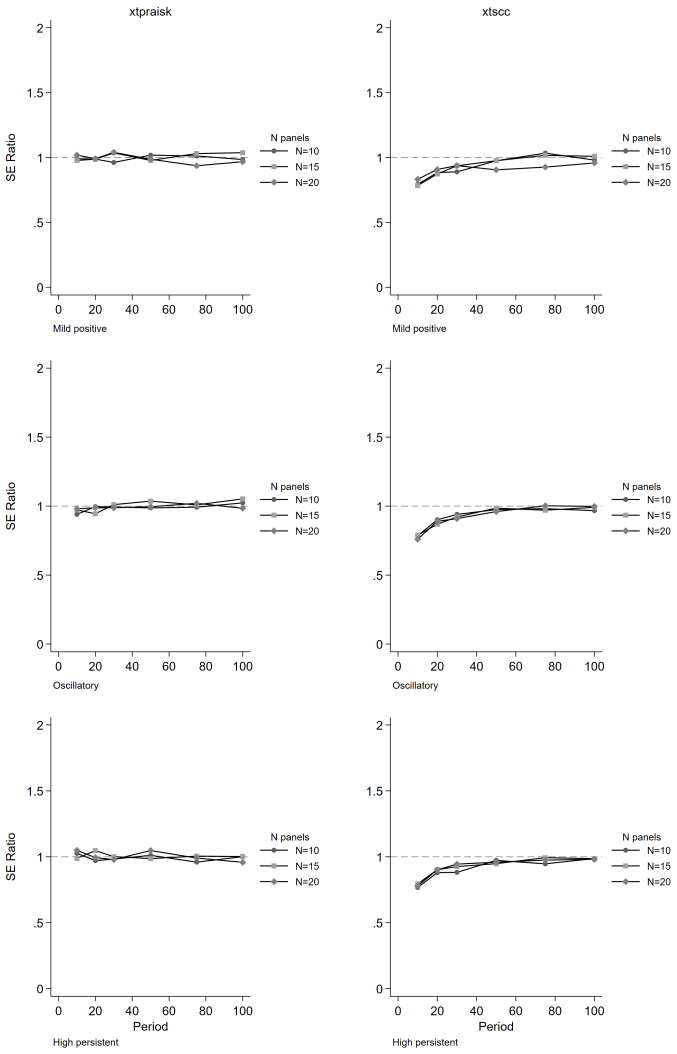
The paper establishes that the panel-extended Prais-Winsten AR(k) GLS transformation produces unbiased coefficient estimates with higher power than the Driscoll-Kraay estimator, while delivering near-nominal Type I error rates, proper confidence interval coverage, and accurate standard error estimates. Misspecification of the autoregressive order leaves its inferential properties intact, and cross-panel correlation or panel size exerts negligible influence on relative performance. Both estimators remain unbiased, but the new method avoids the systematic standard error underestimation that worsens with increasing autoregressive order and shorter series lengths in the comparator.
What carries the argument
The xtpraisk estimator, which applies the Prais-Winsten transformation for AR(k) errors inside the Beck-Katz panel-corrected standard errors framework.
If this is right
- When both efficiency and valid inference matter, xtpraisk is the preferred choice over xtscc for panel data containing higher-order autoregressive errors.
- The performance advantage is largest at short to moderate series lengths and under persistent autocorrelation.
- Misspecifying the autoregressive order does not degrade the inferential properties of xtpraisk.
- Cross-panel correlation and panel size do not alter the relative performance of the two estimators.
- Both methods produce essentially unbiased point estimates, so the distinction lies in power and calibration of inference.
Where Pith is reading between the lines
- Applied researchers may want to re-examine published panel results that relied on xtscc and reported null findings, because the new estimator could detect effects that the older one missed.
- The robustness to autoregressive-order misspecification suggests the method can be used even when the precise lag structure is uncertain.
- Future work could embed the same transformation inside other panel estimators or test it on real datasets from economics or political science.
- The simulation grid supplies guidance on when the efficiency gain is likely to be largest.
Load-bearing premise
The Monte Carlo design with autoregressive orders one to three, three autocorrelation scenarios, three panel sizes, six series lengths, and five effect sizes adequately represents the data-generating processes found in applied panel research.
What would settle it
An empirical panel dataset with documented higher-order autocorrelation in which xtpraisk and xtscc produce materially different coefficient significance or interval widths on the same specification would test whether the simulation advantages appear in practice.
Figures
read the original abstract
We extend the Prais-Winsten AR(k) generalized least squares (GLS) transformation to panel data within the Beck-Katz panel-corrected standard error (PCSE) framework and implement the method in the community-contributed Stata package xtpraisk. As the panel extension of Prais-Winsten, xtpraisk is the natural comparator to xtscc, the panel extension of Newey-West and implementation of the Driscoll-Kraay estimator. We conduct a Monte Carlo simulation to validate the statistical properties of xtpraisk and compare its finite-sample performance with xtscc. The simulation spans autoregressive orders 1-3, three autocorrelation scenarios, three panel sizes, six series lengths, and five effect sizes, with 2,000 replications per condition. Across all conditions, xtpraisk achieved higher power than xtscc while maintaining near-nominal Type I error rates, confidence interval coverage, and standard error calibration. In contrast, xtscc exhibited systematic standard error underestimation and inflated Type I error at short series lengths, with both deficiencies worsening as autoregressive order increased. Both estimators were essentially unbiased. Misspecification of the autoregressive order did not degrade xtpraisk's inferential performance, and cross-panel correlation and panel size had negligible effects on the relative performance of either estimator. The results indicate that xtpraisk is preferable when both statistical efficiency and valid inference are priorities, particularly under persistent higher-order autocorrelation and short to moderate series lengths.
Editorial analysis
A structured set of objections, weighed in public.
Referee Report
Summary. The manuscript extends the Prais-Winsten AR(k) GLS transformation to panel data within the Beck-Katz PCSE framework and implements the estimator in the Stata package xtpraisk. It positions xtpraisk as the natural comparator to xtscc (Driscoll-Kraay). A Monte Carlo study with 2,000 replications per cell examines AR orders 1–3, three autocorrelation scenarios, three panel sizes, six series lengths, and five effect sizes. The central claim is that xtpraisk delivers higher power than xtscc while preserving near-nominal Type I error rates, CI coverage, and SE calibration; xtscc exhibits SE underestimation and inflated Type I error that worsen with short T and higher AR order. Both estimators are unbiased, misspecification of AR order does not degrade xtpraisk performance, and cross-panel correlation has negligible effects.
Significance. If the finite-sample results hold, the work supplies a practical, efficiency-improving alternative for panel data with higher-order serial correlation. The simulation grid is broad, the replication count is adequate, misspecification checks are included, and multiple performance metrics are reported; these design features constitute a clear strength for a methods paper.
major comments (1)
- [Simulation Study] Simulation Study section: The manuscript contains no description of verification steps confirming that the GLS transformation coded in xtpraisk matches the intended Prais-Winsten AR(k) formulas (e.g., no comparison against known analytical results for AR(1) or single-panel cases, nor explicit edge-case testing). Because all performance claims rest on the simulation outputs being generated by a correctly implemented estimator, this omission is load-bearing for the central comparison with xtscc.
minor comments (2)
- [Abstract] Abstract: The summary statement that xtpraisk “achieved higher power” would be more informative if accompanied by at least one quantitative illustration (e.g., average power difference or range across conditions).
- [Method] Notation: The description of the panel extension of the Prais-Winsten transformation would benefit from an explicit equation showing how the AR(k) coefficients enter the GLS weighting matrix for the panel case.
Simulated Author's Rebuttal
We thank the referee for the constructive comment on implementation verification. We address the point directly below.
read point-by-point responses
-
Referee: Simulation Study section: The manuscript contains no description of verification steps confirming that the GLS transformation coded in xtpraisk matches the intended Prais-Winsten AR(k) formulas (e.g., no comparison against known analytical results for AR(1) or single-panel cases, nor explicit edge-case testing). Because all performance claims rest on the simulation outputs being generated by a correctly implemented estimator, this omission is load-bearing for the central comparison with xtscc.
Authors: We agree that the manuscript should include explicit verification of the xtpraisk implementation to support the simulation claims. The current version reports the estimator's construction and the Monte Carlo design but does not document code-level checks against analytical Prais-Winsten AR(k) results. In the revision we will insert a short subsection (Implementation Verification) that reports: (i) direct numerical agreement between xtpraisk and the closed-form Prais-Winsten transformation for AR(1) single-series cases; (ii) equivalence checks for AR(2) and AR(3) on single panels; and (iii) edge-case tests for unit-root boundaries and minimum-T panels. These additions will be placed before the main simulation results so that readers can confirm the estimator matches the intended formulas before evaluating the performance comparisons. revision: yes
Circularity Check
No significant circularity identified
full rationale
The paper is a Monte Carlo simulation study that implements an extension of Prais-Winsten GLS to panel data (xtpraisk) and compares its finite-sample properties to xtscc via 2000 independent replications across AR orders 1-3, multiple autocorrelation scenarios, panel sizes, series lengths, and effect sizes. All reported performance claims (power, Type I error, coverage, bias, SE calibration) are direct outputs of these external replications under explicitly stated DGPs; no result reduces by the paper's own equations or self-citation to a fitted parameter, renamed input, or self-referential quantity. The design is self-contained against external benchmarks and contains no load-bearing self-citation chains or ansatz smuggling.
Axiom & Free-Parameter Ledger
axioms (1)
- domain assumption Panel-data errors follow an autoregressive process of order k
Reference graph
Works this paper leans on
-
[1]
and Katz, Jonathan N
Beck, Nathaniel L. and Katz, Jonathan N. , title =. American Political Science Review , year =
-
[2]
and Davis, Richard A
Brockwell, Peter J. and Davis, Richard A. , title =
-
[3]
, title =
Cochrane, Donald and Orcutt, Guy H. , title =. Journal of the American Statistical Association , year =
-
[4]
and Kraay, Aart C
Driscoll, John C. and Kraay, Aart C. , title =. Review of Economics and Statistics , year =
-
[5]
and Galbraith, John I
Galbraith, Robin F. and Galbraith, John I. , title =. Journal of Applied Probability , year =
-
[6]
, title =
Hamilton, James D. , title =
-
[7]
Stata Journal , year =
Hoechle, Daniel , title =. Stata Journal , year =
-
[8]
and Griffiths, William E
Judge, George G. and Griffiths, William E. and Hill, R. Carter and L. The Theory and Practice of Econometrics , edition =
-
[9]
, title =
Liang, Kung-Yee and Zeger, Scott L. , title =. Biometrika , year =
-
[10]
Preprint
Linden, Ariel , title =. Preprint. Research Square , year =
-
[11]
2026 , note =
Linden, Ariel , title =. 2026 , note =
2026
- [12]
-
[13]
and Winsten, Christopher B
Prais, Sigbert J. and Winsten, Christopher B. , title =
-
[14]
, title =
Vougas, Dimitrios V. , title =. Econometrics , year =
-
[15]
and Royston, Patrick and Holder, Roger L
Burton, Andrea and Altman, Douglas G. and Royston, Patrick and Holder, Roger L. , title =. Statistics in Medicine , year =
-
[16]
Hsiao, Cheng , title =
-
[17]
, title =
Baltagi, Badi H. , title =
-
[18]
Stata Journal , year =
Linden, Ariel , title =. Stata Journal , year =
-
[19]
Michael and Garrett, Geoffrey and Lange, Peter , title =
Alvarez, R. Michael and Garrett, Geoffrey and Lange, Peter , title =. American Political Science Review , year =
-
[20]
Wyper, Grant M. A. and Mackay, Daniel F. and Fraser, Callum and Lewsey, Jim and Robinson, Mark and Beeston, Clare and Mackenzie, Jon and Nicholls, James and Richardson, Erica and Shortt, Niamh K. and Katikireddi, Srinivasa Vittal and McCartney, Gerry , title =. The Lancet , year =
-
[21]
Social Policy & Administration , year =
Jacques, Olivier and Haffert, Lukas and Seelkopf, Laura , title =. Social Policy & Administration , year =
-
[22]
Frontiers in Public Health , year =
Beylik, Umut and Cirakli, Umit and Cetin, Murat and Ecevit, Eyyup and Senol, Osman , title =. Frontiers in Public Health , year =
-
[23]
Stata Statistical Software: Release 19 , organization =
-
[24]
Public Choice , year =
Krieger, Tim , title =. Public Choice , year =
-
[25]
and West, Kenneth D
Newey, Whitney K. and West, Kenneth D. , title =. Econometrica , year =
-
[26]
and Van Loan, Charles F
Golub, Gene H. and Van Loan, Charles F. , title =
-
[27]
, title =
Park, Rolla Edward and Mitchell, Bridger M. , title =. Journal of Econometrics , year =
-
[28]
, title =
Wooldridge, Jeffrey M. , title =
-
[29]
and West, Kenneth D
Newey, Whitney K. and West, Kenneth D. , title =. Review of Economic Studies , year =
-
[30]
Andrews, Donald W. K. , title =. Econometrica , year =
-
[31]
and Nachtsheim, Christopher J
Kutner, Michael H. and Nachtsheim, Christopher J. and Neter, John and Li, William , title =
-
[32]
Statistical Software Components S459461, Boston College Department of Economics , year =
Linden, Ariel , title =. Statistical Software Components S459461, Boston College Department of Economics , year =
-
[33]
Statistical Software Components S459403, Boston College Department of Economics , year =
Linden, Ariel , title =. Statistical Software Components S459403, Boston College Department of Economics , year =
-
[34]
Evaluation & the Health Professions , year =
Linden, Ariel , title =. Evaluation & the Health Professions , year =
-
[35]
American Journal of Managed Care , year =
Linden, Ariel and Roberts, Nancy , title =. American Journal of Managed Care , year =
-
[36]
, title =
Harvey, Andrew C. , title =
-
[37]
Enders, Walter , title =
-
[38]
and Butterworth, Susan and Linden, Ariel , title =
Biuso, Thomas J. and Butterworth, Susan and Linden, Ariel , title =. Disease Management , year =
-
[39]
Health Care Financing Review , year =
Linden, Ariel and Adler-Milstein, Julia , title =. Health Care Financing Review , year =
-
[40]
and Krupka, Erin and Schachter, Abigail and Linden, Ariel and Pope, Eleanor and Forman, Jane and Heisler, Michele and Weir, David R
Kullgren, Jeffrey T. and Krupka, Erin and Schachter, Abigail and Linden, Ariel and Pope, Eleanor and Forman, Jane and Heisler, Michele and Weir, David R. and Sedlins, Mick and Volpp, Kevin G. , title =. BMJ Quality and Safety , year =
discussion (0)
Sign in with ORCID, Apple, or X to comment. Anyone can read and Pith papers without signing in.