X-ray Emission and Stellar Ages of Sun-Like Stars
Pith reviewed 2026-06-27 07:59 UTC · model grok-4.3
The pith
X-ray observations of 85 sun-like stars show three plasma components in quiescent spectra and confirm soft-band activity decay as t to the -1.5 with more scatter in harder bands beyond 4 Gyr.
A machine-rendered reading of the paper's core claim, the machinery that carries it, and where it could break.
Core claim
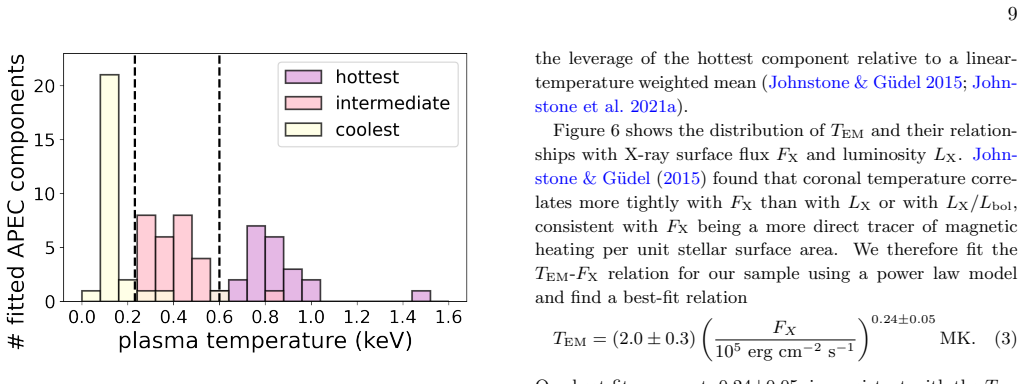
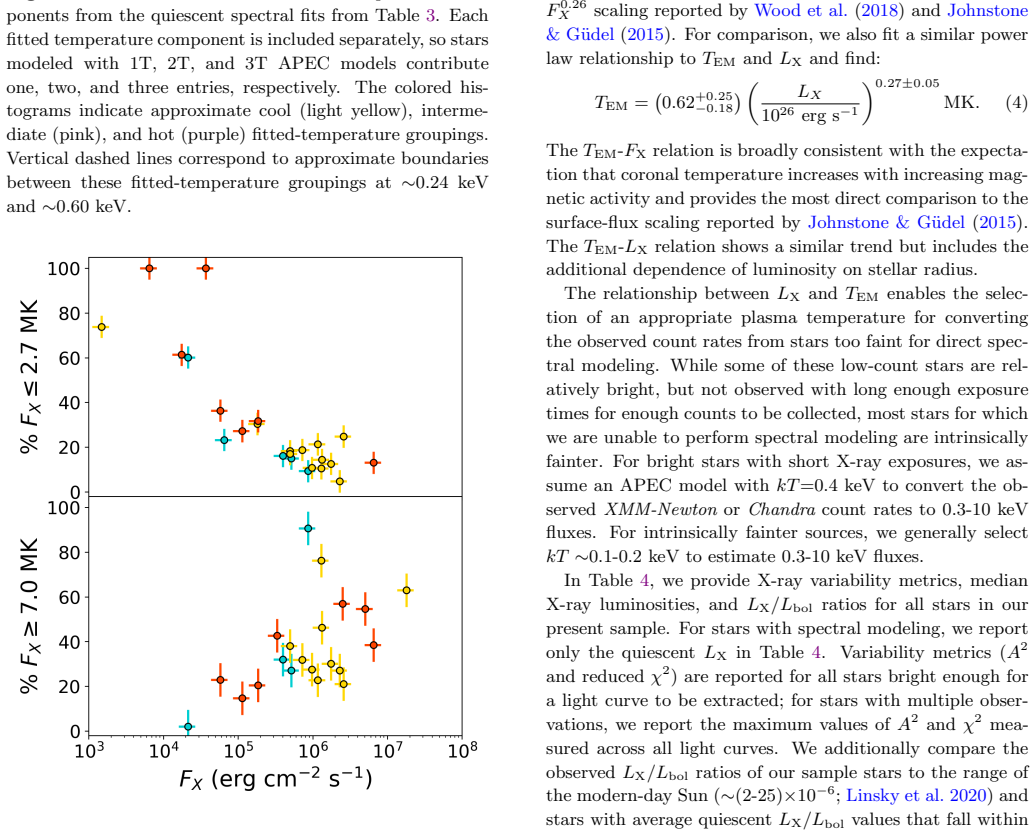
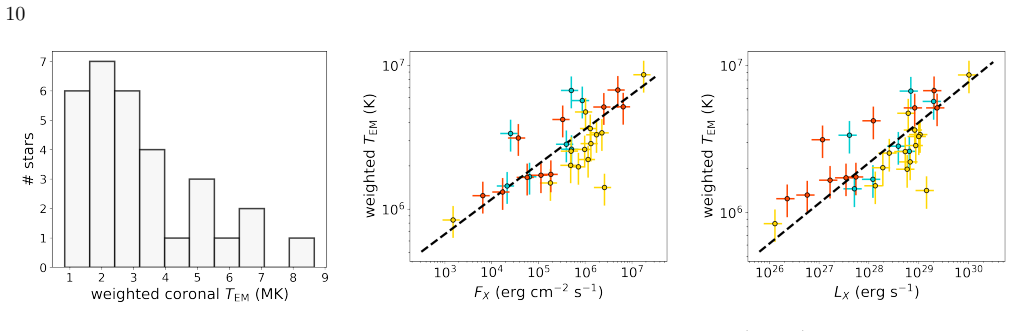
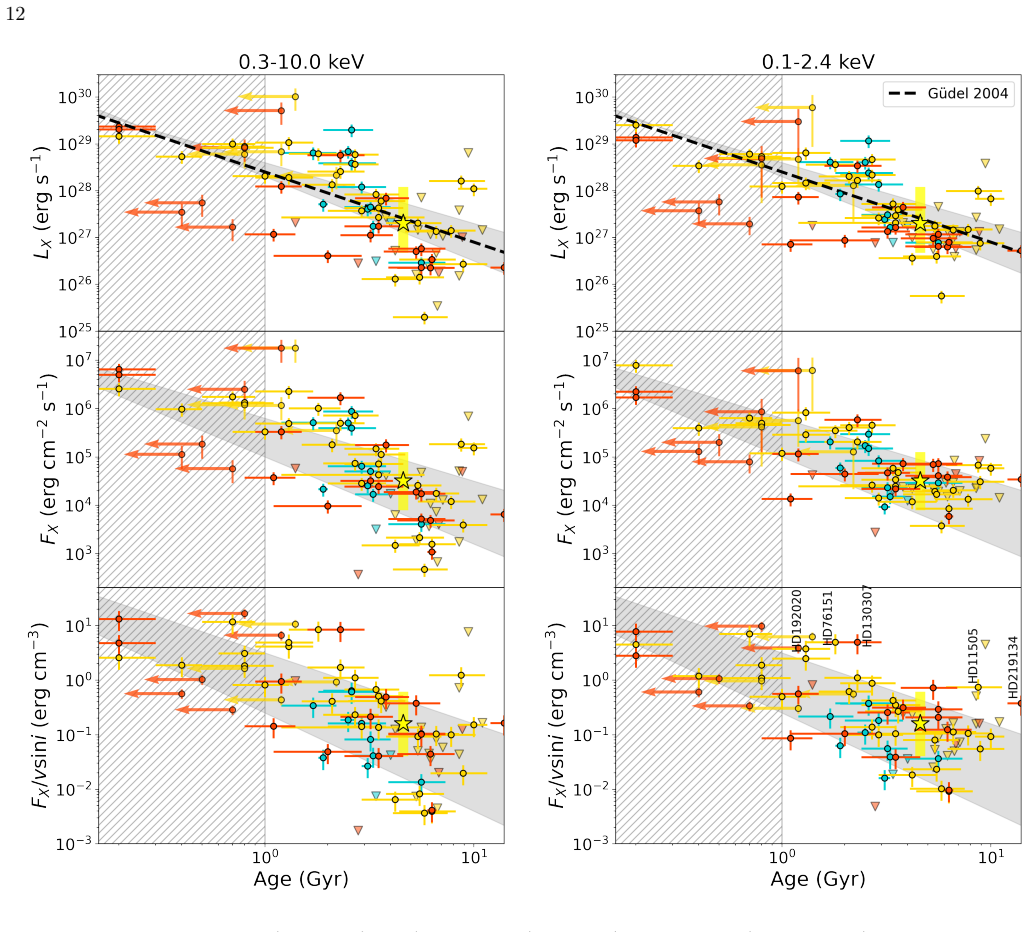
Quiescent spectra are typically described by three characteristic plasma components (kT≈0.1, 0.4, 0.8 keV); relations are derived between emission measure-weighted coronal temperature and both L_X and F_X, and inferred ROSAT-band L_X broadly follows the canonical t^{-1.5} decay while the harder band exhibits increased scatter at >4 Gyr.
What carries the argument
Three-component thermal plasma spectral model for quiescent emission, with emission measure-weighted coronal temperature serving as the link to luminosity, flux, and age relations.
If this is right
- Temperature-informed count-rate conversions become available for faint sources.
- Bandpass conversions between ROSAT and XMM-Newton depend on the coronal temperature.
- Several stars show excess activity that may indicate age errors, inclination effects, or unresolved companions.
- Some outlier stars are potential direct imaging targets whose activity could influence planetary atmospheric evolution.
Where Pith is reading between the lines
- Better age determination techniques could reduce observed scatter in the harder X-ray band for older stars.
- The temperature relations may improve X-ray property estimates for stars lacking detailed spectra.
- Outlier identification highlights the need to account for multiplicity and viewing angle when using activity as an age proxy.
Load-bearing premise
The age estimates for the 85 stars are accurate and unbiased enough to support the reported age-activity relations and outlier identifications.
What would settle it
Independent high-precision age measurements for the outlier stars that place them at ages consistent with their observed activity levels would undermine the attribution of excess activity to age errors.
Figures
read the original abstract
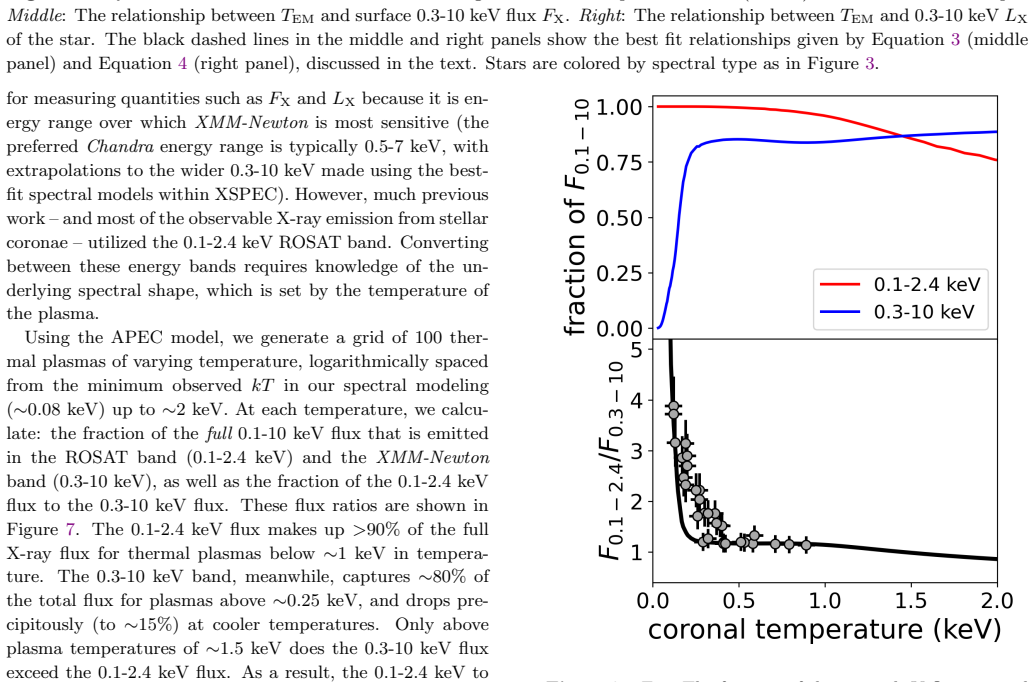
We present an analysis of XMM-Newton and Chandra observations of 85 nearby main-sequence FGK stars with age estimates ranging from 0.2-12 Gyr. We measure quiescent 0.3-10 keV luminosities, variability metrics, and multi-temperature thermal plasma spectral parameters. Quiescent spectra are typically described by three characteristic plasma components ($kT\approx0.1$, 0.4, 0.8 keV); the fraction of flux from $T\ge7$ MK rises with X-ray surface flux, reaching $\sim$50% for $F_X\gtrsim10^6$ erg cm$^{-2}$ s$^{-1}$. We derive relations between emission measure-weighted coronal temperature and both $L_X$ and $F_X$, enabling temperature-informed count-rate conversions for faint sources. We quantify how bandpass conversions (ROSAT 0.1-2.4 keV vs. XMM-Newton 0.3-10 keV) depend on temperature, and show that inferred ROSAT-band $L_X$ broadly follows the canonical $t^{-1.5}$ decay, while the harder band exhibits increased scatter at $>$4 Gyr. Several stars show excess activity suggestive of age errors, inclination effects, or unresolved companions. Some of these "outlier" stars are potential direct imaging targets for the Habitable Worlds Observatory, and detailed characterization of these stars is needed to inform their likely influence on the atmospheric evolution of orbiting planets.
Editorial analysis
A structured set of objections, weighed in public.
Referee Report
Summary. The paper analyzes XMM-Newton and Chandra observations of 85 nearby main-sequence FGK stars (ages 0.2-12 Gyr) to measure quiescent 0.3-10 keV luminosities, variability, and multi-temperature plasma spectral parameters. It reports that quiescent spectra are typically fit by three plasma components (kT≈0.1, 0.4, 0.8 keV), derives relations between emission-measure-weighted coronal temperature and both L_X and F_X, quantifies bandpass conversion factors, and finds that inferred ROSAT-band L_X broadly follows the canonical t^{-1.5} decay while the harder band shows increased scatter beyond 4 Gyr. Several outliers with excess activity are attributed to possible age errors, inclination effects, or companions.
Significance. If the supplied age estimates prove reliable and independent of the X-ray quantities, the work supplies updated empirical relations for coronal temperature and activity decay that are directly useful for interpreting faint sources and for modeling exoplanet atmospheric evolution around solar analogs. The three-component spectral characterization and temperature-dependent conversion factors are practical contributions to the field.
major comments (2)
- [Sample selection and age estimates] The headline result that ROSAT-band L_X follows the t^{-1.5} decay (and the identification of outliers) rests entirely on plotting the measured luminosities against the supplied ages for the 85 stars. The manuscript gives no information on the provenance of these ages (isochrone fitting, gyrochronology, literature compilation, etc.), their typical uncertainties, or any test for correlation between age indicators and the X-ray activity metrics; the abstract itself invokes age errors to explain outliers without quantification.
- [Observations and data analysis] The data-reduction pipeline, background-subtraction choices, definition of quiescent states, and variability metrics are not described in sufficient detail to assess whether post-hoc sample cuts or analysis decisions affect the reported relations or the scatter at >4 Gyr.
minor comments (2)
- [Spectral fitting] Clarify the exact energy bands used for the reported L_X and F_X values and how the emission-measure-weighted temperature is computed from the three-component fits.
- [Results] The statement that the fraction of flux from T≥7 MK reaches ~50% for F_X ≳10^6 erg cm^{-2} s^{-1} should be accompanied by the number of stars in that flux bin and the associated uncertainty.
Simulated Author's Rebuttal
We thank the referee for the constructive comments, which highlight areas where additional detail will improve the manuscript's clarity and utility. We address each major comment below and commit to revisions that incorporate the requested information.
read point-by-point responses
-
Referee: [Sample selection and age estimates] The headline result that ROSAT-band L_X follows the t^{-1.5} decay (and the identification of outliers) rests entirely on plotting the measured luminosities against the supplied ages for the 85 stars. The manuscript gives no information on the provenance of these ages (isochrone fitting, gyrochronology, literature compilation, etc.), their typical uncertainties, or any test for correlation between age indicators and the X-ray activity metrics; the abstract itself invokes age errors to explain outliers without quantification.
Authors: We agree that provenance, uncertainties, and correlation tests for the age estimates are essential for interpreting the t^{-1.5} relation and outliers. The revised manuscript will add a dedicated subsection in the sample description that specifies the sources and methods for the 85 age estimates (primarily compiled literature values based on isochrones and gyrochronology), reports typical uncertainties, and includes explicit checks for any correlation between age indicators and X-ray metrics. We will also quantify the possible contribution of age errors to the outliers. revision: yes
-
Referee: [Observations and data analysis] The data-reduction pipeline, background-subtraction choices, definition of quiescent states, and variability metrics are not described in sufficient detail to assess whether post-hoc sample cuts or analysis decisions affect the reported relations or the scatter at >4 Gyr.
Authors: We concur that insufficient methodological detail limits assessment of potential biases. The revised manuscript will substantially expand the 'Observations and Data Analysis' section to provide a complete description of the XMM-Newton and Chandra data-reduction pipeline, background-subtraction procedures, criteria used to define quiescent intervals, and the computation of all variability metrics. Any analysis choices that could influence the reported relations or scatter will be explicitly noted. revision: yes
Circularity Check
No significant circularity; observational analysis with external age inputs
full rationale
The paper measures quiescent X-ray luminosities, variability, and multi-temperature plasma parameters directly from XMM-Newton and Chandra observations of 85 FGK stars. It derives empirical relations between emission measure-weighted temperature and L_X/F_X from these measurements, quantifies bandpass conversions, and observes that inferred ROSAT-band L_X broadly follows the referenced canonical t^{-1.5} decay when plotted against the supplied external age estimates (0.2-12 Gyr). No step reduces the reported decay trend, temperature relations, or outlier identifications back to quantities defined by the same fit or self-citation; ages are treated as independent inputs rather than derived quantities, and the canonical decay is invoked only for comparison. This matches the default expectation of a non-circular observational study.
Axiom & Free-Parameter Ledger
free parameters (2)
- three characteristic plasma temperatures (0.1, 0.4, 0.8 keV)
- age estimates for the 85 stars
axioms (2)
- domain assumption X-ray emission from main-sequence FGK stars can be adequately modeled as multi-temperature thermal plasma in collisional ionization equilibrium
- domain assumption The provided stellar age estimates are reliable enough to trace evolutionary trends
Reference graph
Works this paper leans on
-
[1]
Airapetian, V. S., Glocer, A., Khazanov, G. V., et al. 2017, ApJL, 836, L3, doi: 10.3847/2041-8213/836/1/L3
-
[2]
Arnaud, K. A. 1996, in Astronomical Society of the Pacific Conference Series, Vol. 101, Astronomical Data Analysis Software and Systems V, ed. G. H. Jacoby & J. Barnes, 17 Astropy Collaboration, Robitaille, T. P., Tollerud, E. J., et al. 2013, A&A, 558, A33, doi: 10.1051/0004-6361/201322068 Astropy Collaboration, Price-Whelan, A. M., Sip˝ ocz, B. M., et a...
-
[3]
2025, AJ, 169, 281, doi: 10.3847/1538-3881/adc570
Ayres, T. 2025, AJ, 169, 281, doi: 10.3847/1538-3881/adc570
-
[4]
Barnes, S. A. 2007, ApJ, 669, 1167, doi: 10.1086/519295
doi:10.1086/519295 2007
-
[5]
Bellotti, S., Petit, P., Jeffers, S. V., et al. 2025, A&A, 693, A269, doi: 10.1051/0004-6361/202452378
-
[6]
A., Peacock, S., Schwieterman, E
Binder, B. A., Peacock, S., Schwieterman, E. W., et al. 2024, ApJS, 275, 1, doi: 10.3847/1538-4365/ad71d6
-
[7]
2020, ApJ, 896, 131, doi: 10.3847/1538-4357/ab8fad
Bixel, A., & Apai, D. 2020, ApJ, 896, 131, doi: 10.3847/1538-4357/ab8fad
-
[8]
Blunt, S., Nielsen, E. L., Newton, E. R., et al. 2025, Journal of Astronomical Telescopes, Instruments, and Systems, 11, 042214, doi: 10.1117/1.JATIS.11.4.042214 Bus` a, I., Aznar Cuadrado, R., Terranegra, L., Andretta, V., & Gomez, M. T. 2007, A&A, 466, 1089, doi: 10.1051/0004-6361:20065588
-
[9]
Checlair, J. H., Villanueva, G. L., Hayworth, B. P. C., et al. 2021, AJ, 161, 150, doi: 10.3847/1538-3881/abdb36
-
[10]
2000, A&A, 353, 666
Chmielewski, Y. 2000, A&A, 353, 666
2000
-
[11]
W., Sheets, J., Cohen, M., et al
Claire, M. W., Sheets, J., Cohen, M., et al. 2012, ApJ, 757, 95, doi: 10.1088/0004-637X/757/1/95 16
-
[12]
V., Lammer, H., Odert, P., et al
Erkaev, N. V., Lammer, H., Odert, P., et al. 2013, Astrobiology, 13, 1011, doi: 10.1089/ast.2012.0957
-
[13]
Feigelson, E. D., Kashyap, V. L., & Siemiginowska, A. 2022, in Handbook of X-ray and Gamma-ray Astrophysics, 119, doi: 10.1007/978-981-16-4544-0 135-1
-
[14]
Feng, F., Butler, R. P., Vogt, S. S., et al. 2022, ApJS, 262, 21, doi: 10.3847/1538-4365/ac7e57
-
[15]
Folsom, C. P., Fossati, L., Wood, B. E., et al. 2018, MNRAS, 481, 5286, doi: 10.1093/mnras/sty2494
-
[16]
Fruscione, A., McDowell, J. C., Allen, G. E., et al. 2006, in Society of Photo-Optical Instrumentation Engineers (SPIE) Conference Series, Vol. 6270, Society of Photo-Optical Instrumentation Engineers (SPIE) Conference Series, ed. D. R. Silva & R. E. Doxsey, 62701V, doi: 10.1117/12.671760
-
[17]
1993, A&A, 271, 451 Gaia Collaboration, Vallenari, A., Brown, A
Fuhrmann, K., Axer, M., & Gehren, T. 1993, A&A, 271, 451 Gaia Collaboration, Vallenari, A., Brown, A. G. A., et al. 2023, A&A, 674, A1, doi: 10.1051/0004-6361/202243940
-
[18]
2017, ApJL, 844, L13, doi: 10.3847/2041-8213/aa7eca
Cohen, O. 2017, ApJL, 844, L13, doi: 10.3847/2041-8213/aa7eca
-
[19]
Gray, R. O., Corbally, C. J., Garrison, R. F., et al. 2006, AJ, 132, 161, doi: 10.1086/504637 G¨ udel, M. 1997, ApJL, 480, L121, doi: 10.1086/310628 —. 2004, A&A Rv, 12, 71, doi: 10.1007/s00159-004-0023-2 G¨ udel, M., Guinan, E. F., & Skinner, S. L. 1997, ApJ, 483, 947, doi: 10.1086/304264
doi:10.1086/504637 2006
-
[20]
Johnstone, C. P., Bartel, M., & G¨ udel, M. 2021a, A&A, 649, A96, doi: 10.1051/0004-6361/202038407
-
[21]
Johnstone, C. P., & G¨ udel, M. 2015, A&A, 578, A129, doi: 10.1051/0004-6361/201425283
-
[22]
Johnstone, C. P., Lammer, H., Kislyakova, K. G., Scherf, M., & G¨ udel, M. 2021b, Earth and Planetary Science Letters, 576, 117197, doi: 10.1016/j.epsl.2021.117197
-
[23]
I., Kulikov, Y
Lammer, H., Lichtenegger, H. I., Kulikov, Y. N., et al. 2007, Astrobiology, 7, 185
2007
-
[24]
Linsky, J. L., Wood, B. E., Youngblood, A., et al. 2020, ApJ, 902, 3, doi: 10.3847/1538-4357/abb36f
-
[25]
F., Dutra-Ferreira, L., & Ribas, I
Lorenzo-Oliveira, D., Porto de Mello, G. F., Dutra-Ferreira, L., & Ribas, I. 2016, A&A, 595, A11, doi: 10.1051/0004-6361/201628825
-
[26]
Lorenzo-Oliveira, D., Freitas, F. C., Mel´ endez, J., et al. 2018, A&A, 619, A73, doi: 10.1051/0004-6361/201629294
-
[27]
Lyons, T. W., Reinhard, C. T., & Planavsky, N. J. 2014, Nature, 506, 307, doi: 10.1038/nature13068
-
[28]
Mamajek, E. E., & Hillenbrand, L. A. 2008, ApJ, 687, 1264, doi: 10.1086/591785
doi:10.1086/591785 2008
-
[29]
2015, ApJL, 799, L23, doi: 10.1088/2041-8205/799/2/L23
Chabrier, G. 2015, ApJL, 799, L23, doi: 10.1088/2041-8205/799/2/L23
-
[30]
2021, Space Science Reviews, 217, 2
Scherf, M., & Lammer, H. 2021, Space Science Reviews, 217, 2
2021
-
[31]
2024, Astrobiology, 24, e916, doi: 10.1089/ast.2023.0076
Scherf, M., Lammer, H., & Spross, L. 2024, Astrobiology, 24, e916, doi: 10.1089/ast.2023.0076
-
[32]
Schmitt, J. H. M. M. 1997, A&A, 318, 215
1997
-
[33]
Schwieterman, E. W., Kiang, N. Y., Parenteau, M. N., et al. 2018, Astrobiology, 18, 663, doi: 10.1089/ast.2017.1729
-
[34]
Shoda, M., Suzuki, T. K., Matt, S. P., et al. 2020, ApJ, 896, 123, doi: 10.3847/1538-4357/ab94bf
-
[35]
1972, ApJ, 171, 565, doi: 10.1086/151310
Skumanich, A. 1972, ApJ, 171, 565, doi: 10.1086/151310
doi:10.1086/151310 1972
-
[36]
Soderblom, D. R. 2010, ARA&A, 48, 581, doi: 10.1146/annurev-astro-081309-130806 Souza dos Santos, P. V., Porto de Mello, G. F.,
-
[37]
2024, MNRAS, 532, 563, doi: 10.1093/mnras/stae1532
Costa-Bhering, E., et al. 2024, MNRAS, 532, 563, doi: 10.1093/mnras/stae1532
-
[38]
Stassun, K. G., Oelkers, R. J., Paegert, M., et al. 2019, AJ, 158, 138, doi: 10.3847/1538-3881/ab3467
-
[39]
2007, A&A, 468, 463, doi: 10.1051/0004-6361:20066043
Stelzer, B., Flaccomio, E., Briggs, K., et al. 2007, A&A, 468, 463, doi: 10.1051/0004-6361:20066043
-
[40]
Takeda, G., Ford, E. B., Sills, A., et al. 2007, ApJS, 168, 297, doi: 10.1086/509763
doi:10.1086/509763 2007
-
[41]
2005, ApJ, 622, 653, doi: 10.1086/428109
Telleschi, A., G¨ udel, M., Briggs, K., et al. 2005, ApJ, 622, 653, doi: 10.1086/428109
doi:10.1086/428109 2005
-
[42]
Testa, P., Saar, S. H., & Drake, J. J. 2015, Philosophical Transactions of the Royal Society of London Series A, 373, 20140259, doi: 10.1098/rsta.2014.0259
-
[43]
Tian, F., Kasting, J. F., Liu, H.-L., & Roble, R. G. 2008, Journal of Geophysical Research (Planets), 113, E05008, doi: 10.1029/2007JE002946
-
[44]
Tu, L., Johnstone, C. P., G¨ udel, M., & Lammer, H. 2015, A&A, 577, L3, doi: 10.1051/0004-6361/201526146
-
[45]
Turnbull, M. C. 2015, arXiv, doi: 10.48550/arXiv.1510.01731
-
[46]
Vaiana, G. S., Cassinelli, J. P., Fabbiano, G., et al. 1981, ApJ, 245, 163, doi: 10.1086/158797
doi:10.1086/158797 1981
-
[47]
Valenti, J. A., & Fischer, D. A. 2005, ApJS, 159, 141, doi: 10.1086/430500
doi:10.1086/430500 2005
-
[48]
1993, Advances in Space Research, 13, 391, doi: 10.1016/0273-1177(93)90147-4
Voges, W. 1993, Advances in Space Research, 13, 391, doi: 10.1016/0273-1177(93)90147-4
-
[49]
1999, A&A, 349, 389, doi: 10.48550/arXiv.astro-ph/9909315
Voges, W., Aschenbach, B., Boller, T., et al. 1999, A&A, 349, 389, doi: 10.48550/arXiv.astro-ph/9909315
-
[50]
2018, ApJ, 862, 66, doi: 10.3847/1538-4357/aaccf6
Poppenhaeger, K. 2018, ApJ, 862, 66, doi: 10.3847/1538-4357/aaccf6
-
[51]
Wright, N. J., Drake, J. J., Mamajek, E. E., & Henry, G. W. 2011, ApJ, 743, 48, doi: 10.1088/0004-637X/743/1/48
discussion (0)
Sign in with ORCID, Apple, or X to comment. Anyone can read and Pith papers without signing in.