The Persistent Non-Response Bias in a Sample-Matched Poll for the 2024 U.S. Presidential Election
Pith reviewed 2026-06-27 05:27 UTC · model grok-4.3
The pith
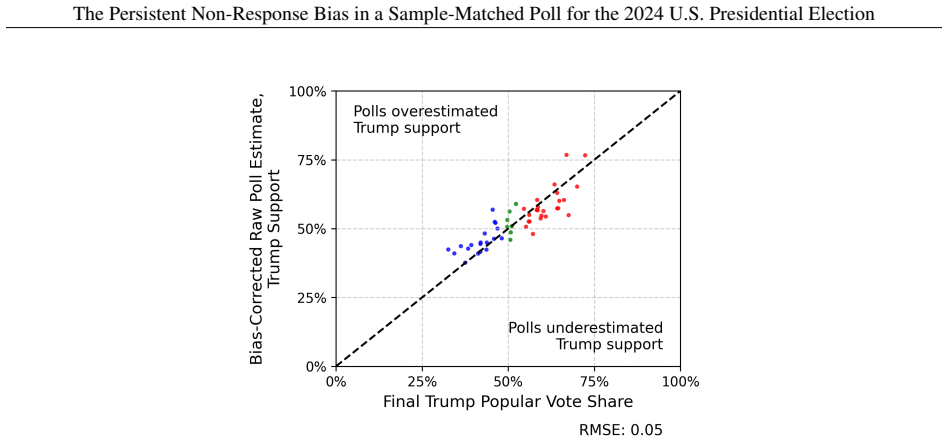
Non-response bias against Trump voters persisted in 2024 sample-matched polls at levels similar to 2016, and a correction using only prior election data reduces RMSE from 0.13 to 0.05.
A machine-rendered reading of the paper's core claim, the machinery that carries it, and where it could break.
Core claim
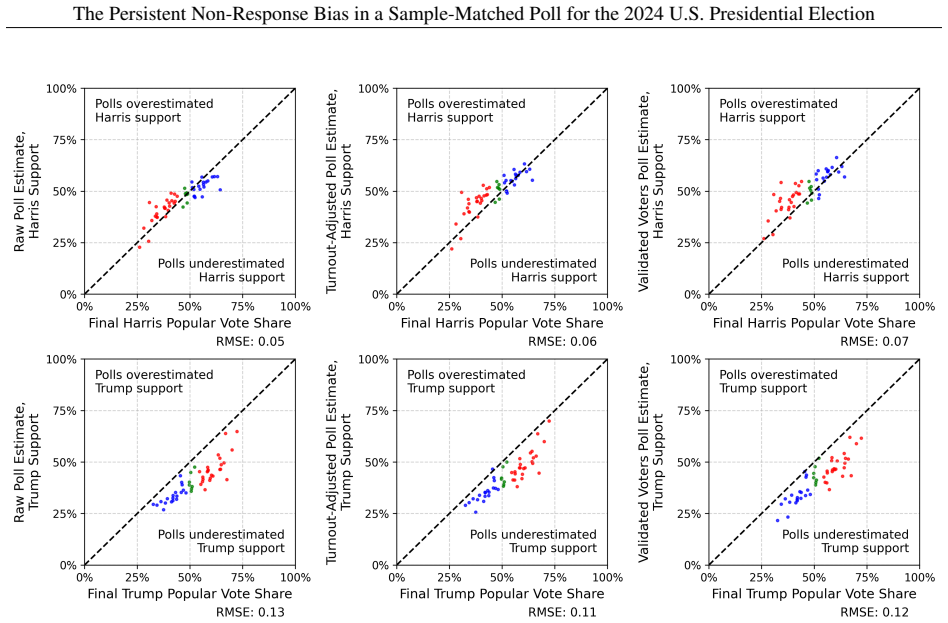
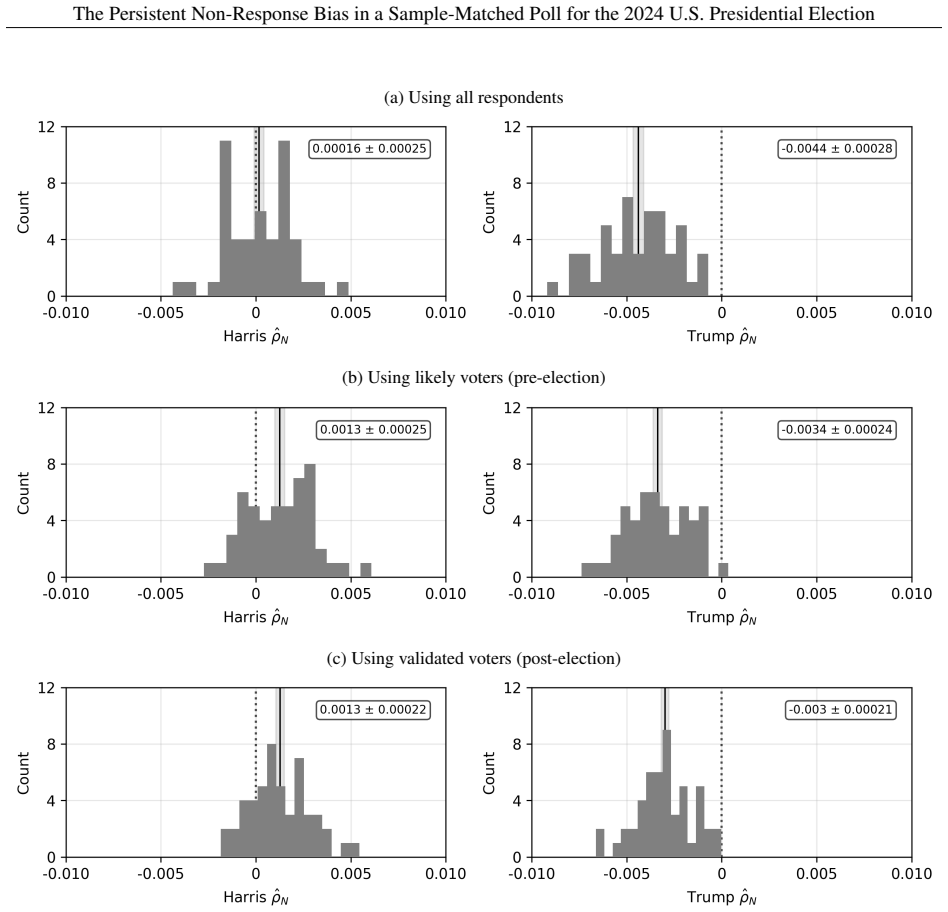
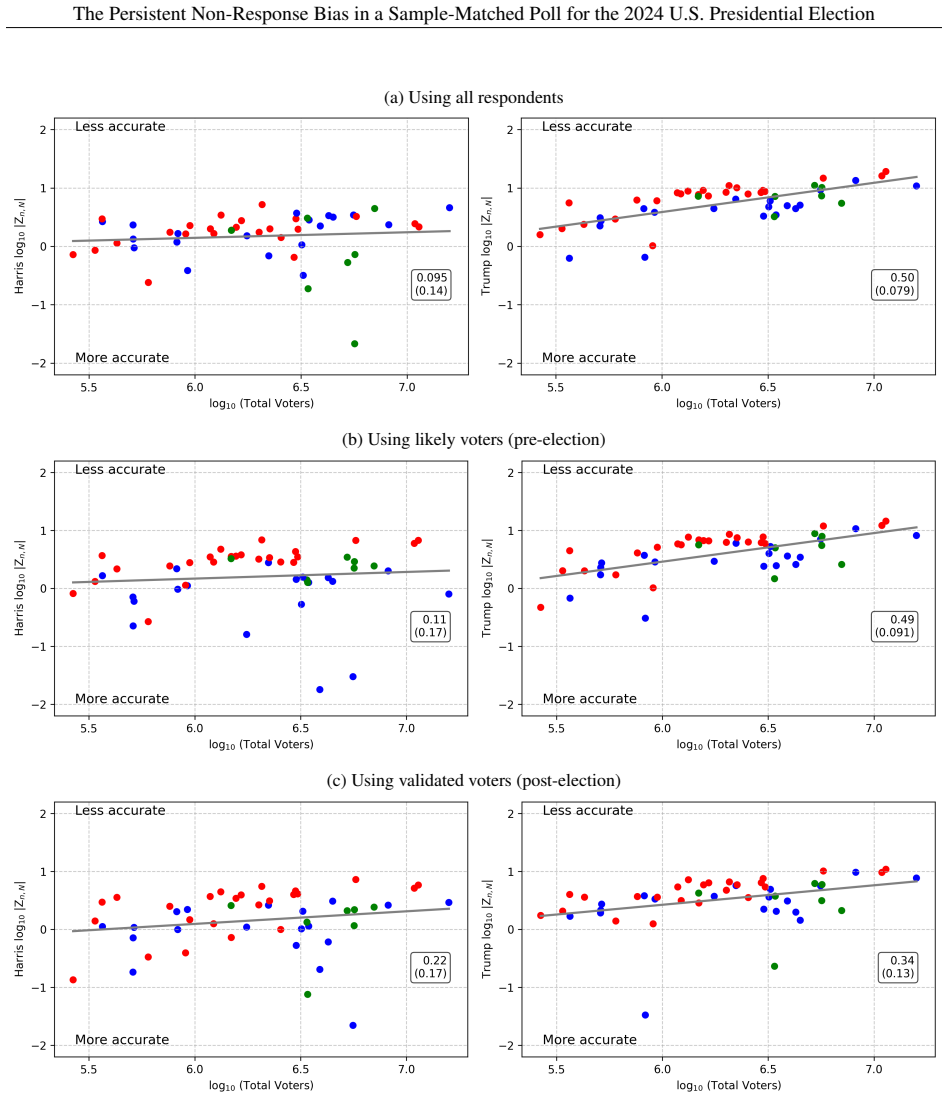
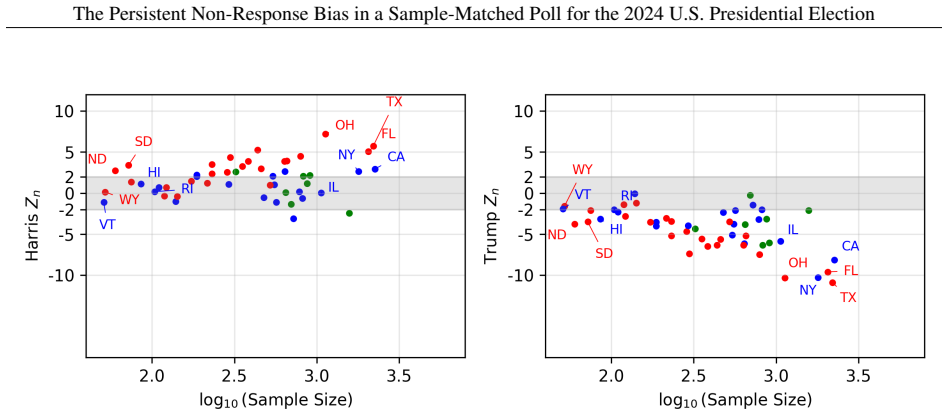
Reanalysis of the Cooperative Election Study shows non-response bias for Trump voters at ρ = -0.0030 in 2024, close to the -0.0045 value recorded in 2016, even after sample matching to the U.S. adult population. Positive response bias for Harris voters emerges after turnout adjustment. Errors scale with state population size, and effective sample sizes fall by more than 99 percent in the largest states. A pre-election bias correction estimator, informed only by historical defect correlations and turnout rates, lowers RMSE from 0.13 to 0.05 and matches the performance of post-election weighting at 0.09.
What carries the argument
The data defect correlation, which measures the association between an individual's probability of responding to the survey and their vote choice, used to quantify and correct persistent non-response bias.
If this is right
- Polling errors continue to grow with state population size unless the historical correction is applied.
- Standard confidence intervals become increasingly unreliable as sample size increases because of the large reduction in effective sample size.
- Pre-election adjustments based on past cycles can reach accuracy levels previously available only after election results are known.
- Sample matching to demographics alone leaves measurable non-response bias intact across election cycles.
Where Pith is reading between the lines
- The method could be tested prospectively on the next national election by applying the same historical parameters before votes are counted.
- If defect correlations prove stable across cycles, survey designers may shift resources from larger matched samples toward bias modeling.
- The same correction logic may apply to other surveys where response propensity correlates with the measured outcome, such as health or economic polls.
Load-bearing premise
The data defect correlation values and turnout adjustments observed in prior elections remain stable and transferable predictors for correcting 2024 sample-matched polls without additional 2024-specific fitting.
What would settle it
Re-running the proposed estimator on 2024 state-level outcomes and obtaining an RMSE materially above 0.05 or worse than the post-election weighting benchmark of 0.09.
Figures
read the original abstract
Donald Trump won the 2024 US Presidential Election despite polls predicting a Democratic lead, echoing the polling miss in 2016. Using the data defect correlation framework, we revisit the 60,000-respondent Cooperative Election Study and find that non-response bias for Trump voters persists on the same order of magnitude ($\rho=-0.0030$ vs $-0.0045$ in 2016) even under sample-matching to the US adult population. We additionally find evidence of positive response bias for Harris voters after adjusting for turnout. Consistent with findings in 2016, polling errors scale with state population size, and larger samples produce greater departures from conventional confidence intervals, with reductions of effective sample size exceeding 99% in the largest states. We propose a pre-election bias correction estimator informed by historical data defect correlations and turnout rates that decreases RMSE from 0.13 to 0.05 using only prior election data, comparable to post-election weighting (RMSE 0.09).
Editorial analysis
A structured set of objections, weighed in public.
Referee Report
Summary. The paper claims that non-response bias persists in sample-matched polls for the 2024 U.S. Presidential Election at a data defect correlation of ρ=-0.0030 (vs. -0.0045 in 2016) even after matching to the US adult population, with evidence of positive response bias for Harris voters after turnout adjustment. It further claims that polling errors scale with state population size and that a pre-election bias correction estimator, informed only by historical data defect correlations and turnout rates, reduces RMSE from 0.13 to 0.05 (comparable to post-election weighting at RMSE 0.09).
Significance. If the transferability assumption holds, the work offers a notable contribution by demonstrating persistent non-response bias in modern sample-matched polls and providing a concrete pre-election correction method that achieves substantial RMSE improvement using only prior-election data. The explicit reporting of metrics such as ρ values and RMSE reductions, along with the population-size scaling observation, strengthens the empirical grounding and has clear implications for survey methodology and election polling practice.
major comments (2)
- [Proposed pre-election bias correction estimator] The central RMSE reduction claim (0.13 to 0.05) for the pre-election estimator is load-bearing on the assumption that 2016-era data defect correlations (≈−0.0045) and turnout adjustments transfer stably to 2024 without refitting; the manuscript provides no sensitivity analysis, cross-validation, or robustness check against plausible deviations in these historical parameters (e.g., due to mode shifts or candidate effects), leaving the out-of-sample performance unverified.
- [Data defect correlation framework and 2024 CES analysis] The reported 2024 CES ρ=-0.0030 is presented as comparable to the historical value used in the estimator, but the text does not explicitly confirm that the estimator's application to 2024 polls withholds all 2024 information (including any indirect use via turnout rates or sample-matching details); this distinction is required to substantiate the pre-election and non-circular nature of the RMSE improvement.
minor comments (1)
- [Abstract] The abstract states that 'larger samples produce greater departures from conventional confidence intervals' and 'reductions of effective sample size exceeding 99% in the largest states' without naming the states, providing the exact effective-sample-size formula, or showing the supporting table/figure; adding these details would aid reproducibility.
Simulated Author's Rebuttal
We thank the referee for their careful reading and constructive comments, which help clarify key aspects of our pre-election estimator. We address each major comment below and have revised the manuscript accordingly to improve transparency and robustness.
read point-by-point responses
-
Referee: [Proposed pre-election bias correction estimator] The central RMSE reduction claim (0.13 to 0.05) for the pre-election estimator is load-bearing on the assumption that 2016-era data defect correlations (≈−0.0045) and turnout adjustments transfer stably to 2024 without refitting; the manuscript provides no sensitivity analysis, cross-validation, or robustness check against plausible deviations in these historical parameters (e.g., due to mode shifts or candidate effects), leaving the out-of-sample performance unverified.
Authors: We agree that a sensitivity analysis would strengthen the transferability claim. The manuscript relies on the empirical similarity between the 2016 ρ value and the independently observed 2024 CES ρ, but does not include formal robustness checks. We will add an appendix with sensitivity analyses that vary the input historical ρ by plausible ranges (e.g., ±20% around −0.0045) and recompute the corrected estimates and RMSE; preliminary checks indicate the RMSE reduction remains substantial across these ranges. This revision will directly address the out-of-sample verification concern. revision: yes
-
Referee: [Data defect correlation framework and 2024 CES analysis] The reported 2024 CES ρ=-0.0030 is presented as comparable to the historical value used in the estimator, but the text does not explicitly confirm that the estimator's application to 2024 polls withholds all 2024 information (including any indirect use via turnout rates or sample-matching details); this distinction is required to substantiate the pre-election and non-circular nature of the RMSE improvement.
Authors: We appreciate the referee's emphasis on explicit separation of information. The estimator is constructed solely from 2016 data defect correlations and pre-2024 turnout rates; no 2024 CES data, sample-matching weights, or 2024 turnout information enters the correction applied to the 2024 polls. The 2024 CES ρ is reported only as a post-hoc validation of bias persistence and plays no role in the estimator. We will revise the methods and results sections to state this information partition explicitly, including a sentence confirming that the RMSE calculation uses only historical inputs. revision: yes
Circularity Check
No circularity: out-of-sample transfer of historical parameters
full rationale
The paper's central estimator is constructed exclusively from prior-election data defect correlations and turnout rates, then applied to 2024 sample-matched polls; the reported RMSE reduction (0.13 to 0.05) is computed against actual 2024 election outcomes, which are external to the parameter estimation step. No equations or claims reduce the 2024 correction to a fit that includes 2024 data, and no self-citation or uniqueness theorem is invoked. The stability assumption is stated as an assumption rather than derived, making the evaluation a genuine out-of-sample test rather than a tautology.
Axiom & Free-Parameter Ledger
axioms (1)
- domain assumption The data defect correlation framework applies directly to sample-matched polls and can be used to quantify non-response bias.
Reference graph
Works this paper leans on
-
[1]
2024 Presidential Election Polls,
270toWin. 2024 Presidential Election Polls,
2024
-
[2]
Michael A
URLhttps://www.270towin.com/ 2024-presidential-election-polls/. Michael A. Bailey. A New Paradigm for Polling.Harvard Data Science Review, 5(3), July
2024
-
[3]
doi: 10.1162/99608f92.9898eede
ISSN 2644- 2353, 688-8513. doi: 10.1162/99608f92.9898eede. URLhttps://hdsr.mitpress.mit.edu/pub/ejk5yhgv/ release/4. Michael A. Bailey.Polling at a crossroads: Rethinking modern survey research. Methodological tools in the social sciences. Cambridge University Press, Cambridge,
-
[4]
ISSN 0362-4331. URLhttps://www.nytimes.com/interactive/2016/09/ 20/upshot/the-error-the-polling-world-rarely-talks-about.html,https://www.nytimes.com/ interactive/2016/09/20/upshot/the-error-the-polling-world-rarely-talks-about.html. Nate Cohn. Polling and the 2024 election, December
2016
-
[5]
Cook Political Report
URLhttps://news.berkeley.edu/2023/12/01/ berkeley-talks-nate-cohn-polling/. Cook Political Report. 2024 CPR President Race Ratings,
2023
-
[6]
Alexander Coppock
URLhttps://www.cookpolitical.com/ ratings/presidential-race-ratings. Alexander Coppock. Did Shy Trump Supporters Bias the 2016 Polls? Evidence from a Nationally-representative List Experiment.Statistics, Politics and Policy, 8(1):29–40, October
2016
-
[7]
ISSN 2151-7509, 2194-6299. doi: 10.1515/ spp-2016-0005. URLhttps://www.degruyter.com/document/doi/10.1515/spp-2016-0005/html. Jeff Dominitz and Charles F. Manski. Using Total Margin of Error to Account for Non-Sampling Error in Election Polls: The Case of Nonresponse, October
-
[8]
URLhttp://arxiv.org/abs/2407.19339. arXiv:2407.19339 [econ]. Federal Election Commission (FEC). Election results and voting information,
-
[9]
Federal Election Commission
URLhttps://www.fec.gov/ introduction-campaign-finance/election-results-and-voting-information/. Federal Election Commission. 2024 Presidential Election Results. Report, Federal Election Commission, January
2024
-
[10]
FiveThirtyEight
URLhttps://www.fec.gov/resources/cms-content/documents/2024presgeresults.pdf. FiveThirtyEight. State of the Polls 2024,
2024
-
[11]
Andrew Gelman, Ben Goodrich, and Geonhee Han
URLhttps://github.com/fivethirtyeight/data/tree/ master/state-of-the-polls-2024. Andrew Gelman, Ben Goodrich, and Geonhee Han. Grappling With Uncertainty in Forecasting the 2024 U.S. Pres- idential Election.Harvard Data Science Review, 6(4), October
2024
-
[12]
ISSN 2644-2353,. doi: 10.1162/99608f92. a919e3fa. URLhttps://hdsr.mitpress.mit.edu/pub/yoa73r1m/release/1. Michael Isakov and Shiro Kuriwaki. Towards principled unskewing: Viewing 2020 election polls through a corrective lens from 2016.Harvard Data Science Review, 2(4):69,
-
[13]
Michael McDonald
URLhttps://assets.pubpub.org/y42o9vjw/ 51603809090456.pdf. Michael McDonald. 2016 General Election Turnout Rates (v1.0),
2016
-
[14]
Michael McDonald
URLhttps://election.lab.ufl.edu/ dataset/2016-general-election-turnout-rates/. Michael McDonald. 2024 General Election Turnout Rates (v0.3),
2016
-
[15]
Xiao-Li Meng
URLhttps://election.lab.ufl.edu/ dataset/2024-general-election-turnout-rates-v0-3/. Xiao-Li Meng. Statistical paradises and paradoxes in big data (I): Law of large populations, big data paradox, and the 2016 US presidential election.The Annals of Applied Statistics, 12(2), June
2024
-
[16]
ISSN 1932-6157. doi:
1932
-
[17]
URLhttps://projecteuclid.org/journals/annals-of-applied-statistics/ volume-12/issue-2/Statistical-paradises-and-paradoxes-in-big-data-I--Law/10.1214/ 18-AOAS1161SF.full
1214/18-AOAS1161SF. URLhttps://projecteuclid.org/journals/annals-of-applied-statistics/ volume-12/issue-2/Statistical-paradises-and-paradoxes-in-big-data-I--Law/10.1214/ 18-AOAS1161SF.full. Brian Schaffner, Marissa Shih, Stephen Ansolabehere, and Jeremy Pope. Cooperative Election Study Common Content, 2024, April
2024
-
[18]
URLhttps://dataverse.harvard.edu/dataset.xhtml?persistentId=doi: 10.7910/DVN/X11EP6. U.S. Census Bureau. 2023 american community survey 1-year estimates,
-
[19]
10 The Persistent Non-Response Bias in a Sample-Matched Poll for the 2024 U.S
URLhttps://data.census.gov. 10 The Persistent Non-Response Bias in a Sample-Matched Poll for the 2024 U.S. Presidential Election Appendix A Data Availability Statement All data used in this study are publicly available from third-party sources: •Cooperative Election Study (CES) 2024 Common Content.The 60,000-respondent survey analyzed throughout this pape...
-
[20]
I’m not sure
in each state for the 2024 US presidential election. Table D.1: Sample size, total votes, effective sample size and percentage reduction of samples in each state for the 2024 US presidential election State Sample size Total votes Effective sample size Percentage reduction Alabama 882 2,256,352 20 97.71% Alaska 117 338,177 18 84.72% Arizona 1,162 3,389,319...
2024
discussion (0)
Sign in with ORCID, Apple, or X to comment. Anyone can read and Pith papers without signing in.