Gravitational wave background from extreme-mass-ratio inspirals
Reviewed by Pith2026-06-27 06:11 UTCgrok-4.3pith:URZ2ZOXLopen to challenge →
The pith
The masses of compact objects determine the strength of the gravitational wave background from extreme-mass-ratio inspirals by up to an order of magnitude.
A machine-rendered reading of the paper's core claim, the machinery that carries it, and where it could break.
Core claim
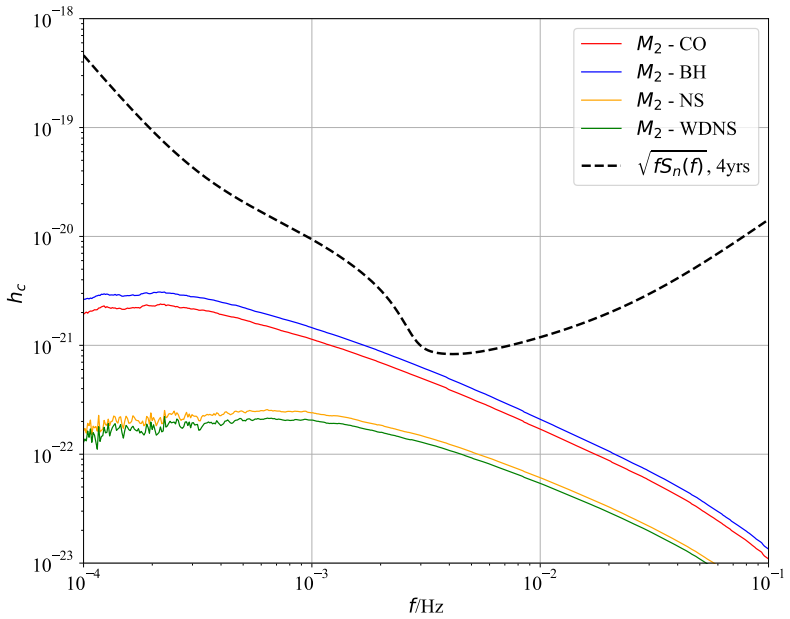
By analyzing the astrophysical distribution of EMRI sources and key parameters including the spin of supermassive black holes and the masses of compact objects, the distribution range of the characteristic strain of the GWB from EMRIs is determined. The final eccentricity distributions have negligible effect on the intensity due to rapid circularization. The spin of the SMBH enhances the GW characteristic strain by approximately 1%. The masses of COs significantly affect the characteristic strain, with BH as CO producing a GW signal intensity approximately one order of magnitude higher than NS or WD cases.
What carries the argument
The calculation of the characteristic strain of the GWB from EMRIs based on the statistical properties of source distributions and parameter variations.
Load-bearing premise
The astrophysical distribution of EMRI sources and the specific calculation methods accurately capture the statistical properties and dynamical processes in galactic centers.
What would settle it
Detection of a GWB characteristic strain level that is inconsistent with the predicted range across all tested compact object masses, or an absence of the expected difference between black hole and other compact object cases.
Figures


read the original abstract
The gravitational wave background (GWB) produced by extreme-mass-ratio inspirals (EMRIs) serves as a powerful tool for probing the astrophysical and dynamical processes in galactic centers. EMRI systems are a primary target for the space-based detector LISA due to their long-lived signals and high signal-to-noise ratios. This study explores the statistical properties of the GWB from EMRI, focusing on the calculation methods for the GWB, the astrophysical distribution of EMRI sources, and the influence of key parameters, including the spin of supermassive black holes (SMBHs) and the masses of compact objects (COs). By analyzing these factors, we determine the distribution range of the characteristic strain of the GWB from EMRIs. We find that the final eccentricity distributions appear to have negligible effect on the intensity of the GWB due to rapid circularization before they become detectable and the spin of the SMBH enhances the GW characteristic strain by approximately 1$\%$ compared to cases without spin effects. The masses of COs can also significantly affect the characteristic strain of the GWB from EMRIs, with Black Hole (BH) as CO producing a GW signal intensity that is approximately one order of magnitude higher compared to cases where Neutron Star (NS) or White Dwarf (WD) are the COs.
Editorial analysis
A structured set of objections, weighed in public.
Referee Report
Summary. The paper computes the stochastic gravitational-wave background (GWB) from extreme-mass-ratio inspirals (EMRIs) for LISA, focusing on the effects of source eccentricity distributions, supermassive black hole (SMBH) spin, and compact-object (CO) mass/type on the characteristic strain. It reports that final eccentricity distributions have negligible impact due to rapid circularization, SMBH spin increases the strain by ~1%, and black-hole COs produce ~10× higher strain than neutron-star or white-dwarf COs, with the range of strains determined by the adopted astrophysical source distributions and rates.
Significance. If the central numerical claims hold after correction for mass-dependent rates, the work would supply concrete guidance on the dominant astrophysical uncertainties in the EMRI GWB for LISA data analysis. The explicit comparison across CO types is a useful addition to the literature, but only if the underlying source-rate model is shown to be self-consistent with dynamical capture physics.
major comments (2)
- [Abstract / results on CO mass] Abstract (and presumably the results section presenting the order-of-magnitude claim): the statement that BH COs produce approximately one order of magnitude higher characteristic strain than NS/WD COs is presented as a robust outcome of the astrophysical distribution. However, the EMRI formation rate Γ must depend on m_CO through mass segregation, dynamical friction, and relaxation timescales; if the calculation normalizes the same total rate or density across CO types rather than using an m-dependent ρ(m) or τ_relax(m), the quoted factor of 10 does not reflect the integrated background. This directly undermines the central claim about CO-mass effects.
- [Methods] Methods section (as flagged by the absence of derivation steps, error bars, or exclusion criteria for the quoted 1% and order-of-magnitude numbers): the abstract supplies specific numerical outcomes without showing how the source distributions were constructed or how the GWB integral was evaluated. A full methods description is required to verify whether post-hoc choices in the rate normalization affect the reported differences.
minor comments (2)
- Notation for the characteristic strain h_c(f) and the precise definition of the GWB integral should be stated explicitly once in the text rather than assumed from prior literature.
- Figure captions should indicate whether the plotted curves correspond to fixed total rate or to m_CO-dependent capture rates.
Simulated Author's Rebuttal
We thank the referee for the careful and constructive review of our manuscript on the EMRI gravitational-wave background. The comments raise important points about the robustness of the CO-mass comparison and the level of methodological detail. We address each major comment below and have revised the manuscript to improve clarity and transparency.
read point-by-point responses
-
Referee: [Abstract / results on CO mass] Abstract (and presumably the results section presenting the order-of-magnitude claim): the statement that BH COs produce approximately one order of magnitude higher characteristic strain than NS/WD COs is presented as a robust outcome of the astrophysical distribution. However, the EMRI formation rate Γ must depend on m_CO through mass segregation, dynamical friction, and relaxation timescales; if the calculation normalizes the same total rate or density across CO types rather than using an m-dependent ρ(m) or τ_relax(m), the quoted factor of 10 does not reflect the integrated background. This directly undermines the central claim about CO-mass effects.
Authors: We agree that a mass-independent normalization would undermine the claim. Our adopted source distributions are taken from literature models that already incorporate mass segregation, dynamical friction, and relaxation timescales that differ by CO type, producing both higher per-source strain and higher effective rates for BH COs. The reported factor of ~10 therefore reflects the integrated background under those m_CO-dependent inputs. To make this explicit, we have added a dedicated paragraph in the methods section describing the rate model, citing the specific references for the m-dependent distributions, and stating that the same total rate was not imposed across CO types. revision: yes
-
Referee: [Methods] Methods section (as flagged by the absence of derivation steps, error bars, or exclusion criteria for the quoted 1% and order-of-magnitude numbers): the abstract supplies specific numerical outcomes without showing how the source distributions were constructed or how the GWB integral was evaluated. A full methods description is required to verify whether post-hoc choices in the rate normalization affect the reported differences.
Authors: We accept that the original methods section was insufficiently detailed for independent verification. We have expanded it to include: (i) the explicit form of the GWB integral and the numerical quadrature method used, (ii) the step-by-step construction of the eccentricity, spin, and mass distributions from the cited astrophysical models, and (iii) the precise normalization procedure together with any exclusion criteria applied to the Monte-Carlo realizations. These additions directly address concerns about post-hoc rate choices and allow readers to reproduce the quoted 1% and order-of-magnitude results. revision: yes
Circularity Check
No circularity: claims rest on external astrophysical inputs without reduction to self-fit
full rationale
The abstract presents results on GWB strain dependence on CO mass, SMBH spin, and eccentricity as outcomes of analyzing source distributions and calculation methods. No equations, self-citations, or derivations are provided that reduce a prediction to a fitted input by construction, nor any self-definitional loops or uniqueness theorems imported from the authors. The distribution of sources is treated as an input parameter whose effect is computed, not redefined from the output strain. This satisfies the default expectation of a non-circular paper when no load-bearing step can be quoted as equivalent to its own inputs.
Axiom & Free-Parameter Ledger
free parameters (3)
- EMRI source distribution and rate
- Compact object mass and type
- SMBH spin parameter
axioms (2)
- domain assumption Rapid circularization occurs before EMRIs become detectable
- domain assumption Standard general-relativistic waveform models apply to EMRIs
Reference graph
Works this paper leans on
-
[1]
2010 Class
Amaro-Seoane P and Gair J R et al. 2010 Class. Quantum Grav. 24 R113
2010
-
[2]
Quantum Grav
Robson T and Cornish N J and Liu C 2019 Class. Quantum Grav. 36 105011
2019
-
[3]
Laser Interferometer Space Antenna
Amaro-Seoane P et al. 2017 arXiv 1702.00786
work page internal anchor Pith review Pith/arXiv arXiv 2017
-
[4]
Thorne K S 1980 Rev. Mod. Phys. 52 299
1980
-
[5]
Rauch K P and Tremaine S 1996 New Astron. 1 149
1996
-
[6]
Tagawa H and Haiman Z and Kocsis B 2020 Astrophys. J. 898 25
2020
-
[7]
Maggiore M 2008 Gravitational Waves: Theory and Experiments (Oxford: Oxford University Press)
2008
-
[8]
Renzini A I and Goncharov B and Jenkins A C and Meyers P M 2022 arXiv 2202.00178
work page Pith review arXiv 2022
-
[9]
Christensen N 2019 Rep. Prog. Phys. 82 016903
2019
-
[10]
Barausse E 2012 Mon. Not. R. Astron. Soc. 423 2533
2012
-
[11]
Milosavljević M and Merritt D 2003 Astrophys. J. 596 860
2003
-
[12]
Barack L and Cutler C 2007 Phys. Rev. D 75 042003
2007
-
[13]
Quantum Grav
Vallisneri M 2013 Class. Quantum Grav. 30 224010
2013
-
[14]
Hughes S A 2001 Phys. Rev. D 64 064004
2001
-
[15]
Quantum Grav
Gair J R and Barack L and Creighton T and Cutler C and Larson S L and Phinney E S and Vallisneri M 2004 Class. Quantum Grav. 21 S1595
2004
-
[16]
Enoki M and Nagashima M 2007 Prog. Theor. Phys. 117 241
2007
-
[17]
Yunes N and Arun K G and Berti E and Will C M 2009 Phys. Rev. D 80 084001
2009
-
[18]
Huerta E A and McWilliams S T and Gair J R and Taylor S R 2015 Phys. Rev. D 92 063010 20
2015
-
[19]
Peters P C and Mathews J 1963 Phys. Rev. 131 435
1963
-
[20]
Finn L S and Thorne K S 2000 Phys. Rev. D 62 124021
2000
-
[21]
Babak S and Gair J and Sesana A and Barausse E and Sopuerta C F and Berry C P L and Berti E and Amaro- Seoane P and Petiteau A and Klein A 2017 Phys. Rev. D 95 103012
2017
-
[22]
Quantum Grav
Barack L 2009 Class. Quantum Grav. 26 213001
2009
-
[23]
Phinney E S 2001 arXiv 0108028
2001
-
[24]
Bonetti M and Sesana A 2020 Phys. Rev. D 102 103023
2020
-
[25]
China Phys
Li G L and Tang Y and Wu Y L 2022 Sci. China Phys. Mech. Astron. 65 109732
2022
- [26]
-
[27]
2009 Astrophys
Gültekin K et al. 2009 Astrophys. J. 698 198221
2009
-
[28]
Kormendy J and Ho L C 2013 Annu. Rev. Astron. Astrophys. 51 511653
2013
-
[29]
Graham A W and Scott N 2013 Astrophys. J. 764 151 21
2013
discussion (0)
Sign in with ORCID, Apple, or X to comment. Anyone can read and Pith papers without signing in.