Radiology-Report Semantic Modelling and Host-Response Laboratory Biomarkers for Multimodal Survival Prediction in Lung Cancer
Pith reviewed 2026-06-27 05:22 UTC · model grok-4.3
The pith
A multimodal score fusing radiology-report semantics with lab biomarkers predicts lung cancer survival and stratifies patients within TNM stages.
A machine-rendered reading of the paper's core claim, the machinery that carries it, and where it could break.
Core claim
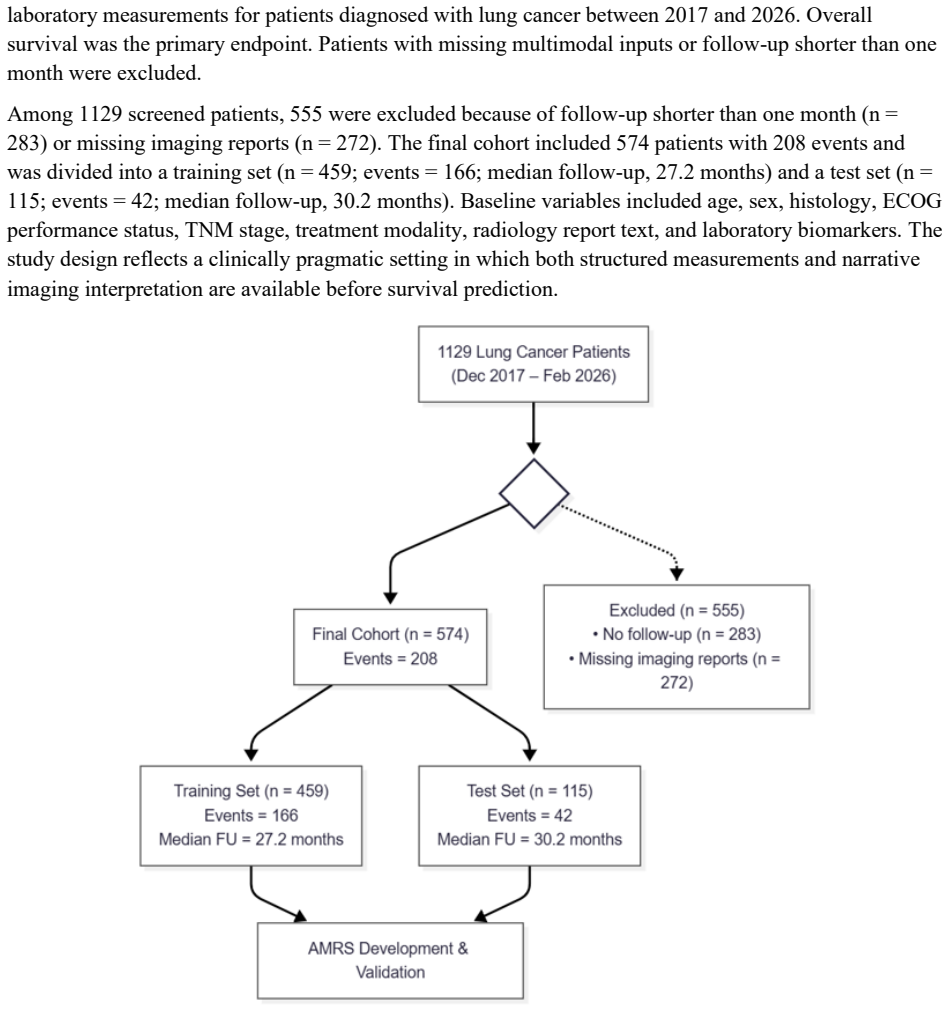
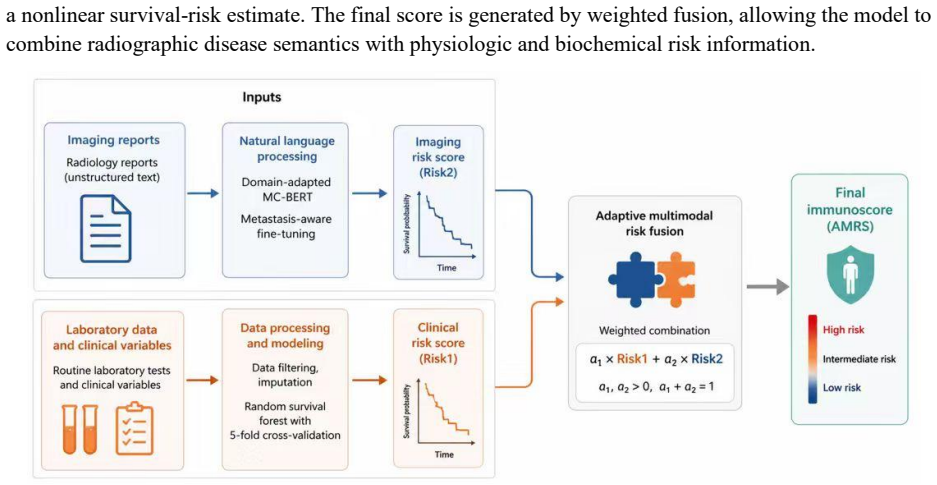
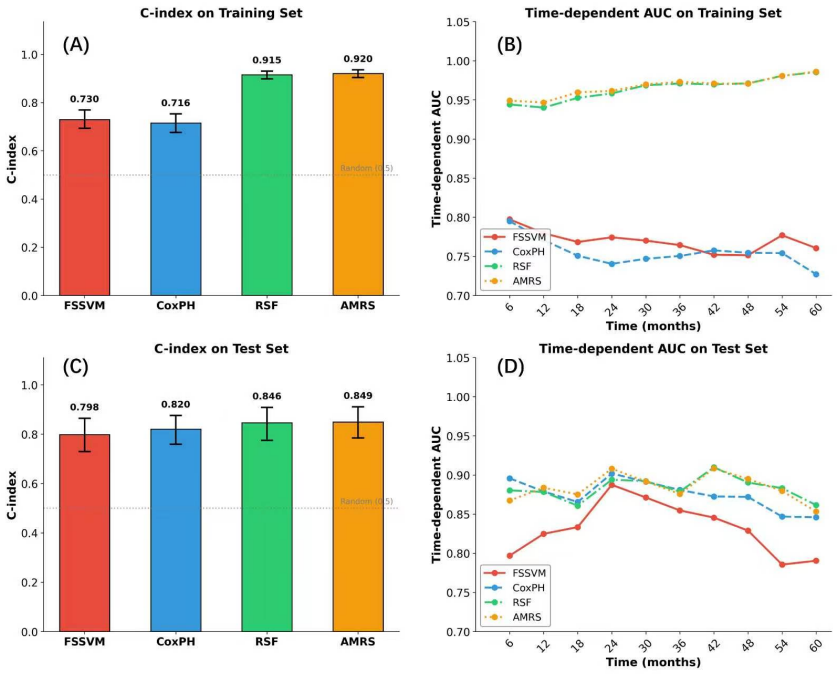
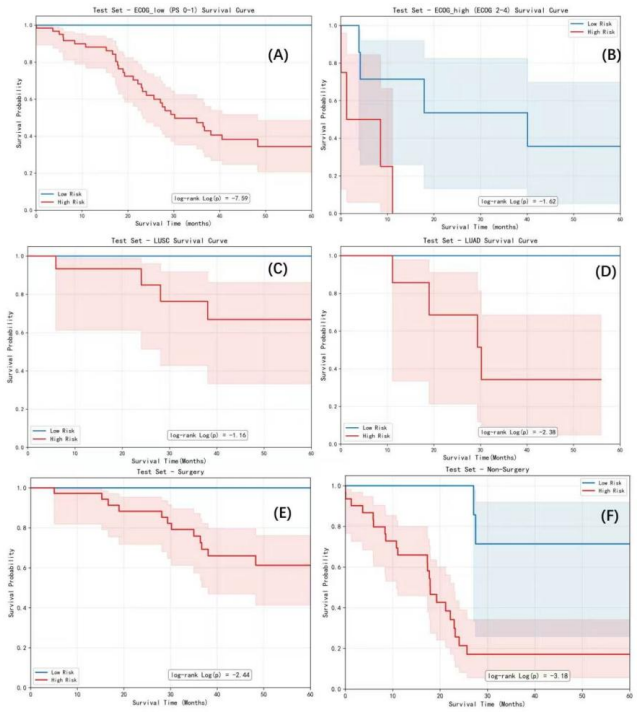
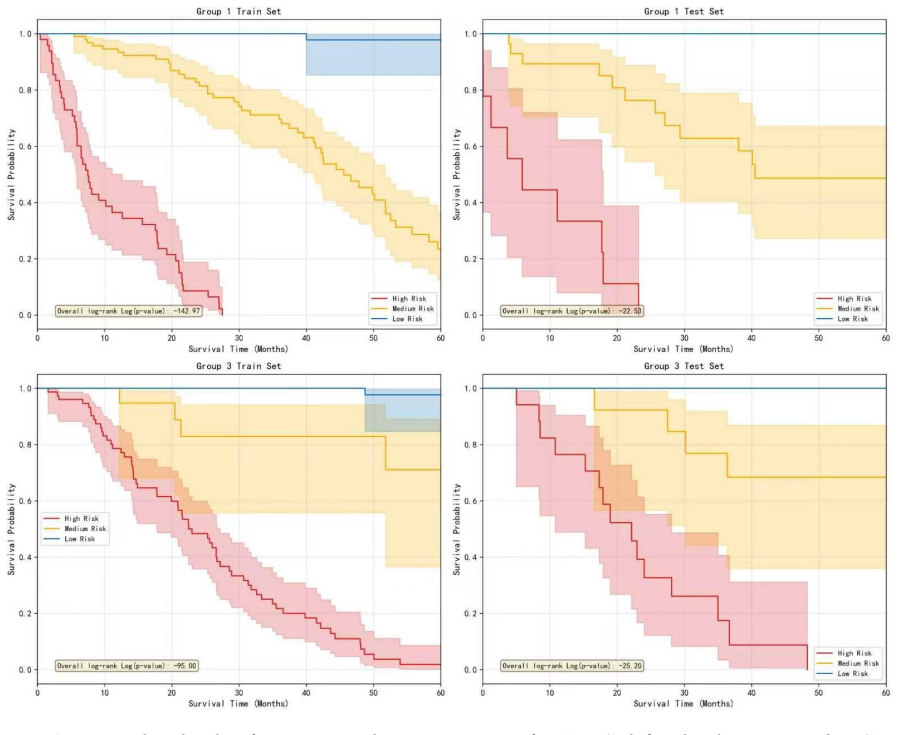
In a retrospective two-center cohort of 574 lung cancer patients the AMRS, built by encoding radiology reports with MC-BERT, imputing laboratory variables with Mahalanobis distance, modeling with random survival forests, and performing weighted risk fusion, achieved C-indexes of 0.920 (training) and 0.849 (test) and separated survival trajectories across TNM-related strata.
What carries the argument
The multimodal adaptive risk score (AMRS), which encodes radiology reports with MC-BERT and fuses them with Mahalanobis-imputed laboratory variables via random survival forests and weighted fusion.
If this is right
- AMRS can separate survival outcomes inside the same TNM stage, enabling finer risk stratification without new tests.
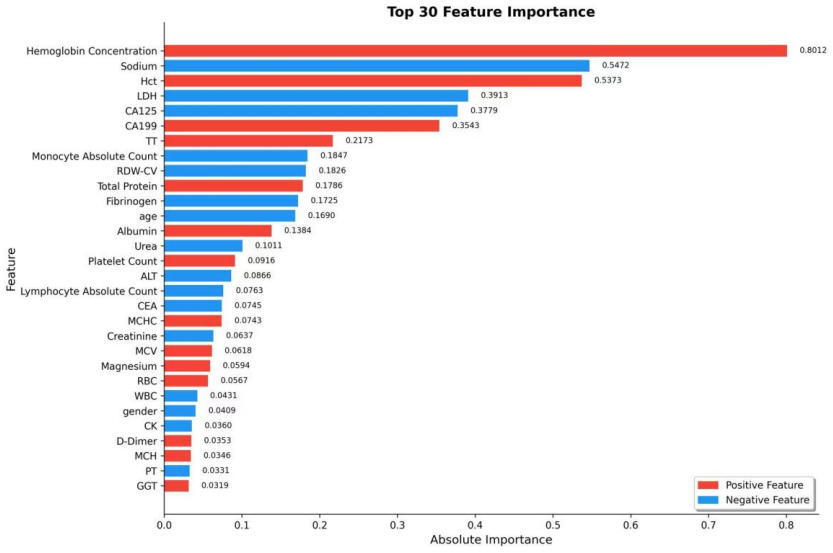
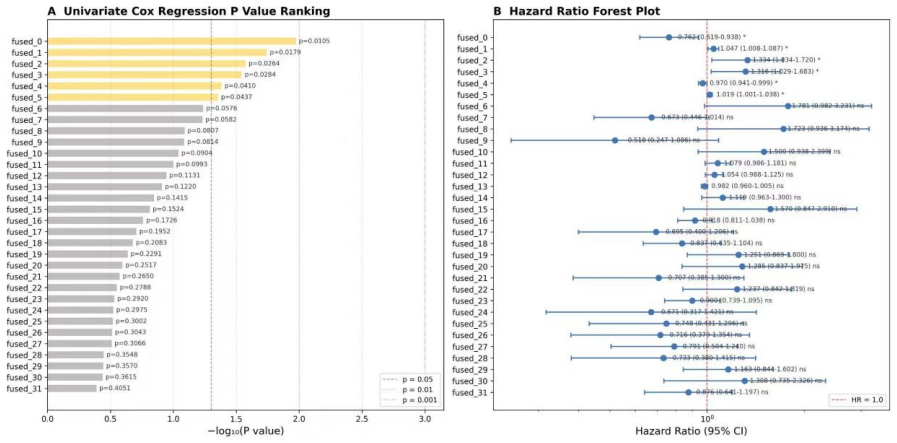
- SHAP identifies hematologic, inflammatory, coagulation, nutritional, tumor-marker, organ-function, and age-related variables as the dominant contributors.
- The fusion approach may be inserted into existing imaging-centered oncology workflows that already produce radiology reports.
- Prospective validation, calibration checks, and ablation testing are required before any clinical deployment.
Where Pith is reading between the lines
- If the weights prove stable across sites, the method could lower dependence on costly genomic assays by exploiting data already collected in routine care.
- The same report-plus-biomarker fusion pattern might transfer to other solid tumors where radiology reports are standard.
- Site-specific recalibration may be needed because the two-center retrospective design leaves open the possibility of unmeasured selection bias.
Load-bearing premise
The retrospective two-center cohort after exclusion of patients with short follow-up or missing reports remains representative of the target population and the learned fusion weights will generalize to new patients and sites.
What would settle it
A prospective multi-center validation study in which the AMRS C-index drops below 0.75 or fails to separate survival curves inside TNM strata.
Figures
read the original abstract
TNM staging is essential for lung cancer management, but patients within the same anatomic stage often show heterogeneous survival outcomes. We developed a multimodal adaptive risk score (AMRS) that integrates radiology-report semantics with routinely available clinical laboratory biomarkers. In a retrospective two-center cohort, 1129 patients diagnosed between December 2017 and February 2026 were screened; 574 patients were included after exclusion for short follow-up or missing imaging reports and were split into training (n = 459) and test (n = 115) cohorts. Radiology reports were encoded with a domain-adapted MC-BERT branch to capture imaging-derived semantic information, while clinical and laboratory variables were modeled after Mahalanobis-distance-based imputation using random survival forests. Weighted risk fusion generated the final patient-level score. AMRS achieved C-index values of 0.920 in training and 0.849 in testing, and separated survival trajectories across clinical subgroups and TNM-related strata. SHAP analysis identified hematologic, inflammatory, coagulation, nutritional, tumor-marker, organ-function, and age-related contributors. AMRS may complement TNM staging in imaging-centered oncology workflows, but prospective validation, calibration, ablation testing, and clinical-utility assessment are required before deployment.
Editorial analysis
A structured set of objections, weighed in public.
Referee Report
Summary. The manuscript describes the development of a multimodal adaptive risk score (AMRS) for survival prediction in lung cancer. It integrates semantic information from radiology reports using a domain-adapted MC-BERT model with clinical laboratory biomarkers processed via Mahalanobis-distance imputation and random survival forests. In a retrospective cohort of 574 patients from two centers (after screening 1129 and exclusions for short follow-up or missing reports), split 459/115 train/test, the AMRS achieves C-indices of 0.920 and 0.849 respectively, and demonstrates separation of survival curves across subgroups and TNM strata. SHAP analysis highlights contributions from various biomarker categories.
Significance. If the reported performance generalizes, this work could provide a valuable complement to TNM staging by incorporating imaging-derived semantics and routine labs into a unified risk score for better stratification within anatomic stages. The multimodal fusion approach and use of SHAP for identifying contributors from hematologic, inflammatory, and other categories are positive elements that address a clinically relevant problem of outcome heterogeneity.
major comments (3)
- [Abstract] Abstract: The central performance claims rest on C-index values of 0.920 (training) and 0.849 (testing) from a single random split of a retrospective cohort after excluding 555 of 1129 screened patients for short follow-up or missing reports. No k-fold CV, repeated splits, center-stratified hold-out, or external validation is described, which is load-bearing for the generalizability claim and leaves the results vulnerable to selection bias and overfitting in the complex pipeline (MC-BERT adaptation, imputation, RSF, weighted fusion).
- [Abstract] Abstract: No ablation results, baseline comparisons to TNM staging alone or to unimodal models, or calibration plots are supplied. This undermines assessment of the incremental contribution of the radiology-report semantics and the reliability of the AMRS predictions across the reported subgroups and TNM strata.
- [Abstract] Abstract: The final AMRS is generated by weighted risk fusion whose weights are fitted on the training distribution; while test-set performance is reported separately, the abstract provides no indication that fusion parameters were fixed prior to test evaluation or that the model avoids circularity in the 0.849 C-index.
minor comments (1)
- [Abstract] Abstract: The screening date range ending in February 2026 appears inconsistent with a retrospective study and may require clarification or correction.
Simulated Author's Rebuttal
We thank the referee for their constructive comments on our manuscript. We address each major comment point by point below and indicate the revisions to be incorporated.
read point-by-point responses
-
Referee: [Abstract] Abstract: The central performance claims rest on C-index values of 0.920 (training) and 0.849 (testing) from a single random split of a retrospective cohort after excluding 555 of 1129 screened patients for short follow-up or missing reports. No k-fold CV, repeated splits, center-stratified hold-out, or external validation is described, which is load-bearing for the generalizability claim and leaves the results vulnerable to selection bias and overfitting in the complex pipeline (MC-BERT adaptation, imputation, RSF, weighted fusion).
Authors: We acknowledge that the reported results rely on a single random train-test split. This was selected given the retrospective design and post-exclusion sample size. To address the concern, we will add k-fold cross-validation within the training cohort and report the resulting C-indices in the revised manuscript. Center-stratified hold-out was not performed as the split was random; external validation is noted as required future work in the abstract. revision: yes
-
Referee: [Abstract] Abstract: No ablation results, baseline comparisons to TNM staging alone or to unimodal models, or calibration plots are supplied. This undermines assessment of the incremental contribution of the radiology-report semantics and the reliability of the AMRS predictions across the reported subgroups and TNM strata.
Authors: We agree these elements are needed to demonstrate incremental value. The revised manuscript will include ablation experiments, comparisons against TNM staging alone and the two unimodal models (radiology-report semantics and laboratory biomarkers), and calibration plots to assess prediction reliability across subgroups and TNM strata. revision: yes
-
Referee: [Abstract] Abstract: The final AMRS is generated by weighted risk fusion whose weights are fitted on the training distribution; while test-set performance is reported separately, the abstract provides no indication that fusion parameters were fixed prior to test evaluation or that the model avoids circularity in the 0.849 C-index.
Authors: The weighted fusion parameters were fitted exclusively on the training set and held fixed for the independent test set, ensuring no circularity. We will revise the abstract and methods section to state this explicitly and remove any ambiguity. revision: yes
Circularity Check
No significant circularity in derivation chain
full rationale
The paper describes a standard ML pipeline: MC-BERT encoding of reports, Mahalanobis imputation, random survival forests, and weighted fusion, all fit on the training split (n=459) with C-index reported separately on the held-out test split (n=115). No equations or steps reduce the reported test performance or AMRS construction to the inputs by definition. No self-citations are invoked as load-bearing uniqueness theorems. The train C-index is transparently labeled as training performance rather than presented as an independent prediction. The derivation remains self-contained against the external test cohort benchmark.
Axiom & Free-Parameter Ledger
free parameters (2)
- fusion weights
- MC-BERT domain-adaptation parameters
axioms (2)
- domain assumption Radiology reports contain extractable semantic features that are prognostic for survival beyond TNM stage.
- domain assumption Laboratory biomarkers supply independent prognostic signal after Mahalanobis imputation.
Reference graph
Works this paper leans on
-
[1]
Global cancer statistics 2022: GLOBOCAN estimates of incidence and mortality worldwide for 36 cancers in 185 countries
Bray F, Laversanne M, Sung H, et al. Global cancer statistics 2022: GLOBOCAN estimates of incidence and mortality worldwide for 36 cancers in 185 countries. CA Cancer J Clin. 2024;74:229-
2022
-
[2]
doi:10.3322/caac.21834
-
[3]
The biology and management of non-small cell lung cancer
Herbst RS, Morgensztern D, Boshoff C. The biology and management of non-small cell lung cancer. Nature. 2018;553:446-454. doi:10.1038/nature25183
-
[4]
Rami-Porta R, Nishimura KK, Giroux DJ, et al. The International Association for the Study of Lung Cancer Lung Cancer Staging Project: proposals for revision of the TNM stage groups in the forthcoming ninth edition of the TNM classification for lung cancer. J Thorac Oncol. 2024;19:1007-
2024
-
[5]
doi:10.1016/j.jtho.2024.02.011
-
[6]
The proposed ninth edition TNM classification of lung cancer
Detterbeck FC, Woodard GA, Bader AS, et al. The proposed ninth edition TNM classification of lung cancer. Chest. 2024;166:882-895. doi:10.1016/j.chest.2024.05.026
-
[7]
Proposed ninth edition TNM staging system for lung cancer: guide for radiologists
Klug M, Kirshenboim Z, Truong MT, et al. Proposed ninth edition TNM staging system for lung cancer: guide for radiologists. Radiographics. 2024;44:e240057. doi:10.1148/rg.240057
-
[8]
Cancer-related inflammation
Mantovani A, Allavena P, Sica A, Balkwill F. Cancer-related inflammation. Nature. 2008;454:436-
2008
-
[9]
doi:10.1038/nature07205
-
[10]
Artificial intelligence for multimodal data integration in oncology
Lipkova J, Chen RJ, Chen B, et al. Artificial intelligence for multimodal data integration in oncology. Cancer Cell. 2022;40:1095-1110. doi:10.1016/j.ccell.2022.09.012
-
[11]
Maron, Mohamed Ahmed, Susie Kim, Mono Pirun, Walid K
Jee J, Fong C, Pichotta K, et al. Automated real-world data integration improves cancer outcome prediction. Nature. 2024;636:728-736. doi:10.1038/s41586-024-08167-5
-
[12]
Collins GS, Moons KGM, Dhiman P, et al. TRIPOD+AI statement: updated guidance for reporting clinical prediction models that use regression or machine learning methods. BMJ. 2024;385:e078378. doi:10.1136/bmj-2023-078378
-
[13]
Park HJ, Park N, Lee JH, et al. Automated extraction of information of lung cancer staging from unstructured reports of PET-CT interpretation: natural language processing with deep-learning. BMC Med Inform Decis Mak. 2022;22:229. doi:10.1186/s12911-022-01975-7
-
[14]
Ishwaran H, Kogalur UB, Blackstone EH, Lauer MS. Random survival forests. Ann Appl Stat. 2008;2:841-860. doi:10.1214/08-AOAS169
-
[15]
Regression models and life-tables
Cox DR. Regression models and life-tables. J R Stat Soc Series B Stat Methodol. 1972;34:187-220
1972
-
[16]
Katzman, Uri Shaham, Alexander Cloninger, Jonathan Bates, Tingting Jiang, and Yuval Kluger
Katzman JL, Shaham U, Cloninger A, et al. DeepSurv: personalized treatment recommender system using a Cox proportional hazards deep neural network. BMC Med Res Methodol. 2018;18:24. doi:10.1186/s12874-018-0482-1
-
[17]
In: Proceedings of the AAAI Conference on Artificial Intelligence
Lee C, Zame W, Yoon J, van der Schaar M. DeepHit: a deep learning approach to survival analysis with competing risks. Proc AAAI Conf Artif Intell. 2018;32. doi:10.1609/aaai.v32i1.11842
-
[18]
BERT: pre-training of deep bidirectional transformers for language understanding
Devlin J, Chang MW, Lee K, Toutanova K. BERT: pre-training of deep bidirectional transformers for language understanding. Proc NAACL-HLT. 2019:4171-4186
2019
-
[19]
Lee J, Yoon W, Kim S, et al. BioBERT: a pre-trained biomedical language representation model for biomedical text mining. Bioinformatics. 2020;36:1234-1240. doi:10.1093/bioinformatics/btz682
-
[20]
Publicly Available Clinical BERT Embeddings
Alsentzer E, Murphy J, Boag W, et al. Publicly available clinical BERT embeddings. Proc 2nd Clinical Natural Language Processing Workshop. 2019:72-78. doi:10.18653/v1/W19-1909
-
[21]
A unified approach to interpreting model predictions
Lundberg SM, Lee SI. A unified approach to interpreting model predictions. Adv Neural Inf Process Syst. 2017;30:4765-4774
2017
-
[22]
Zhang Y, Chen Y, Guo C, Li S, Huang C. Systemic immune-inflammation index as a predictor of survival in non-small cell lung cancer patients undergoing immune checkpoint inhibition: a systematic review and meta-analysis. Crit Rev Oncol Hematol. 2025;210:104669. doi:10.1016/j.critrevonc.2025.104669
-
[23]
Wang L, Long X, Zhu Y, et al. Association of prognostic nutritional index with long-term survival in lung cancer receiving immune checkpoint inhibitors: a meta-analysis. Medicine (Baltimore). 2024;103:e41087. doi:10.1097/MD.0000000000041087
-
[24]
Ma M, Cao R, Wang W, et al. The D-dimer level predicts the prognosis in patients with lung cancer: a systematic review and meta-analysis. J Cardiothorac Surg. 2021;16:243. doi:10.1186/s13019-021- 01618-4
-
[25]
Zhang Z, Li Y, Yan X, Song Q, Wang G, Hu Y. Pretreatment lactate dehydrogenase may predict outcome of advanced non-small-cell lung cancer patients treated with immune checkpoint inhibitors: a meta-analysis. Cancer Med. 2019;8:1467-1473. doi:10.1002/cam4.2024
-
[26]
Zhang Y, Chen B, Wang L, Wang R, Yang X. Systemic immune-inflammation index is a promising noninvasive marker to predict survival of lung cancer: a meta-analysis. Medicine (Baltimore). 2019;98:e13788. doi:10.1097/MD.0000000000013788
-
[27]
Yang Y, Li J, Wang Y, et al. Prognostic value of the systemic immune-inflammation index in lung cancer patients receiving immune checkpoint inhibitors: a meta-analysis. PLoS One. 2024;19:e0312605. doi:10.1371/journal.pone.0312605
-
[28]
ESPEN guidelines on nutrition in cancer patients
Arends J, Bachmann P, Baracos V, et al. ESPEN guidelines on nutrition in cancer patients. Clin Nutr. 2017;36:11-48. doi:10.1016/j.clnu.2016.07.015
-
[29]
Deng T, Zhang J, Meng Y, et al. Higher pretreatment lactate dehydrogenase concentration predicts worse overall survival in patients with lung cancer. Medicine (Baltimore). 2018;97:e12524. doi:10.1097/MD.0000000000012524
-
[30]
Collins GS, Reitsma JB, Altman DG, Moons KGM. Transparent Reporting of a multivariable prediction model for Individual Prognosis or Diagnosis (TRIPOD): the TRIPOD statement. Ann Intern Med. 2015;162:55-63. doi:10.7326/M14-0697
-
[31]
Wolff RF, Moons KGM, Riley RD, et al. PROBAST: a tool to assess the risk of bias and applicability of prediction model studies. Ann Intern Med. 2019;170:51-58. doi:10.7326/M18-1376
-
[32]
Decision curve analysis: a novel method for evaluating prediction models
Vickers AJ, Elkin EB. Decision curve analysis: a novel method for evaluating prediction models. Med Decis Making. 2006;26:565-574. doi:10.1177/0272989X06295361
-
[33]
Time-dependent ROC curves for censored survival data and a diagnostic marker
Heagerty PJ, Lumley T, Pepe MS. Time-dependent ROC curves for censored survival data and a diagnostic marker. Biometrics. 2000;56:337-344. doi:10.1111/j.0006-341X.2000.00337.x
-
[34]
Cho H, Yoo S, Kim B, et al. Extracting lung cancer staging descriptors from pathology reports: a generative language model approach. J Biomed Inform. 2024;157:104720. doi:10.1016/j.jbi.2024.104720
-
[35]
Barlow SH, Chicklore S, He Y, et al. Uncertainty-aware automatic TNM staging classification for [18F]FDG PET-CT reports for lung cancer utilising transformer-based language models and multi- task learning. BMC Med Inform Decis Mak. 2024;24:396. doi:10.1186/s12911-024-02814-7
-
[36]
Decoding tumour phenotype by noninvasive imaging using a quantitative radiomics approach
Aerts HJWL, Velazquez ER, Leijenaar RTH, et al. Decoding tumour phenotype by noninvasive imaging using a quantitative radiomics approach. Nat Commun. 2014;5:4006. doi:10.1038/ncomms5006
-
[37]
Calibration: the Achilles heel of predictive analytics
Van Calster B, McLernon DJ, van Smeden M, et al. Calibration: the Achilles heel of predictive analytics. BMC Med. 2019;17:230. doi:10.1186/s12916-019-1466-7
discussion (0)
Sign in with ORCID, Apple, or X to comment. Anyone can read and Pith papers without signing in.