Automatic detection of Flare Ribbon Fine Structures as Proxies for Plasmoid Dynamics in Flare Reconnection
Pith reviewed 2026-06-27 05:48 UTC · model grok-4.3
The pith
An automated method tracks spiral imprints on flare ribbons that match expected plasmoid dynamics in a 3D simulation.
A machine-rendered reading of the paper's core claim, the machinery that carries it, and where it could break.
Core claim
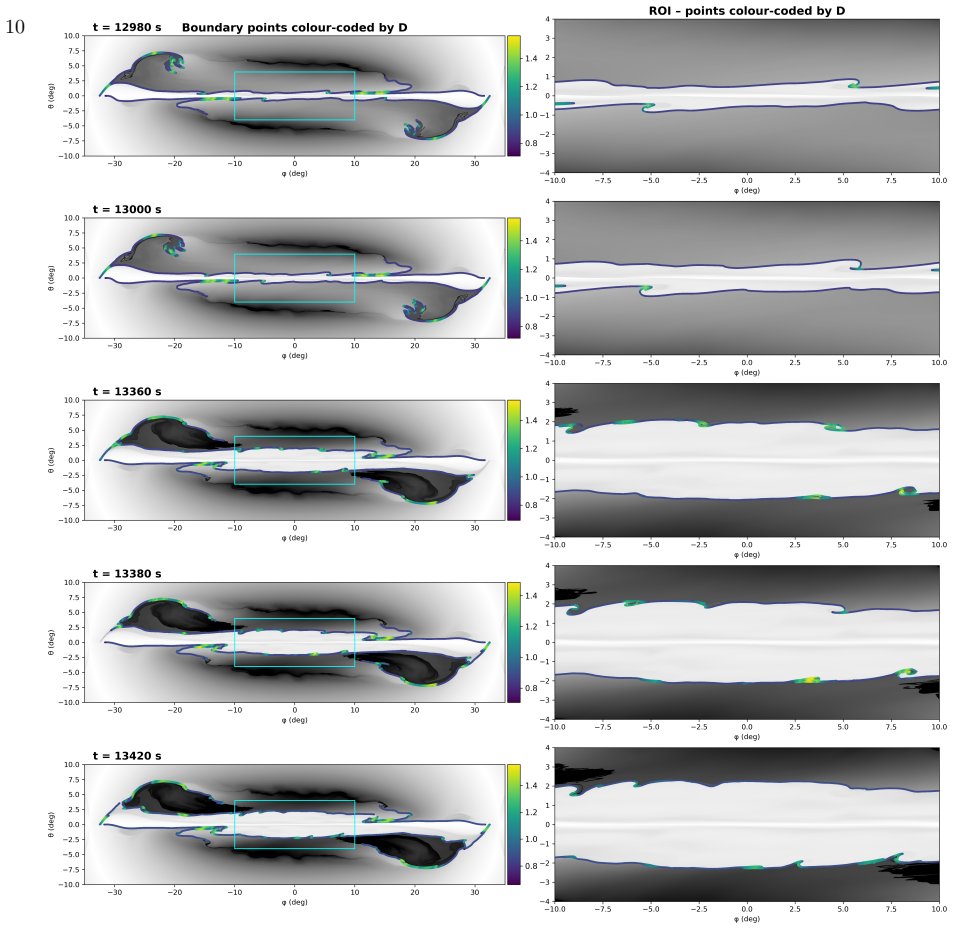
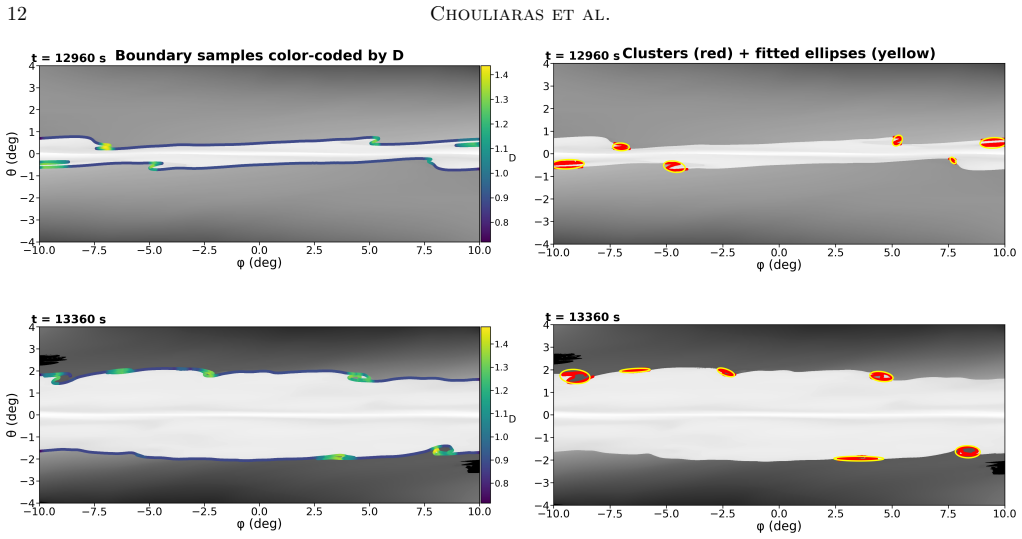
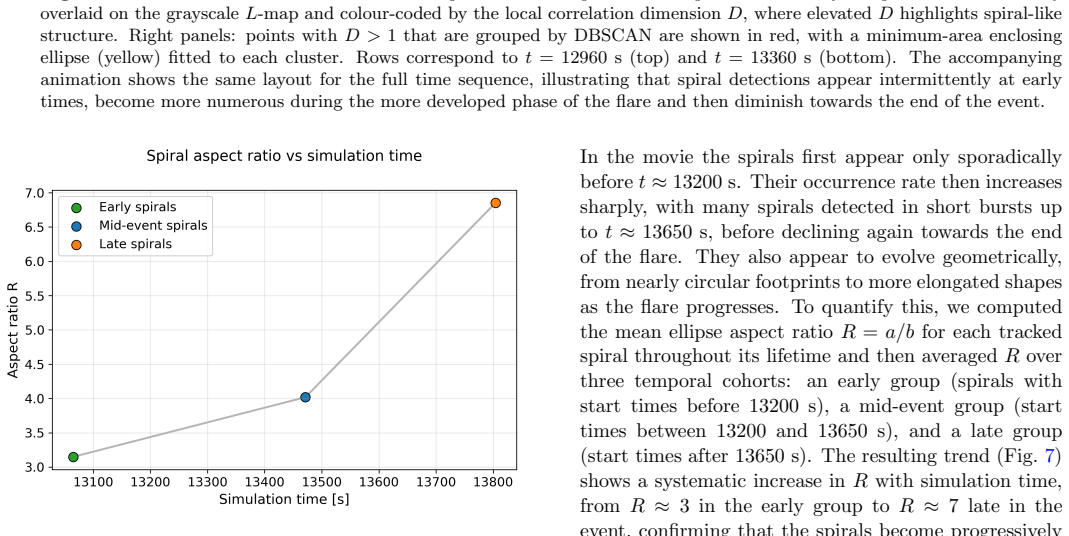
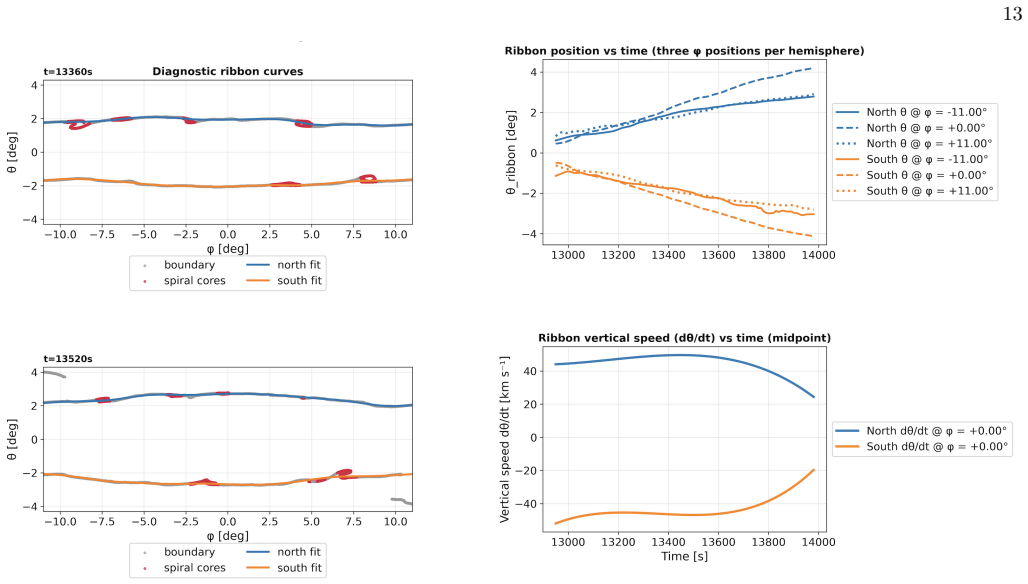
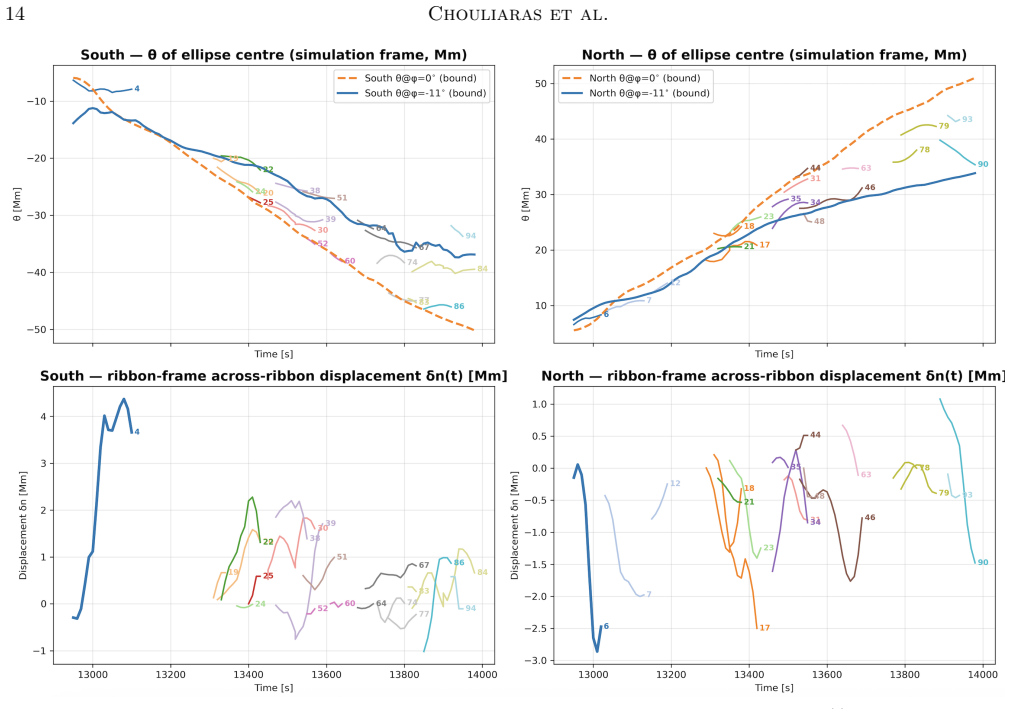
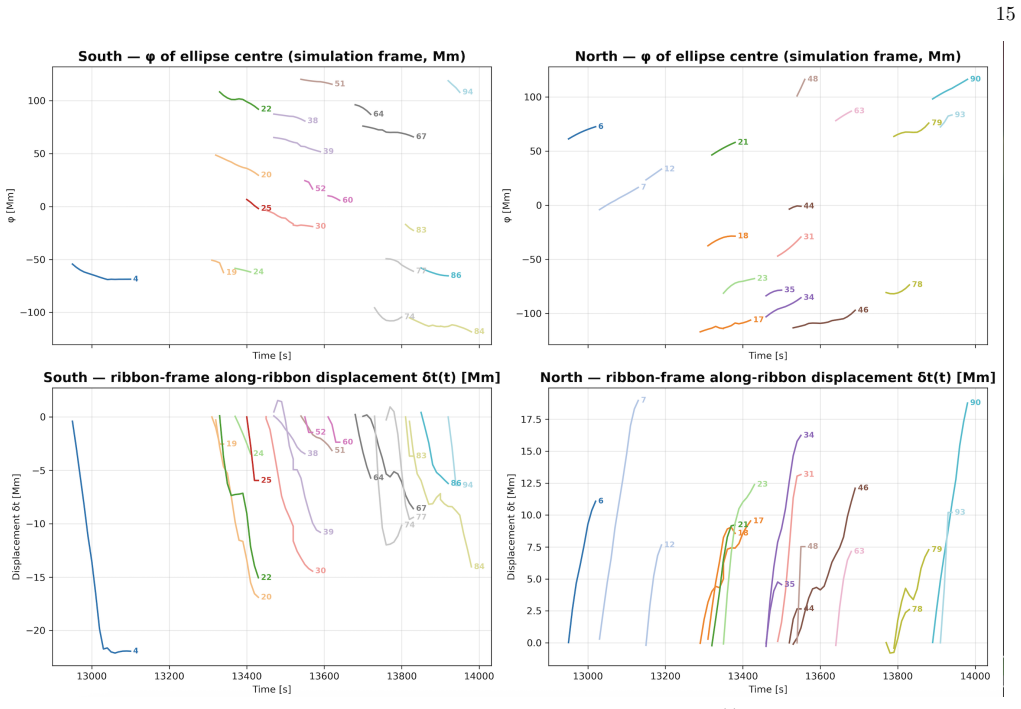
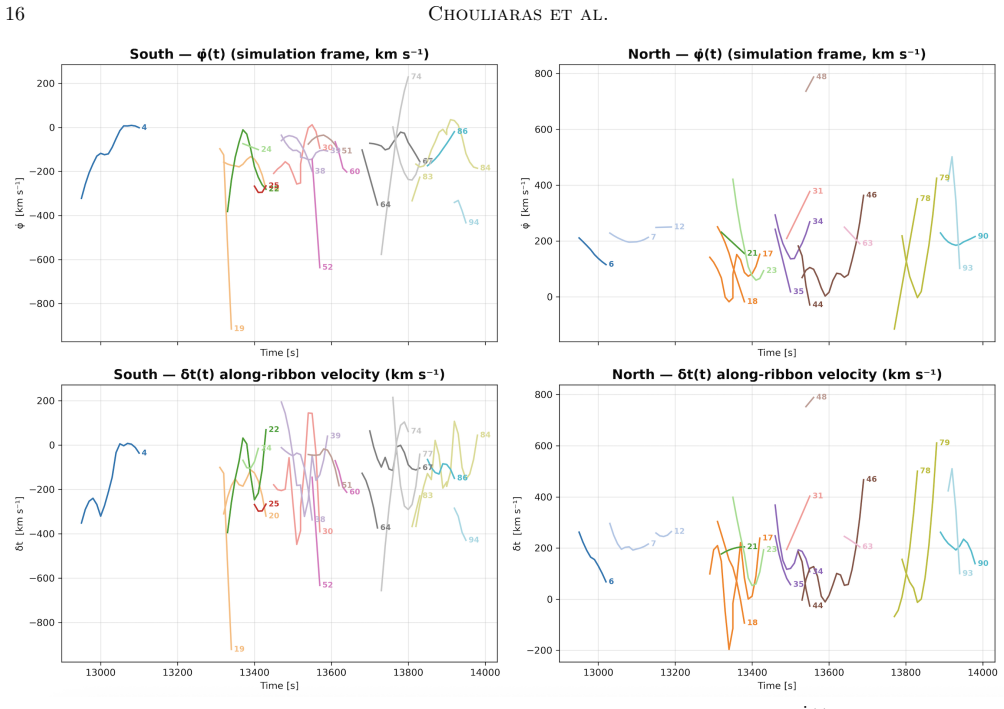
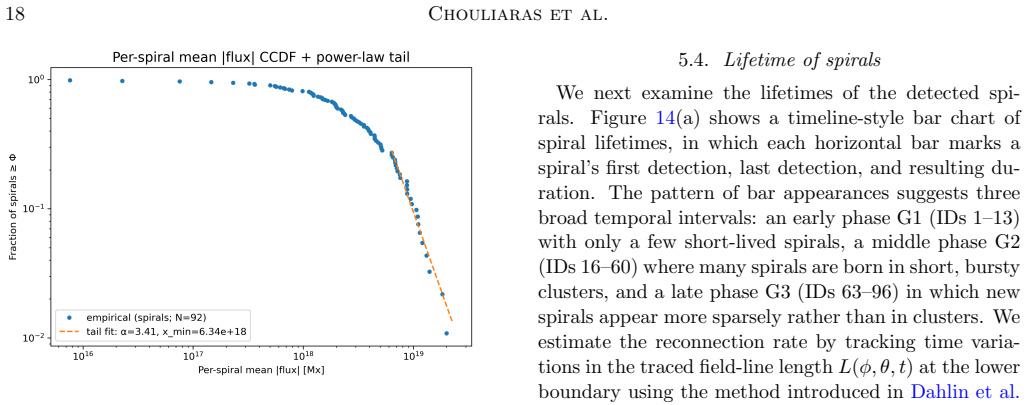
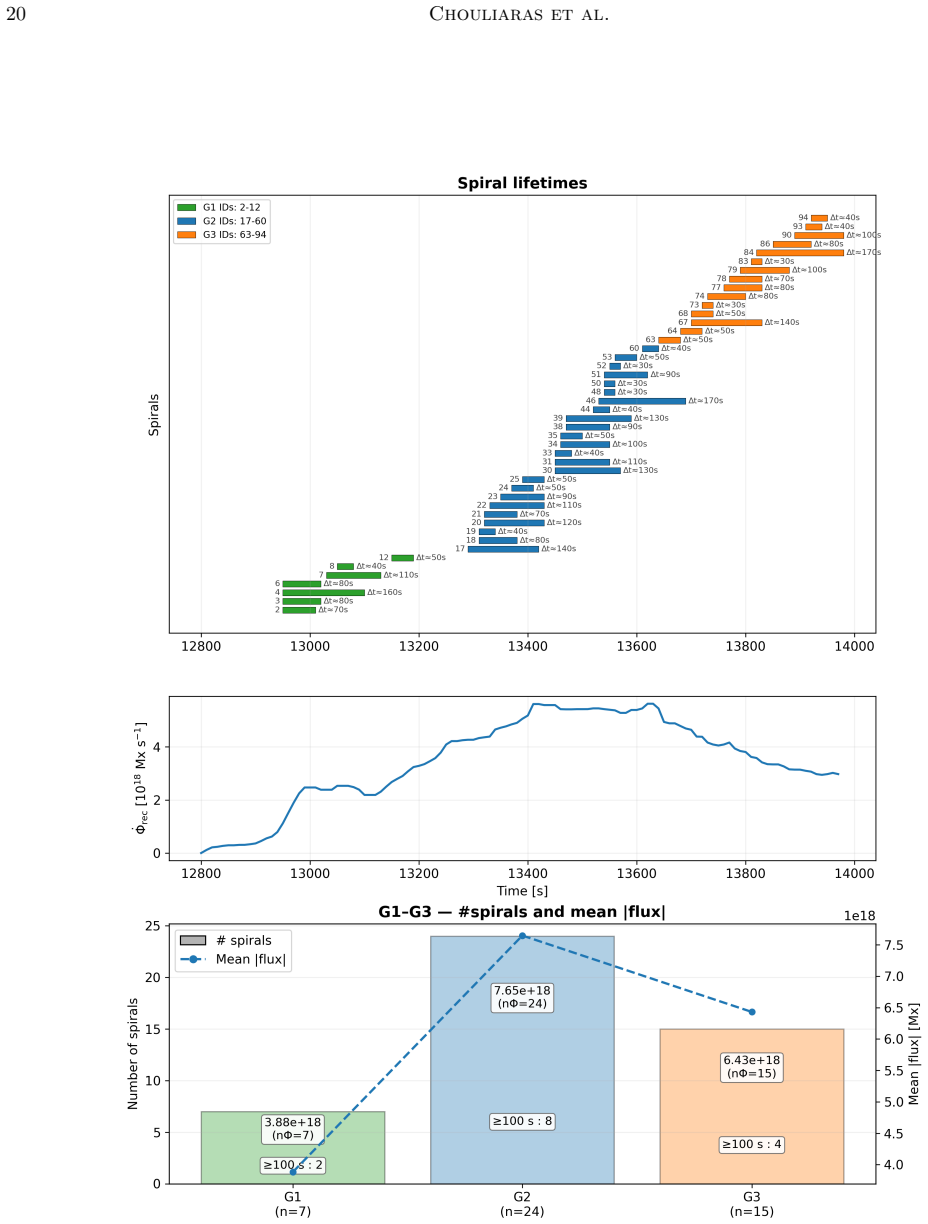
The workflow applies the correlation-dimension method, density-based clustering, and a minimum-area ellipse fit to identify and summarise each spiral or wave-like imprint. Across the simulated flare the detected spirals remain locked to the ribbon's outward motion while drifting coherently along the ribbon. The two ribbons exhibit opposite along-ribbon drifts away from their hooks, with instantaneous speeds between 10 and 800 km/s. Occurrence, lifetimes and mean magnetic flux of the features peak during the impulsive phase, and the per-feature mean unsigned flux distribution shows a scale-free tail above roughly 6 times 10 to the 18 Mx with a power-law exponent near 3.4.
What carries the argument
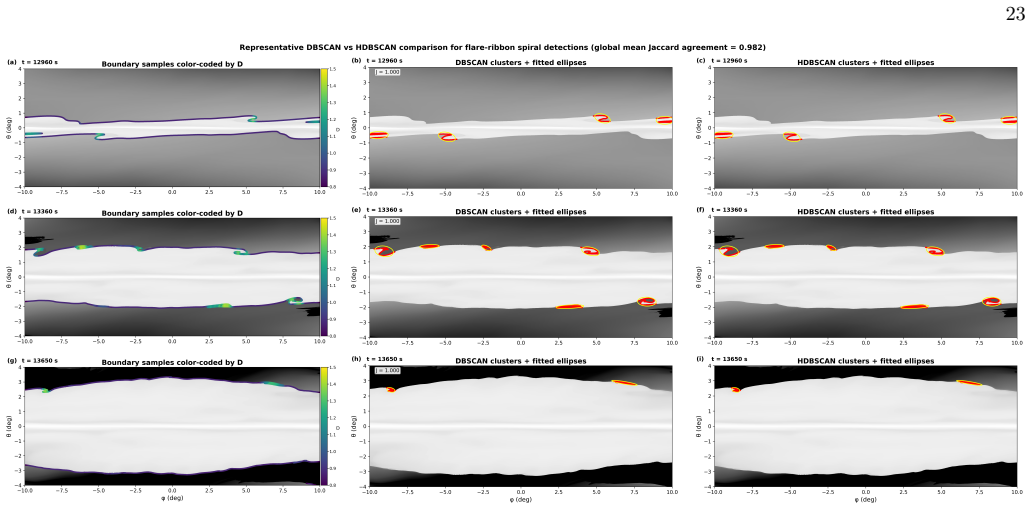
Correlation-dimension method combined with density-based clustering and minimum-area ellipse fitting applied to magnetic field-line length maps to identify and track ribbon fine structures.
If this is right
- Detected features stay locked to the ribbon's outward motion throughout the flare.
- Along-ribbon drifts occur in opposite directions on the two ribbons and remain below the surface Alfvén speed.
- Feature occurrence, lifetimes, and mean fluxes all maximise during the impulsive phase.
- The unsigned-flux distribution per feature follows a power law with index near 3.4 above 6 times 10 to the 18 Mx.
- Bursty plasmoid-mediated reconnection therefore leaves a clear, measurable surface signature on the ribbons.
Where Pith is reading between the lines
- The same detection pipeline could be run on observed ribbon images from ground- or space-based telescopes to test whether real flares show the same drift and flux statistics.
- If the proxy relation holds, the method supplies a practical way to infer the three-dimensional structure of reconnection from two-dimensional ribbon data.
- The reported power-law index offers a quantitative target that future higher-resolution simulations or multi-wavelength observations can use to constrain plasmoid statistics.
Load-bearing premise
The spiral- and wave-like patterns found in the field-line length maps are faithful proxies for the formation and motion of plasmoids inside the flare current sheet.
What would settle it
A side-by-side comparison in the same simulation between the detected ribbon features and direct measurements of plasmoid locations, sizes, and velocities inside the current sheet that shows no statistical correspondence in drift speeds or flux distribution.
Figures
read the original abstract
Flare ribbons often display fine structures along their fronts that are commonly interpreted as signatures of intermittent reconnection dynamics including plasmoid formation in the flare current sheet. We introduce an automated method that detects and tracks the spiral- and wave-like imprints of these structures and as a proof of concept apply it to maps of magnetic field-line length from a high-resolution 3D eruptive-flare simulation. The workflow applies the correlation-dimension method, density-based clustering, and a minimum-area ellipse fit to summarise each feature. We show that across the simulated flare, the detected spirals remain locked to the ribbon's outward motion while drifting coherently along the ribbon. The two ribbons show opposite along-ribbon drift and motion away from their hooks in accordance with theoretical expectations, with instantaneous speeds of 10-800 km s^1, all well below the local surface Alfven speed. Occurrence, lifetimes, and mean magnetic flux of the features peak during the impulsive phase. The distribution of per-spiral mean unsigned flux shows a scale-free tail above roughly 6x10^18 Mx with a power-law exponent near 3.4. Together, these results show that bursty, plasmoid-mediated flare reconnection leaves a clear, measurable signature on the flare ribbons. The method provides a practical surface diagnostic of ribbon fine structure that can potentially be used to inform our understanding of three-dimensional magnetic reconnection in the flare current sheet.
Editorial analysis
A structured set of objections, weighed in public.
Referee Report
Summary. The manuscript introduces an automated method using the correlation-dimension technique, DBSCAN clustering, and minimum-area ellipse fitting to detect and track spiral- and wave-like fine structures in maps of magnetic field-line length from a high-resolution 3D eruptive-flare simulation. As a proof of concept, it reports that the detected features remain locked to the ribbon's outward motion while drifting coherently along the ribbon (with opposite along-ribbon drifts for the two ribbons), instantaneous speeds of 10-800 km/s (below the local surface Alfvén speed), occurrence/lifetimes/flux peaking in the impulsive phase, and a scale-free tail in the per-spiral mean unsigned flux distribution above ~6×10^18 Mx with power-law exponent ~3.4. These are interpreted as measurable signatures of plasmoid-mediated reconnection in the flare current sheet.
Significance. If the proxy interpretation holds, the work supplies a practical, automated surface diagnostic for three-dimensional reconnection dynamics that could be applied to observations. The simulation demonstration yields concrete, quantitative results (drift directions matching theoretical expectations, specific speed range, power-law index ~3.4) and applies the workflow reproducibly to independent simulation output without reducing quantities to fitted parameters by construction. The significance remains moderate because the central mapping from surface imprints to volume plasmoid properties is untested.
major comments (2)
- [Abstract] Abstract and the section describing the proof-of-concept application: the claim that the detected spiral- and wave-like imprints are reliable proxies for plasmoid formation and dynamics in the flare current sheet is not supported by any direct comparison to independent volume diagnostics such as magnetic islands, O-points, or localized current-density enhancements within the 3D current sheet. The workflow is demonstrated only on surface-derived field-line length maps from a single simulation.
- [Results] The results section reporting speeds, lifetimes, and the flux distribution: no error analysis, sensitivity tests on DBSCAN or correlation-dimension parameters, or validation metrics are provided for the detected features, leaving the reported power-law exponent near 3.4 and the 6×10^18 Mx threshold without quantified uncertainties.
minor comments (2)
- [Abstract] The abstract writes speeds as '10-800 km s^1'; this should be corrected to the standard notation '10-800 km s^{-1}'.
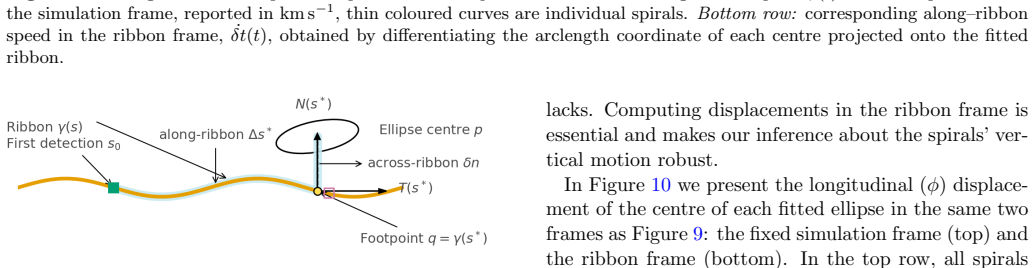
- The description of the ellipse-fitting step would benefit from explicit criteria for the minimum-area choice and an example figure overlaying fitted ellipses on a field-line length map.
Simulated Author's Rebuttal
We thank the referee for their detailed and constructive feedback on our manuscript. Below we provide point-by-point responses to the major comments. We will make revisions to address the concerns regarding validation and uncertainty quantification where feasible.
read point-by-point responses
-
Referee: [Abstract] Abstract and the section describing the proof-of-concept application: the claim that the detected spiral- and wave-like imprints are reliable proxies for plasmoid formation and dynamics in the flare current sheet is not supported by any direct comparison to independent volume diagnostics such as magnetic islands, O-points, or localized current-density enhancements within the 3D current sheet. The workflow is demonstrated only on surface-derived field-line length maps from a single simulation.
Authors: The manuscript is explicitly framed as a proof-of-concept application to surface-derived maps from one simulation. The proxy interpretation is based on the observed properties aligning with multiple theoretical predictions for plasmoid-mediated reconnection, including opposite drifts on the two ribbons, locking to outward motion, speeds below the Alfvén speed, and peaking during the impulsive phase. We agree that direct comparison to volume quantities would strengthen the case but is outside the current scope. We will revise the abstract and discussion to clarify that the features are consistent with plasmoid dynamics rather than claiming they are definitively reliable proxies without volume validation. revision: partial
-
Referee: [Results] The results section reporting speeds, lifetimes, and the flux distribution: no error analysis, sensitivity tests on DBSCAN or correlation-dimension parameters, or validation metrics are provided for the detected features, leaving the reported power-law exponent near 3.4 and the 6×10^18 Mx threshold without quantified uncertainties.
Authors: We accept this criticism. The original submission did not include sensitivity analysis or error estimates. In the revised manuscript, we will add a new subsection detailing sensitivity tests to variations in the correlation-dimension threshold and DBSCAN parameters, showing the robustness of the detected features. We will also provide uncertainty estimates on the power-law exponent using fitting methods that account for uncertainties, and discuss the sensitivity of the 6×10^18 Mx threshold. revision: yes
Circularity Check
No significant circularity: empirical measurements from independent simulation data
full rationale
The paper applies an automated detection pipeline (correlation-dimension method, DBSCAN clustering, minimum-area ellipse fitting) to magnetic field-line length maps extracted from a pre-existing 3D eruptive-flare simulation. Reported quantities—along-ribbon drifts, locking to outward ribbon motion, instantaneous speeds (10-800 km s^{-1}), occurrence/lifetime peaks during the impulsive phase, and the power-law tail of per-feature mean unsigned flux (exponent ~3.4 above 6e18 Mx)—are direct statistical summaries of the detected features in the simulation output. No equation or workflow step defines a target quantity in terms of itself or renames a fitted parameter as a prediction. The interpretive claim that the detected spirals serve as proxies for plasmoid dynamics is presented as an assumption to be tested by the method, not as a mathematical identity derived from the inputs. No load-bearing self-citations or uniqueness theorems are invoked. The analysis chain is therefore self-contained against external simulation data.
Axiom & Free-Parameter Ledger
axioms (2)
- domain assumption The correlation-dimension method reliably identifies spiral- and wave-like structures in maps of magnetic field-line length.
- domain assumption Density-based clustering and minimum-area ellipse fitting can summarize the detected features without introducing significant bias.
Reference graph
Works this paper leans on
-
[1]
2004, The Astrophysical Journal, 611, 557, doi: 10.1086/422159
Asai, A., Yokoyama, T., Shimojo, M., et al. 2004, The Astrophysical Journal, 611, 557, doi: 10.1086/422159
-
[2]
2012, A&A, 543, A110, doi: 10.1051/0004-6361/201219311
Aulanier, G., Janvier, M., & Schmieder, B. 2012, A&A, 543, A110, doi: 10.1051/0004-6361/201219311
-
[3]
Battaglia, M., Fletcher, L., & Benz, A. O. 2009, Astronomy & Astrophysics, 498, 891, doi: 10.1051/0004-6361/200811196
-
[4]
Beg, R., Russell, A. J. B., & Hornig, G. 2022, ApJ, 940, 94, doi: 10.3847/1538-4357/ac8eb6
-
[5]
Benz, A. O. 2017, Living Reviews in Solar Physics, 14, 2, doi: 10.1007/s41116-017-0002-1
-
[6]
Canny, J. 1986, IEEE Transactions on Pattern Analysis and Machine Intelligence, PAMI-8, 679, doi: 10.1109/TPAMI.1986.4767851
-
[7]
1964, NASA Special Publication, 50, 451
Carmichael, H. 1964, NASA Special Publication, 50, 451
1964
-
[8]
Che, H., & Zank, G. P. 2020, ApJ, 889, 11, doi: 10.3847/1538-4357/ab5d3b
-
[9]
Chen, P. F., Deng, Y. Y., Fang, C., & Liu, Y. 2012, Chinese Science Bulletin, 57, 1392, doi: 10.1007/s11434-011-4829-9
-
[10]
Clauset, A., Shalizi, C. R., & Newman, M. E. J. 2009, SIAM Review, 51, 661, doi: 10.1137/070710111 Corchado Albelo, M. F., Kazachenko, M. D., French, R. J., et al. 2026, arXiv e-prints, arXiv:2602.20470. https://arxiv.org/abs/2602.20470 Corchado Albelo, M. F., Kazachenko, M. D., & Lynch, B. J. 2024, ApJ, 965, 16, doi: 10.3847/1538-4357/ad25f4
-
[12]
Dahlin, J. T., Antiochos, S. K., Qiu, J., & DeVore, C. R. 2022, The Astrophysical Journal, 932, 94, doi: 10.3847/1538-4357/ac6e3d
-
[13]
DeVore, C. R. 2025, ApJ, 993, 31, doi: 10.3847/1538-4357/ae03c5
-
[14]
Dahlin, J. T., DeVore, C. R., & Antiochos, S. K. 2022, ApJ, 941, 79, doi: 10.3847/1538-4357/ac9e5a Dud´ ık, J., Aulanier, G., L¨ orinˇ c´ ık, J., & Zemanov´ a, A. 2025, SoPh, 300, 139, doi: 10.1007/s11207-025-02549-2 Dud´ ık, J., Janvier, M., Aulanier, G., et al. 2014, The Astrophysical Journal, 784, 144, doi: 10.1088/0004-637X/784/2/144 Dud´ ık, J., Poli...
-
[15]
1996, in Proceedings of the Second International Conference on Knowledge Discovery and Data Mining (KDD-96) (Portland, OR, USA: AAAI Press), 226–231
Ester, M., Kriegel, H., Sander, J., & Xu, X. 1996, in Proceedings of the Second International Conference on Knowledge Discovery and Data Mining (KDD-96) (Portland, OR, USA: AAAI Press), 226–231
1996
-
[16]
Fletcher, L., & Hudson, H. S. 2008, The Astrophysical Journal, 675, 1645, doi: 10.1086/527044
-
[17]
Fletcher, L., Dennis, B. R., Hudson, H. S., et al. 2011, Space Science Reviews, 159, 19, doi: 10.1007/s11214-010-9701-8
-
[18]
1983, Physica D: Nonlinear Phenomena, 9, 189, doi: 10.1016/0167-2789(83)90298-1
Grassberger, P., & Procaccia, I. 1983, Physica D: Nonlinear Phenomena, 9, 189, doi: 10.1016/0167-2789(83)90298-1
-
[19]
Guidoni, S. E., & Longcope, D. W. 2011, The Astrophysical Journal, 730, 90, doi: 10.1088/0004-637X/730/2/90
-
[20]
2018, Solar Physics, 293, 86, doi: 10.1007/s11207-018-1253-1
Tschernitz, J., & P¨ otzi, W. 2018, Solar Physics, 293, 86, doi: 10.1007/s11207-018-1253-1
-
[21]
1974, SoPh, 34, 323, doi: 10.1007/BF00153671
Hirayama, T. 1974, SoPh, 34, 323, doi: 10.1007/BF00153671
-
[22]
Holman, G. D., Aschwanden, M. J., Aurass, H., et al. 2011, Space Science Reviews, 159, 107, doi: 10.1007/s11214-010-9680-9 25
-
[23]
Huang, Y.-M., & Bhattacharjee, A. 2012, Phys. Rev. Lett., 109, 265002, doi: 10.1103/PhysRevLett.109.265002
-
[24]
2016, ApJ, 818, 20, doi: 10.3847/0004-637X/818/1/20
Huang, Y.-M., & Bhattacharjee, A. 2016, ApJ, 818, 20, doi: 10.3847/0004-637X/818/1/20
-
[25]
2013, A&A, 555, A77, doi: 10.1051/0004-6361/201321164
Janvier, M., Aulanier, G., Pariat, E., & D´ emoulin, P. 2013, A&A, 555, A77, doi: 10.1051/0004-6361/201321164
-
[26]
2016, Scientific Reports, 6, 24319, doi: 10.1038/srep24319
Jing, J., Xu, Y., Cao, W., et al. 2016, Scientific Reports, 6, 24319, doi: 10.1038/srep24319
-
[27]
Karpen, J. T., Antiochos, S. K., & DeVore, C. R. 2012, ApJ, 760, 81, doi: 10.1088/0004-637X/760/1/81
-
[28]
Antiochos, S. K. 2024, ApJ, 966, 27, doi: 10.3847/1538-4357/ad2eaa
-
[29]
Kazachenko, M. D., Albelo-Corchado, M. F., Tamburri, C. A., & Welsch, B. T. 2022, SoPh, 297, 59, doi: 10.1007/s11207-022-01987-6
-
[30]
Kazachenko, M. D., Lynch, B. J., Welsch, B. T., & Sun, X. 2017, The Astrophysical Journal, 845, 49, doi: 10.3847/1538-4357/aa7ed6
-
[31]
Kopp, R. A., & Pneuman, G. W. 1976, SoPh, 50, 85, doi: 10.1007/BF00206193
-
[32]
Kumar, P., Karpen, J. T., Antiochos, S. K., et al. 2021, ApJ, 907, 41, doi: 10.3847/1538-4357/abca8b
-
[33]
2015, The Astrophysical Journal Letters, 804, L8, doi: 10.1088/2041-8205/804/1/L8
Li, T., & Zhang, J. 2015, The Astrophysical Journal Letters, 804, L8, doi: 10.1088/2041-8205/804/1/L8
-
[34]
2018, Physics of Plasmas, 25, 012114, doi: 10.1063/1.5020887
Lingam, M., & Comisso, L. 2018, Physics of Plasmas, 25, 012114, doi: 10.1063/1.5020887
-
[35]
Liu, W., Chen, Q., & Petrosian, V. 2013, The Astrophysical Journal, 767, 168, doi: 10.1088/0004-637X/767/2/168 L¨ orinˇ c´ ık, J., Dud´ ık, J., Aulanier, G., et al. 2019, The Astrophysical Journal, 881, 68, doi: 10.3847/1538-4357/ab298f L¨ orinˇ c´ ık, J., Dud´ ık, J., Sainz Dalda, A., et al. 2025a, Nature Astronomy, 9, 45, doi: 10.1038/s41550-024-02396-4...
-
[36]
Loureiro, N. F., Schekochihin, A. A., & Cowley, S. C. 2007, Physics of Plasmas, 14, 100703, doi: 10.1063/1.2783986
-
[37]
Loureiro, N. F., & Uzdensky, D. A. 2012, Phys. Plasmas, 19, 042303, doi: 10.1063/1.3703318
-
[38]
Mason, E. I., & Uritsky, V. M. 2022, ApJL, 937, L19, doi: 10.3847/2041-8213/ac9124
-
[39]
McKenzie, D. E., & Hudson, H. S. 1999, The Astrophysical Journal Letters, 519, L93, doi: 10.1086/312110
-
[40]
Miklenic, C. H., Veronig, A. M., Vrˇ snak, B., & Hanslmeier, A. 2007, Astronomy & Astrophysics, 461, 697, doi: 10.1051/0004-6361:20065751
-
[41]
Milligan, R. O. 2011, The Astrophysical Journal, 740, 70, doi: 10.1088/0004-637X/740/2/70
-
[42]
Patel, R., Pant, V., Srivastava, A. K., et al. 2020, Astronomy & Astrophysics, doi: 10.1051/0004-6361/202039000
-
[43]
Priest, E. R., & D´ emoulin, P. 1995, J. Geophys. Res., 100, 23443, doi: 10.1029/95JA02740
-
[44]
Qiu, J., Wang, H., Cheng, C. Z., & Gary, D. E. 2004, The Astrophysical Journal, 604, 900, doi: 10.1086/382122
-
[45]
Resnick, S. I. 2007, Heavy-Tail Phenomena: Probabilistic and Statistical Modeling (New York: Springer), doi: 10.1007/978-0-387-75953-1
-
[46]
Rimmele, T. R., Warner, M., Keil, S. L., et al. 2020, SoPh, 295, 172, doi: 10.1007/s11207-020-01736-7
-
[47]
Savage, S. L., McKenzie, D. E., & Reeves, K. K. 2012, The Astrophysical Journal Letters, 747, L40, doi: 10.1088/2041-8205/747/2/L40
-
[48]
2001, Earth, Planets, and Space, 53, 473, doi: 10.1186/BF03353258
Shibata, K., & Tanuma, S. 2001, Earth, Planets, and Space, 53, 473, doi: 10.1186/BF03353258
-
[49]
2012, Solar Physics, 276, doi: 10.1007/s11207-011-9848-9
Song, H.-Q., Kong, X.-L., Chen, Y., et al. 2012, Solar Physics, 276, doi: 10.1007/s11207-011-9848-9
-
[50]
Sturrock, P. A. 1966, Nature, 211, 695, doi: 10.1038/211695a0
-
[51]
1985, Computer Vision, Graphics, and Image Processing, 30, 32, doi: 10.1016/0734-189X(85)90016-7
Suzuki, S., & Abe, K. 1985, Computer Vision, Graphics, and Image Processing, 30, 32, doi: 10.1016/0734-189X(85)90016-7
-
[52]
2016, The Astrophysical Journal, 828, 103, doi: 10.3847/0004-637X/828/2/103
Takasao, S., Asai, A., Isobe, H., & Shibata, K. 2016, The Astrophysical Journal, 828, 103, doi: 10.3847/0004-637X/828/2/103
-
[53]
Tamburri, C. A., Kazachenko, M. D., Cauzzi, G., et al. 2025, ApJL, 990, L3, doi: 10.3847/2041-8213/adf95e Thoen Faber, J., Joshi, R., Rouppe van der Voort, L., et al. 2025, A&A, 693, A8, doi: 10.1051/0004-6361/202452370
-
[54]
Uzdensky, D. A., Loureiro, N. F., & Schekochihin, A. A. 2010, Phys. Rev. Lett., 105, 235002, doi: 10.1103/PhysRevLett.105.235002
-
[55]
Vassilicos, J. C., & Hunt, J. C. R. 1991, Proceedings of the Royal Society of London Series A, 435, 505, doi: 10.1098/rspa.1991.0158
-
[56]
Warren, H. P., Brooks, D. H., Ugarte-Urra, I., et al. 2018, The Astrophysical Journal, 854, 122, doi: 10.3847/1538-4357/aaa9b8
-
[57]
Welzl, E. 1991, in LNCS, Vol. 555, New Results and New Trends in Computer Science (Springer), 359–370, doi: 10.1007/BFb0038202
-
[58]
Wyper, P. F., Antiochos, S. K., DeVore, C. R., et al. 2021, ApJ, 909, 54, doi: 10.3847/1538-4357/abd9ca
-
[59]
Wyper, P. F., & DeVore, C. R. 2016, ApJ, 820, 77, doi: 10.3847/0004-637X/820/1/77
-
[60]
Wyper, P. F., DeVore, C. R., Karpen, J. T., & Lynch, B. J. 2016, ApJ, 827, 4, doi: 10.3847/0004-637X/827/1/4 26Chouliaras et al
-
[61]
Wyper, P. F., Lynch, B. J., DeVore, C. R., et al. 2024, ApJ, 975, 168, doi: 10.3847/1538-4357/ad7941
-
[62]
Wyper, P. F., & Pontin, D. I. 2014, Physics of Plasmas, 21, 082114, doi: 10.1063/1.4893149 —. 2021, ApJ, 920, 102, doi: 10.3847/1538-4357/ac1943
-
[63]
Yadav, R., Kazachenko, M. D., Cauzzi, G., et al. 2025, ApJ, 989, 183, doi: 10.3847/1538-4357/adf4c1
-
[64]
2024, Reviews of Modern Plasma Physics, 8, 7, doi: 10.1007/s41614-024-00144-9
Zhang, Q. 2024, Reviews of Modern Plasma Physics, 8, 7, doi: 10.1007/s41614-024-00144-9
discussion (0)
Sign in with ORCID, Apple, or X to comment. Anyone can read and Pith papers without signing in.