The Edge-on Galaxies in the DESI survey (EGIDE): sample building and photometry
Pith reviewed 2026-06-27 03:21 UTC · model grok-4.3
The pith
A catalogue of 149215 edge-on galaxy candidates from DESI data shows the flattening ratio increases with stellar mass only for redder galaxies.
A machine-rendered reading of the paper's core claim, the machinery that carries it, and where it could break.
Core claim
The EGIDE project delivers a public catalogue of 149215 edge-on galaxy candidates with homogeneous griz photometry and stellar masses, and reports that galaxy thickness varies with colour while the flattening ratio q increases with total stellar mass M_star significantly only for redder cloud galaxies, a trend recovered both from statistical models of figures of revolution and from direct observations of the edge-on sample.
What carries the argument
The Zoobot neural model fine-tuned specifically to identify edge-on galaxies from Galaxy Zoo volunteer annotations, followed by manual supervision and SExtractor photometry in griz bands.
If this is right
- The number of redder galaxies falls with increasing a/b ratio faster than the number of bluer galaxies.
- Red sequence galaxies are thicker than blue cloud galaxies at fixed mass.
- The rise in flattening ratio q at the high-mass end is recovered independently by statistical figures-of-revolution models and by direct EGIDE measurements.
- The full validity of the q-M_star relation for red galaxies requires explicit removal of bulge and PSF contributions.
Where Pith is reading between the lines
- Larger samples like EGIDE could be cross-matched with HI or molecular gas surveys to test whether the mass-dependent thickness in red galaxies correlates with gas depletion.
- The colour split in thickness trends offers a possible observable for distinguishing merger-driven versus secular growth channels in simulations.
- Once bulge and PSF corrections are applied, the same catalogue could be used to calibrate thickness measurements for statistical studies of non-edge-on galaxies.
Load-bearing premise
The combination of the fine-tuned Zoobot model and subsequent manual supervision produces a sample whose measured a/b ratios are sufficiently free of contamination and selection bias to support the reported color and mass trends, prior to any correction for bulge light or PSF effects.
What would settle it
An independent visual classification or retraining of the model on the same images that yields no statistically significant difference in the q versus M_star slope between red and blue subsamples would falsify the reported mass-dependent trend.
Figures
read the original abstract
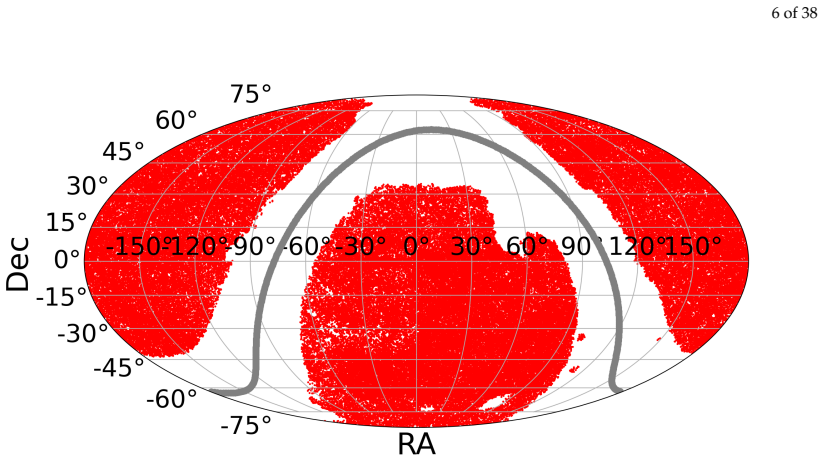
We present the EGIDE (The Edge-on Galaxies in the DESI survey) project - a catalogue of 149,215 edge-on galaxy candidates created using the data of the DESI Legacy Imaging Survey DR10 images. The catalogue size is ten times bigger than its predecessor and covers more than half of the sky. It is constructed in an automatic way utilizing the full power of manual annotations from the GalaxyZoo volunteers, implemented in the Zoobot neural model, which was fine-tuned to search for edge-on galaxies specifically. To ensure the credibility of the dataset, subsequent manual supervision was done. The EGIDE catalogue provides homogeneous SExtractor photometry in $griz$ bands, total stellar mass estimation, redshift values for 98% of the sample, star formation rates and other information. All of this is publicly available at The Edge-on Galaxy Database site. The preliminary analysis focused on differences between edge-on galaxies in the so-called blue sequence and red cloud populations. These galaxies demonstrate distinct properties: the number of redder galaxies drops with increasing $a/b$ ratio faster than for the bluer galaxies; galaxy thickness varies with galaxy colour: red sequence galaxies are thicker than blue cloud galaxies; the flattening ratio $q=b/a$ increases with total stellar mass $M_{\star}$ significantly only for redder cloud galaxies. It is an intriguing result, that the same trend of $q$ increasing for the high-mass end is detected from both the statistical models of figures of revolution and direct observations of edge-on galaxies in EGIDE independently. The full extent of the validity of this relationship can only be determined after correctly accounting for the contributions of the bulge and the PSF.
Editorial analysis
A structured set of objections, weighed in public.
Referee Report
Summary. The paper presents the EGIDE catalogue of 149215 edge-on galaxy candidates selected from DESI Legacy Imaging Survey DR10 using a fine-tuned Zoobot model trained on Galaxy Zoo annotations followed by manual supervision. It supplies homogeneous SExtractor photometry in griz, stellar masses, redshifts (for 98% of objects), star-formation rates and ancillary data, all released publicly. Preliminary analysis compares blue-cloud and red-sequence subsamples and reports that the number of red galaxies declines faster with increasing a/b, that red galaxies are thicker, and that the flattening ratio q = b/a rises with stellar mass M_star significantly only among redder galaxies; the same mass trend appears independently in statistical figures-of-revolution models.
Significance. A tenfold increase in sample size over prior edge-on catalogues, combined with uniform photometry and public release, would constitute a useful resource for statistical studies of disk structure if the selection and photometric measurements are shown to be sufficiently free of bias. The independent detection of the q-M_star trend in both direct observations and statistical models is a positive feature, but its robustness hinges on the unaddressed bulge/PSF corrections explicitly flagged in the abstract.
major comments (2)
- [Abstract] Abstract: the reported trend that q = b/a increases with M_star significantly only for redder galaxies is presented as a key result, yet the text states that 'the full extent of the validity of this relationship can only be determined after correctly accounting for the contributions of the bulge and the PSF.' Higher-mass red galaxies are expected to host larger bulges; an uncorrected central excess would systematically raise apparent b/a preferentially in the red sequence, directly threatening the claimed color-dependent mass trend.
- [Abstract / sample construction] Sample construction section (implied by abstract description): no quantitative purity, completeness, or contamination estimates are supplied for the Zoobot-selected sample after manual supervision. Because the central scientific claims rest on measured a/b ratios, the absence of these metrics leaves the weakest assumption (that the sample is free of selection bias and contamination sufficient to support the color and mass trends) untested.
minor comments (1)
- [Abstract] The abstract states that the catalogue 'covers more than half of the sky' but does not specify the exact sky area or footprint overlap with DESI; adding this would improve reproducibility.
Simulated Author's Rebuttal
We thank the referee for their constructive review and recommendations. We address the major comments point by point below, indicating planned revisions where appropriate.
read point-by-point responses
-
Referee: [Abstract] Abstract: the reported trend that q = b/a increases with M_star significantly only for redder galaxies is presented as a key result, yet the text states that 'the full extent of the validity of this relationship can only be determined after correctly accounting for the contributions of the bulge and the PSF.' Higher-mass red galaxies are expected to host larger bulges; an uncorrected central excess would systematically raise apparent b/a preferentially in the red sequence, directly threatening the claimed color-dependent mass trend.
Authors: We appreciate the referee highlighting this potential bias. The abstract already qualifies the result by noting that bulge and PSF corrections are required to determine the full validity of the q-M_star relationship. The same mass-dependent trend is independently recovered from statistical figures-of-revolution models, which are less sensitive to individual bulge contributions. We agree that a more explicit discussion of differential bulge effects between red and blue populations is needed. In revision we will expand the discussion section with a dedicated paragraph on this caveat and its possible impact on the color-dependent trend, while retaining the abstract qualification. revision: partial
-
Referee: [Abstract / sample construction] Sample construction section (implied by abstract description): no quantitative purity, completeness, or contamination estimates are supplied for the Zoobot-selected sample after manual supervision. Because the central scientific claims rest on measured a/b ratios, the absence of these metrics leaves the weakest assumption (that the sample is free of selection bias and contamination sufficient to support the color and mass trends) untested.
Authors: We acknowledge that the manuscript does not currently provide quantitative purity, completeness or contamination estimates after the manual supervision stage. The supervision was performed on a representative subset to vet the Zoobot output, but we agree that formal metrics would strengthen confidence in the reported trends. In the revised manuscript we will add a new subsection to the sample construction section that describes the supervision protocol and reports quantitative estimates (e.g., contamination fraction and completeness indicators) derived from the supervised subsample. revision: yes
Circularity Check
No circularity: trends derived from independent catalogue photometry and external models
full rationale
The paper constructs the EGIDE sample via Zoobot fine-tuning on Galaxy Zoo annotations plus manual checks, applies SExtractor photometry, estimates M_star, and reports observed q vs M_star trends split by color. The central claim states the same high-mass q increase appears independently in both the EGIDE direct measurements and separate statistical figures-of-revolution models. No equations, fitted parameters, or self-citations are shown that reduce any reported prediction to its own inputs by construction. The derivation chain remains observational and externally benchmarked.
Axiom & Free-Parameter Ledger
axioms (1)
- domain assumption The Zoobot neural model fine-tuned on GalaxyZoo annotations, followed by manual supervision, produces a reliable sample of edge-on galaxies suitable for statistical analysis of a/b ratios.
Reference graph
Works this paper leans on
-
[1]
Here in Figure 11, we present a similar analysis but for the (g−r) colour
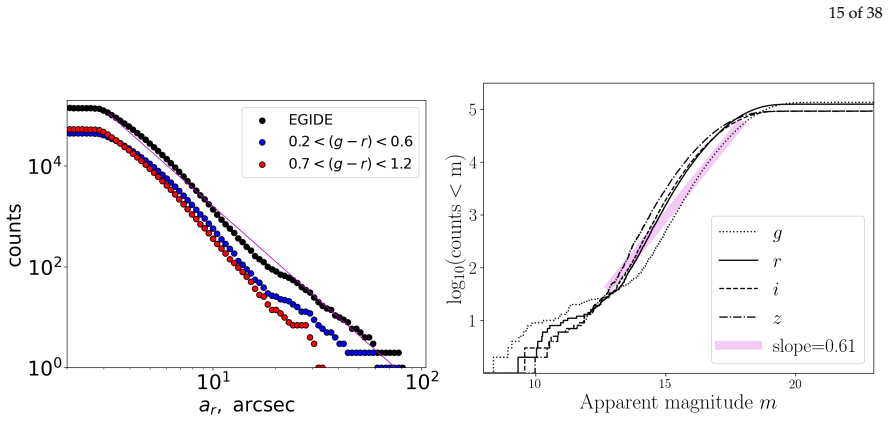
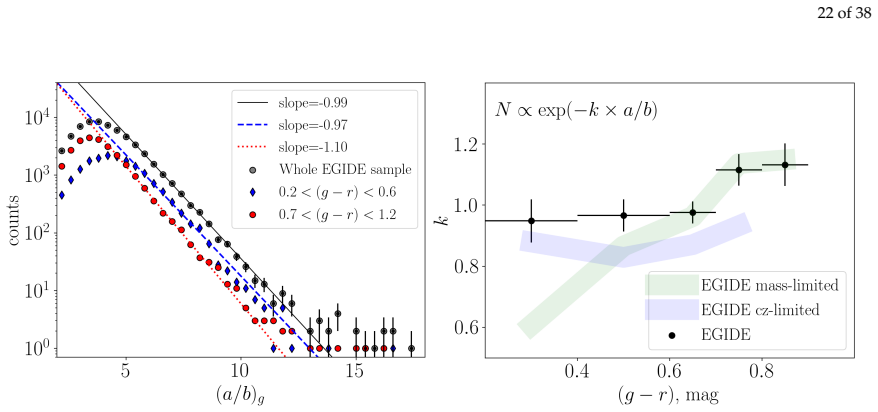
and also [145]). Here in Figure 11, we present a similar analysis but for the (g−r) colour. Motivated by the CMD distributions in Figure 8, we present fits for logN versus a/b in the g-band for blue and red galaxies with conditions 0.2 mag <(g−r)< 0.6 mag and 0.7 mag <(g−r)< 1.2 mag, respectively. We indeed see the same picture as before: the decline of r...
-
[2]
The catalogue is publicly available through the Edge-on Galaxy Database11
Conclusions We have presented the EGIDE (Edge-on Galaxies in the DESI Survey) catalogue, a new large-scale sample of 149,215 edge-on galaxy candidates selected from the DESI Legacy Imaging Surveys DR10. The catalogue is publicly available through the Edge-on Galaxy Database11. EGIDE is approximately ten times larger than its predecessor Edge-on Galaxies i...
-
[3]
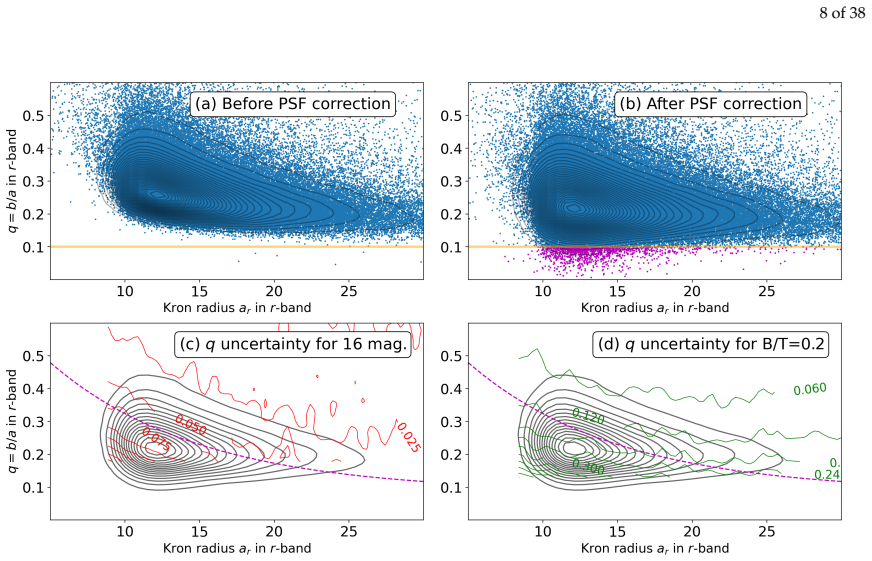
Measurements of the axis ratio q may suffer from PSF smearing, resolution, and bulge effects, especially for smaller galaxies
Galaxies in EGIDE have a median angular half-size of the major axis equal to 13.5 arcsec and are highly flattened objects with q=b/a≈ 0.24 (Figure 4, Table 1 and Figure A6). Measurements of the axis ratio q may suffer from PSF smearing, resolution, and bulge effects, especially for smaller galaxies. We correct for PSF smearing, impose a constraint on the ...
-
[4]
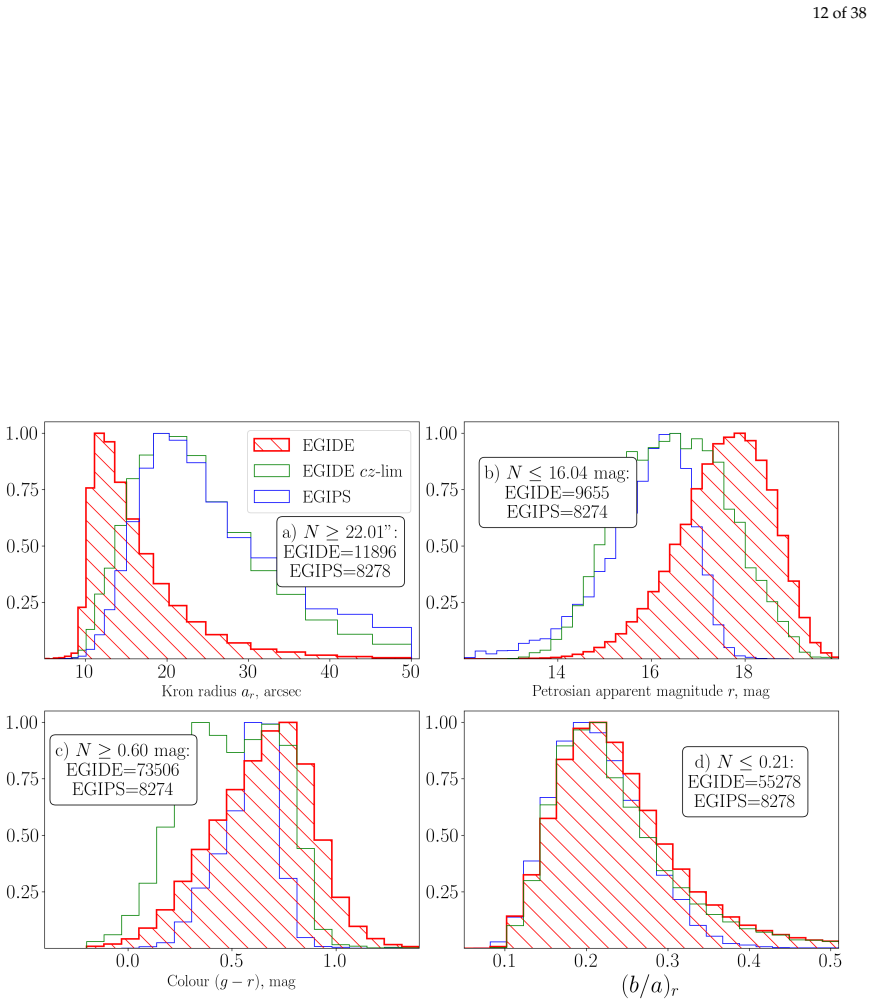
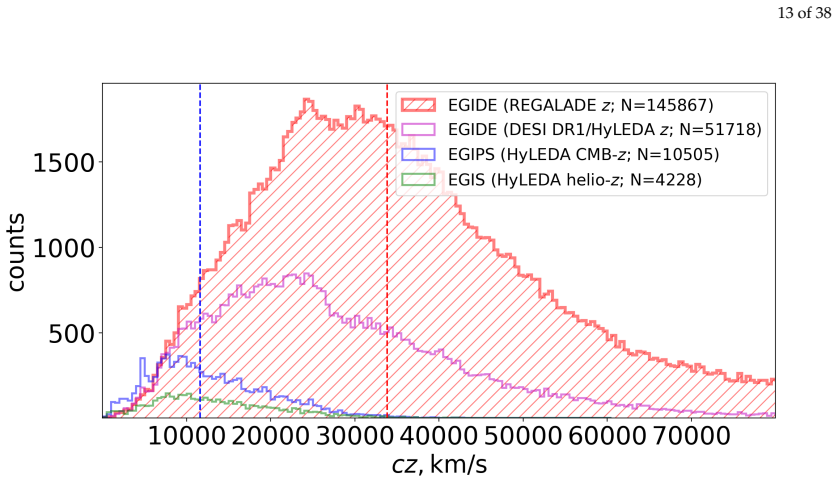
Due to methodological reasons the sample lacks very close and extended edge-on galaxies; thus previous surveys of edge-on galaxies such as RFGC, EGIS and EGIPS should be seen as complementary to the EGIDE dataset
-
[5]
The V/Vm test indicates that the sample is mostly complete for the 40% most luminous galaxies (V/Vm =0.4636±0.0012), with a depth limit ofm≈19 mag in ther-band (Figure 6)
-
[6]
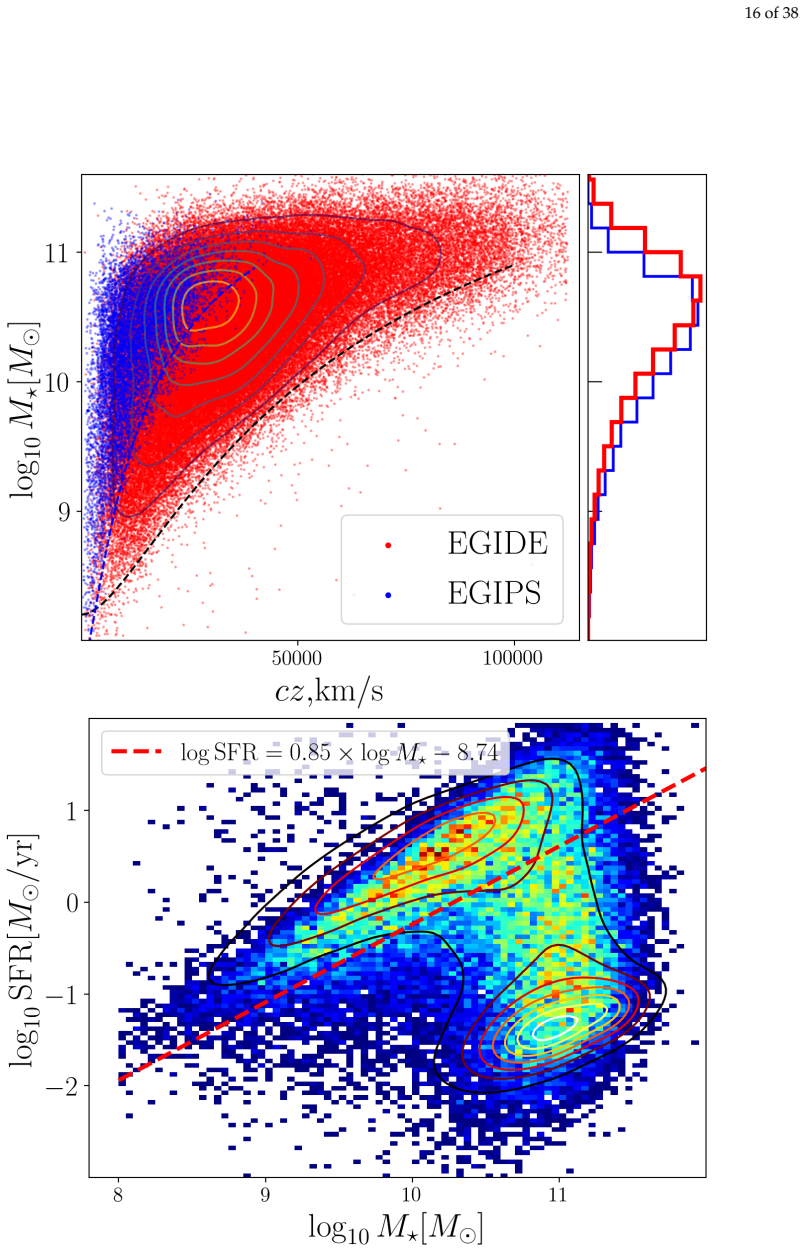
The median redshift of EGIDE is cz≈ 33, 750 km s −1 and is three times larger than that of EGIPS (see Figure 5). The galaxies are distributed up to a distance of 2000 Mpc and are slightly more massive than those from EGIPS (median value logM ⋆/M⊙ = 10.56 in EGIDE versus logM ⋆/M⊙ =10.34 in EGIPS, see Figure 7, left). 11 https://www.sao.ru/edgeon/catalogs....
2000
-
[7]
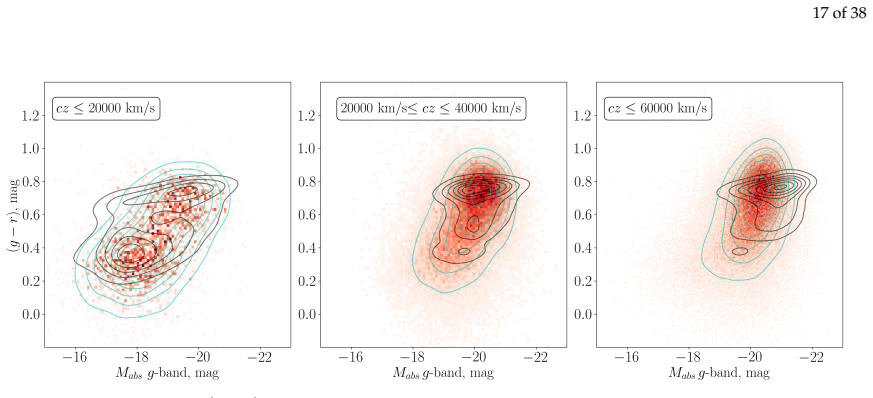
Edge-on galaxies in EGIDE populate both the red and blue sequences (see Figure 8 and Figure 7, right). Compared to the SDSS DR7 reference sample, EGIDE galaxies are shifted to fainter absolute magnitudes and exhibit a broader range of colours, which is potentially explained by the greater depth of the DESI Legacy images and by internal extinction. The ana...
-
[8]
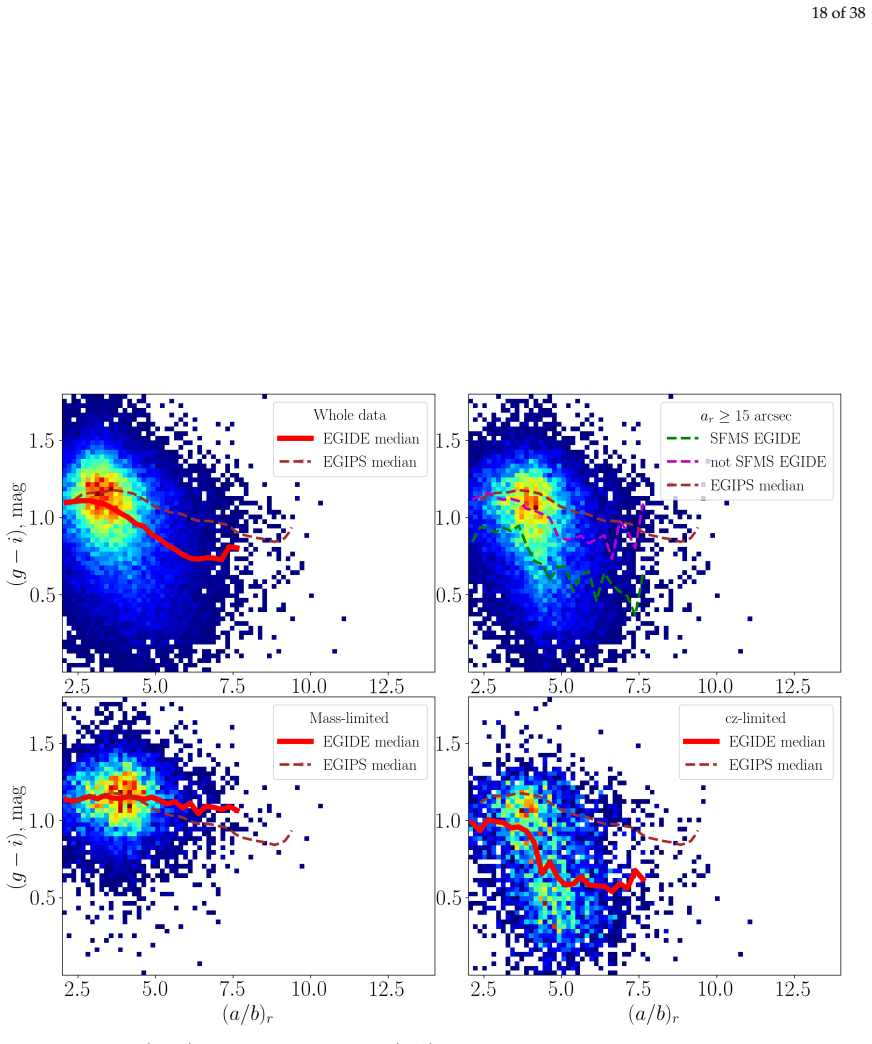
The colour–inverse flattening diagram confirms the previously found bimodality: a dense cloud of thicker (a/b∼ 3–5) and redder ((g−i)∼ 1.1–1.3 mag) galaxies is followed by a population of thinner (a/b> 5) galaxies that are bluer by 0.2–0.4 mag (Figure 9). This bimodality appears to be a fundamental property of disc galaxies, and is better visible for the ...
-
[9]
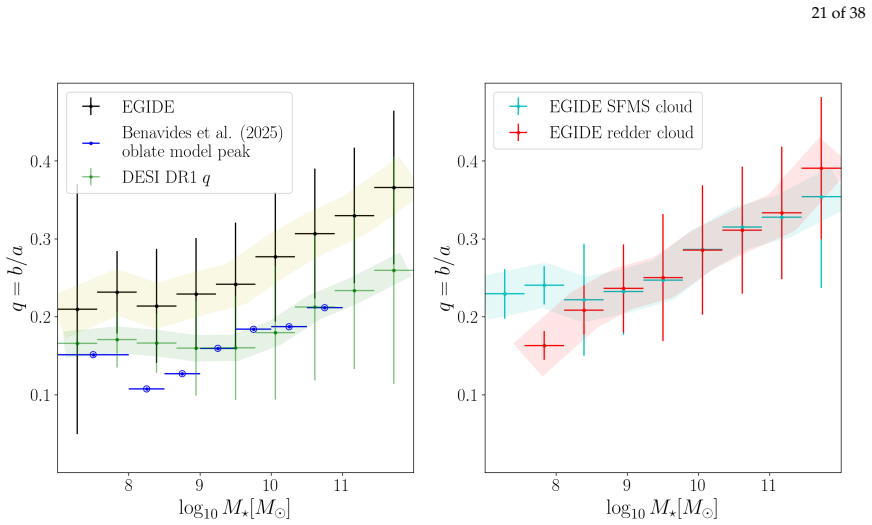
The same trend is independently recovered from the statistical oblate models of [26], and from DESI DR1 ellipticity measurements, cross-validating our approach
The flattening q=b/a increases with total stellar mass M⋆ at the high-mass end (Figure 10, left). The same trend is independently recovered from the statistical oblate models of [26], and from DESI DR1 ellipticity measurements, cross-validating our approach. We found that the increase in b/ais driven by both red cloud early-type galaxies as well as SFMS g...
-
[10]
The decline coefficient k in N∝exp(−k×a/b) is k≈ 1.10 for red galaxies and k≈ 0.97 for blue galaxies in the full sample
The number of red galaxies drops with increasing a/b faster than that of blue galaxies (Figure 11). The decline coefficient k in N∝exp(−k×a/b) is k≈ 1.10 for red galaxies and k≈ 0.97 for blue galaxies in the full sample. For the volume-limited subsample, k≈ 0.9 for all (g−r) colours, while for the mass-limited subsample, k increases across the entire colo...
-
[11]
Flatness measurements from these independent sources also confirm the smallb/avalues found in EGIDE (see Figure A6)
Comparisons with HyperLEDA, DESI DR1, RCSEDv2 and REGALADE show good agreement in redshift (NMAD ≈ 20–170 km/s, Figure A3), total stellar massM⋆ (NMAD ≈ 0.15 dex, Figure A4), and apparent magnitude (NMAD ≈ 0.10 mag, Figure A5). Flatness measurements from these independent sources also confirm the smallb/avalues found in EGIDE (see Figure A6). In summary, ...
-
[12]
The minor-axis brightness profile of the spiral galaxy NGC 4565 and the problem of massive halos
Kormendy, J.; Bruzual A., G. The minor-axis brightness profile of the spiral galaxy NGC 4565 and the problem of massive halos. ApJ1978,223, L63–L66. https://doi.org/10.1086/182729
-
[13]
Structure and origin of S0 galaxies
Burstein, D. Structure and origin of S0 galaxies. III. The luminosity distribution perpendicular to the plane of the disks in S0’s. ApJ1979,234, 829–836. https://doi.org/10.1086/157563
-
[14]
Surface photometry of edge-on spiral galaxies
van der Kruit, P .C.; Searle, L. Surface photometry of edge-on spiral galaxies. I - A model for the three- dimensional distribution of light in galactic disks. A&A1981,95, 105–115
-
[15]
Vertical structure and dynamics of a galactic disk
Jog, C.J. Vertical structure and dynamics of a galactic disk. Phys. Rep.2026,1163, 1–98, [arXiv:astro- ph.GA/2507.02062]. https://doi.org/10.1016/j.physrep.2025.11.003. 14 See https://www.legacysurvey.org/dr10/catalogs/#ellipticities and parameters SHAPE_E1 and SHAPE_E2 in Table dr1_galaxy_stellarmass_lineinfo_v1.0 of the Stellar Mass and Emission Line Ca...
-
[16]
SDSS-IV MaNGA - gas rotation velocity lags in the final sample of MaNGA galaxies
Bizyaev, D.; Walterbos, R.A.M.; Chen, Y.M.; Drory, N.; Lane, R.R.; Brownstein, J.R.; Riffel, R.A. SDSS-IV MaNGA - gas rotation velocity lags in the final sample of MaNGA galaxies. MNRAS2022,515, 1598–1609, [arXiv:astro-ph.GA/2208.00689]. https://doi.org/10.1093/mnras/stac1806
-
[17]
Alinder, S.; Bensby, T.; McMillan, P . Impact of selection criteria on the structural parameters of the Galactic thin and thick discs.arXiv e-prints2025, p. arXiv:2511.10092, [arXiv:astro-ph.GA/2511.10092]. https://doi.org/10.48550/arXiv.2511.10092
-
[18]
The Galaxy in Context: Structural, Kinematic and Integrated Properties
Bland-Hawthorn, J.; Gerhard, O. The Galaxy in Context: Structural, Kinematic, and Integrated Properties. ARA&A2016,54, 529–596, [arXiv:astro-ph.GA/1602.07702]. https://doi.org/10.1146/annurev-astro-081915 -023441
work page internal anchor Pith review Pith/arXiv arXiv doi:10.1146/annurev-astro-081915
-
[19]
Disc growth and vertical heating of lenticular galaxies in the Fornax cluster.arXiv e-prints2025, p
Martig, M.; Pinna, F.; Falcón-Barroso, J.; Martín-Navarro, I.; Minchev, I.; Ding, Y. Disc growth and vertical heating of lenticular galaxies in the Fornax cluster.arXiv e-prints2025, p. arXiv:2511.19632, [arXiv:astro- ph.GA/2511.19632]. https://doi.org/10.48550/arXiv.2511.19632
-
[20]
Struck, C.; Elmegreen, B.G.; DOnghia, E. Scattering, Migration, Re-circularization and Relaxation to Build Out Galaxy Disks with Exponential Profiles.arXiv e-prints2026, p. arXiv:2602.21171, [arXiv:astro- ph.GA/2602.21171]. https://doi.org/10.48550/arXiv.2602.21171
-
[21]
Vertical disc heating in Milky Way-sized galaxies in a cosmological context
Grand, R.J.J.; Springel, V .; Gómez, F.A.; Marinacci, F.; Pakmor, R.; Campbell, D.J.R.; Jenkins, A. Vertical disc heating in Milky Way-sized galaxies in a cosmological context. MNRAS2016,459, 199–219, [arXiv:astro- ph.GA/1512.02219]. https://doi.org/10.1093/mnras/stw601
work page internal anchor Pith review Pith/arXiv arXiv doi:10.1093/mnras/stw601
-
[22]
An Edge-on Regular Disk Galaxy at z = 5.289
Yan, H.; Sun, B.; Ling, C. An Edge-on Regular Disk Galaxy at z = 5.289. ApJ2024,975, 44, [arXiv:astro- ph.GA/2407.04209]. https://doi.org/10.3847/1538-4357/ad7de9
-
[23]
The Physical Thickness of Stellar Disks to z ∼ 2
Hamilton-Campos, K.A.; Simons, R.C.; Peeples, M.S.; Snyder, G.F.; Heckman, T.M. The Physical Thickness of Stellar Disks to z ∼ 2. ApJ2023,956, 147, [arXiv:astro-ph.GA/2303.04171]. https://doi.org/10.3847/1538 -4357/acf211
-
[24]
The emergence of galactic thin and thick discs across cosmic history
Tsukui, T.; Wisnioski, E.; Bland-Hawthorn, J.; Freeman, K. The emergence of galactic thin and thick discs across cosmic history. MNRAS2025,540, 3493–3522, [arXiv:astro-ph.GA/2409.15909]. https://doi.org/10.1 093/mnras/staf604
-
[25]
Through Thick and Thin: The Cosmic Evolution of Disk Scale Height
Yu, S.Y.; Ho, L.C.; Tsukui, T.; Silverman, J.D.; Huertas-Company, M.; Koekemoer, A.M.; Franco, M.; Massey, R.; Yang, L.; Arango-Toro, R.C.; et al. Through Thick and Thin: The Cosmic Evolution of Disk Scale Height.arXiv e-prints2026, p. arXiv:2601.04988, [arXiv:astro-ph.GA/2601.04988]. https: //doi.org/10.48550/arXiv.2601.04988
work page internal anchor Pith review Pith/arXiv arXiv doi:10.48550/arxiv.2601.04988
-
[26]
Early thin-disc assembly revealed by JWST edge-on galaxies
van Asselt, M.; Rizzo, F.; Di Mascolo, L. Early thin-disc assembly revealed by JWST edge-on galaxies.arXiv e-prints2026, p. arXiv:2601.03339, [arXiv:astro-ph.GA/2601.03339]. https://doi.org/10.48550/arXiv.2601.0 3339
work page internal anchor Pith review Pith/arXiv arXiv doi:10.48550/arxiv.2601.0
-
[27]
The Intrinsic Flattening of e, so, and Spiral Galaxies as Related to Galaxy Formation and Evolution
Sandage, A.; Freeman, K.C.; Stokes, N.R. The Intrinsic Flattening of e, so, and Spiral Galaxies as Related to Galaxy Formation and Evolution. ApJ1970,160, 831. https://doi.org/10.1086/150475
-
[28]
Spectroscopic Observations of Superthin Galaxies
Goad, J.W.; Roberts, M.S. Spectroscopic Observations of Superthin Galaxies. In Proceedings of the Bulletin of the American Astronomical Society, December 1979, Vol. 11, p. 668
1979
-
[29]
Spectroscopic observations of superthin galaxies
Goad, J.W.; Roberts, M.S. Spectroscopic observations of superthin galaxies. ApJ1981,250, 79–86. https: //doi.org/10.1086/159349
-
[30]
Galaxy And Mass Assembly (GAMA): the G02 field, Herschel-ATLAS target selection and Data Release 3
Baldry, I.K.; Liske, J.; Brown, M.J.I.; Robotham, A.S.G.; Driver, S.P .; Dunne, L.; Alpaslan, M.; Brough, S.; Cluver, M.E.; Eardley, E.; et al. Galaxy And Mass Assembly: the G02 field, Herschel-ATLAS target selection and data release 3. MNRAS2018,474, 3875–3888, [arXiv:astro-ph.GA/1711.09139]. https: //doi.org/10.1093/mnras/stx3042
work page internal anchor Pith review Pith/arXiv arXiv doi:10.1093/mnras/stx3042
-
[31]
The shapes of galaxies in the Sloan Digital Sky Survey
Padilla, N.D.; Strauss, M.A. The shapes of galaxies in the Sloan Digital Sky Survey. MNRAS2008, 388, 1321–1334, [arXiv:astro-ph/0802.0877]. https://doi.org/10.1111/j.1365-2966.2008.13480.x
work page internal anchor Pith review Pith/arXiv arXiv doi:10.1111/j.1365-2966.2008.13480.x 2008
-
[32]
Ahumada, R.; Allende Prieto, C.; Almeida, A.; Anders, F.; Anderson, S.F.; Andrews, B.H.; Anguiano, B.; Arcodia, R.; Armengaud, E.; Aubert, M.; et al. The 16th Data Release of the Sloan Digital Sky Surveys: First Release from the APOGEE-2 Southern Survey and Full Release of eBOSS Spectra. ApJS2020,249, 3, [arXiv:astro-ph.GA/1912.02905]. https://doi.org/10....
-
[33]
The High Fraction of Thin Disk Galaxies Continues to Challenge ΛCDM Cosmology
Haslbauer, M.; Banik, I.; Kroupa, P .; Wittenburg, N.; Javanmardi, B. The High Fraction of Thin Disk Galaxies Continues to Challenge ΛCDM Cosmology. ApJ2022,925, 183, [arXiv:astro-ph.GA/2202.01221]. https://doi.org/10.3847/1538-4357/ac46ac
-
[34]
van de Sande, J.; Lagos, C.D.P .; Welker, C.; Bland-Hawthorn, J.; Schulze, F.; Remus, R.S.; Bahé, Y.; Brough, S.; Bryant, J.J.; Cortese, L.; et al. The SAMI Galaxy Survey: comparing 3D spectroscopic observations 32 of 38 with galaxies from cosmological hydrodynamical simulations. MNRAS2019,484, 869–891, [arXiv:astro- ph.GA/1810.10542]. https://doi.org/10....
work page internal anchor Pith review Pith/arXiv arXiv doi:10.1093/mnras/sty3506
-
[35]
The shape of FIREbox galaxies and a potential tension with low-mass disks
Klein, C.; Bullock, J.S.; Xia, L.; Moreno, J.; Feldmann, R.; Mercado, F.J.; Faucher-Giguère, C.A.; Stern, J.; Sanchez, N.N.; Hussein, A. The shape of FIREbox galaxies and a potential tension with low-mass disks. arXiv e-prints2025, p. arXiv:2503.05612, [arXiv:astro-ph.GA/2503.05612]. https://doi.org/10.48550/arXiv.25 03.05612
-
[36]
IllustrisTNG in the HSC-SSP: No Shortage of Thin Disk Galaxies in TNG50
Xu, D.; Gao, H.; Bottrell, C.; Yesuf, H.M.; Shi, J. IllustrisTNG in the HSC-SSP: No Shortage of Thin Disk Galaxies in TNG50. ApJ2024,974, 88, [arXiv:astro-ph.GA/2407.19152]. https://doi.org/10.3847/1538-435 7/ad684f
-
[37]
The abundance of thin dwarf galaxies: a challenge for cosmological simulations
Benavides, J.; Sales, L.V .; Navarro, J.F.; White, S.D.M.; Frenk, C.S.; Oman, K.A.; Cole, S. The Abundance of Thin Dwarf Galaxies: a Challenge for Cosmological Simulations.The Open Journal of Astrophysics2026, 9, 62091, [arXiv:astro-ph.GA/2512.11035]. https://doi.org/10.33232/001c.162091
work page internal anchor Pith review Pith/arXiv arXiv doi:10.33232/001c.162091
-
[38]
Gibson, J.L.; Nelson, E.; Williams, C.C.; Price, S.H.; Whitaker, K.E.; Suess, K.A.; de Graaff, A.; Johnson, B.D.; Bunker, A.J.; Baker, W.M.; et al. JADES Ultrared Flattened Objects: Morphologies and Spatial Gradients in Color and Stellar Populations. ApJ2024,974, 48, [arXiv:astro-ph.GA/2408.02726]. https: //doi.org/10.3847/1538-4357/ad64c2
-
[39]
Galaxies Going Bananas: Inferring the 3D Geometry of High-redshift Galaxies with JWST-CEERS
Pandya, V .; Zhang, H.; Huertas-Company, M.; Iyer, K.G.; McGrath, E.; Barro, G.; Finkelstein, S.L.; Kümmel, M.; Hartley, W.G.; Ferguson, H.C.; et al. Galaxies Going Bananas: Inferring the 3D Geometry of High-redshift Galaxies with JWST-CEERS. ApJ2024,963, 54, [arXiv:astro-ph.GA/2310.15232]. https://doi.org/10.3847/ 1538-4357/ad1a13
-
[40]
Peng, Y. A Unified Explanation for JWST Little Red Dots and High-Redshift Low-Mass Disk-like Galax- ies: Prolate Galaxies Viewed End-on vs Side-on.arXiv e-prints2026, p. arXiv:2603.01668, [arXiv:astro- ph.GA/2603.01668]. https://doi.org/10.48550/arXiv.2603.01668
-
[41]
A smooth filament origin for distant prolate galaxies seen by JWST and HST
Pozo, A.; Broadhurst, T.; Emami, R.; Mocz, P .; Vogelsberger, M.; Hernquist, L.; Conselice, C.J.; Luu, H.N.; Smoot, G.F.; Windhorst, R. A smooth filament origin for distant prolate galaxies seen by JWST and HST. Nature Astronomy2025, [arXiv:astro-ph.GA/2407.16339]. https://doi.org/10.1038/s41550-025-02721-5
-
[42]
The dark matter halo shape of edge-on disk galaxies
O’Brien, J.C.; Freeman, K.C.; van der Kruit, P .C. The dark matter halo shape of edge-on disk galaxies. IV . UGC
-
[43]
The dark matter halo shape of edge-on disk galaxies - IV. UGC 7321
A&A2010,515, A63, [arXiv:astro-ph.CO/1002.3098]. https://doi.org/10.1051/0004-6361/200912568
work page internal anchor Pith review Pith/arXiv arXiv doi:10.1051/0004-6361/200912568
-
[44]
Estimating the Dark Halo Mass from the Relative Thickness of Stellar Disks
Sotnikova, N.Y.; Rodionov, S.A. Estimating the dark halo mass from the relative thickness of stellar disks. Astronomy Letters2006,32, 649–660, [arXiv:astro-ph/astro-ph/0609163]. https://doi.org/10.1134/S1063773 70610001X
work page internal anchor Pith review Pith/arXiv arXiv doi:10.1134/s1063773
-
[45]
Numerical Modelling of the Vertical Structure and Dark Halo Parameters in Disc Galaxies
Khoperskov, A.; Bizyaev, D.; Tiurina, N.; Butenko, M. Numerical modelling of the vertical structure and dark halo parameters in disc galaxies.Astronomische Nachrichten2010,331, 731, [arXiv:astro-ph.CO/1007.4693]. https://doi.org/10.1002/asna.200911402
work page internal anchor Pith review Pith/arXiv arXiv doi:10.1002/asna.200911402
-
[46]
Marchuk, A.; Kozlov, M. Estimating the contribution of a dark halo at different distances in the disk of an edge-on galaxy.Publications of the Pulkovo Observatory2025,237, 33–50. https://doi.org/10.31725/0367-7966 -2025-237-33-50
-
[47]
Bending instability in galactic discs. Advocacy of the linear theory
Rodionov, S.A.; Sotnikova, N.Y. Bending instability in galactic discs: advocacy of the linear theory. MNRAS 2013,434, 2373–2379, [1306.5975]. https://doi.org/10.1093/mnras/stt1183
work page internal anchor Pith review Pith/arXiv arXiv doi:10.1093/mnras/stt1183 2013
-
[48]
Thickness of Thin Stellar Disks and the Mass of the Dark Halo
Zasov, A.V .; Makarov, D.I.; Mikhailova, E.A. Thickness of Thin Stellar Disks and the Mass of the Dark Halo. Soviet Astronomy Letters1991,17, 374
-
[49]
The stellar disk thickness of LSB galaxies
Bizyaev, D.; Kajsin, S. The Stellar Disk Thickness of Low Surface Brightness Galaxies. ApJ2004,613, 886–897, [arXiv:astro-ph/astro-ph/0406498]. https://doi.org/10.1086/423229
work page internal anchor Pith review Pith/arXiv arXiv doi:10.1086/423229
-
[51]
Mass modelling of superthin galaxies: IC5249, UGC7321 and IC2233
Banerjee, A.; Bapat, D. Mass modelling of superthin galaxies: IC5249, UGC7321 and IC2233. MNRAS2017, 466, 3753–3761, [arXiv:astro-ph.GA/1705.02659]. https://doi.org/10.1093/mnras/stw3219
work page internal anchor Pith review Pith/arXiv arXiv doi:10.1093/mnras/stw3219
-
[52]
Mass modelling of a superthin galaxy, FGC1540
Kurapati, S.; Banerjee, A.; Chengalur, J.N.; Makarov, D.; Borisov, S.; Afanasiev, A.; Antipova, A. Mass modelling of a superthin galaxy, FGC 1540. MNRAS2018,479, 5686–5695, [arXiv:astro-ph.GA/1807.02992]. https://doi.org/10.1093/mnras/sty1856
work page internal anchor Pith review Pith/arXiv arXiv doi:10.1093/mnras/sty1856
-
[53]
Spectral Observations of Superthin Galaxies
Bizyaev, D.; Makarov, D.I.; Reshetnikov, V .P .; Mosenkov, A.V .; Kautsch, S.J.; Antipova, A.V . Spectral Observations of Superthin Galaxies. ApJ2021,914, 104, [arXiv:astro-ph.GA/2105.11855]. https://doi.org/ 10.3847/1538-4357/abfb03. 33 of 38
-
[54]
Hu, J.; Xu, D.; Li, C. Formation of Superthin Galaxies in IllustrisTNG.Research in Astronomy and Astrophysics 2024,24, 075019, [arXiv:astro-ph.GA/2406.13745]. https://doi.org/10.1088/1674-4527/ad5399
-
[55]
Galactic warps: From cosmic noon to the current epoch
Reshetnikov, V .P .; Chugunov, I.V .; Marchuk, A.A.; Mosenkov, A.V .; Kozlov, M.D.; Savchenko, S.S.; Makarov, D.I.; Antipova, A.V .; Sypkova, A.M. Galactic warps: From cosmic noon to the current epoch. A&A2025, 697, L1, [arXiv:astro-ph.GA/2504.12403]. https://doi.org/10.1051/0004-6361/202554941
-
[56]
Galaxies with conspicuous optical warps
Reshetnikov, V .P .; Mosenkov, A.V .; Moiseev, A.V .; Kotov, S.S.; Savchenko, S.S. Galaxies with conspicuous optical warps. MNRAS2016,461, 4233–4245, [arXiv:astro-ph.GA/1607.02274]. https://doi.org/10.1093/ mnras/stw1623
-
[57]
Statistics of optical warps in spiral disks
Reshetnikov, V .; Combes, F. Statistics of optical WARPS in spiral disks. A&A1998,337, 9–16, [arXiv:astro- ph/astro-ph/9806114]. https://doi.org/10.48550/arXiv.astro-ph/9806114
work page internal anchor Pith review Pith/arXiv arXiv doi:10.48550/arxiv.astro-ph/9806114
-
[58]
On the Stellar Disk Vertical Scale Height of Edge-on Galaxies from S 4G
Ranaivoharimina, N.; Randriamampandry, T.; Wang, J.; Menéndez-Delmestre, K.; Gonçalves, T.S. On the Stellar Disk Vertical Scale Height of Edge-on Galaxies from S 4G. ApJ2024,977, 66, [arXiv:astro- ph.GA/2410.09762]. https://doi.org/10.3847/1538-4357/ad85d5
-
[59]
B/PS bulges in DESI Legacy edge-on galaxies - I
Marchuk, A.A.; Smirnov, A.A.; Sotnikova, N.Y.; Bunakalya, D.A.; Savchenko, S.S.; Reshetnikov, V .P .; Usachev, P .A.; Tikhonenko, I.S.; Zozulia, V .D.; Zakharova, D.A. B/PS bulges in DESI Legacy edge-on galaxies - I. Sample building. MNRAS2022,512, 1371–1390, [arXiv:astro-ph.GA/2203.01154]. https: //doi.org/10.1093/mnras/stac599
-
[60]
Smirnov, A.; Marchuk, A.; Zozulia, V .; Sotnikova, N.; Savchenko, S. Boxy/Peanut Bulges: Comparative Analysis of EGIPS Galaxies and TNG50 Models.Galaxies2026,14, 4, [arXiv:astro-ph.GA/2601.13893]. https://doi.org/10.3390/galaxies14010004
-
[61]
Smirnov, A.A.; Savchenko, S.S. New X-shaped bulge photometric model as a tool for measuring B/PS bulges and their X-structures in photometric studies. MNRAS2020,499, 462–481, [arXiv:astro-ph.GA/2007.12121]. https://doi.org/10.1093/mnras/staa2892
-
[62]
A new catalogue of polar-ring galaxies selected from the SDSS
Moiseev, A.V .; Smirnova, K.I.; Smirnova, A.A.; Reshetnikov, V .P . A new catalogue of polar-ring galaxies selected from the Sloan Digital Sky Survey. MNRAS2011,418, 244–257, [arXiv:astro-ph.CO/1107.1966]. https://doi.org/10.1111/j.1365-2966.2011.19479.x
work page internal anchor Pith review Pith/arXiv arXiv doi:10.1111/j.1365-2966.2011.19479.x 1966
-
[63]
The occurrence rate of galaxies with polar structures may be significantly underestimated
Mosenkov, A.V .; Bahr, S.K.H.; Reshetnikov, V .P .; Shakespear, Z.; Smirnov, D.V . The occurrence rate of galaxies with polar structures may be significantly underestimated. A&A2024,681, L15, [arXiv:astro- ph.GA/2311.03529]. https://doi.org/10.1051/0004-6361/202348494
-
[64]
The luminosity function of ringed galaxies
Smirnov, D.V .; Reshetnikov, V .P . The luminosity function of ringed galaxies. MNRAS2022,516, 3692–3700, [arXiv:astro-ph.GA/2209.06875]. https://doi.org/10.1093/mnras/stac2549
-
[65]
Polar-ring galaxies: the SDSS view on the symbiotic galaxies
Reshetnikov, V .; Combes, F. Polar-ring galaxies: the SDSS view on the symbiotic galaxies. MNRAS2015, 447, 2287–2294, [arXiv:astro-ph.GA/1412.2016]. https://doi.org/10.1093/mnras/stu2604
work page internal anchor Pith review Pith/arXiv arXiv doi:10.1093/mnras/stu2604 2016
-
[66]
COUGS-DESI: A Catalog of Unusual Galaxies with Polar Structures in the DESI Legacy Imaging Surveys
Bahr, S.K.H.; Mosenkov, A.V .; Guerrette, J.A.; Jensen, I.H.; George, J.X.; Spigarelli, T.E.; Smith, R.P .; Burton, B.T.; Beckstead, K.W.; Seguine, J.D.; et al. COUGS-DESI: A Catalog of Unusual Galaxies with Polar Structures in the DESI Legacy Imaging Surveys.arXiv e-prints2026, p. arXiv:2601.02579, [arXiv:astro- ph.GA/2601.02579]. https://doi.org/10.4855...
work page internal anchor Pith review Pith/arXiv arXiv doi:10.48550/arxiv.2601.02579
-
[67]
Down-bending Breaks in Galactic Disks Are an Intrinsic Byproduct of Inside-out Growth
Chen, L.; Du, M.; Lu, S.; Li, J.; Ho, L.C. Down-bending Breaks in Galactic Disks Are an Intrinsic Byproduct of Inside-out Growth.arXiv e-prints2026, p. arXiv:2602.00626, [arXiv:astro-ph.GA/2602.00626]. https: //doi.org/10.48550/arXiv.2602.00626
work page internal anchor Pith review Pith/arXiv arXiv doi:10.48550/arxiv.2602.00626
-
[68]
The Tully-Fisher relation for flat galaxies
Makarov, D.I.; Zaitseva, N.A.; Bizyaev, D.V . The Tully-Fisher relation for flat galaxies. MNRAS2018, 479, 3373–3380, [arXiv:astro-ph.GA/1806.07384]. https://doi.org/10.1093/mnras/sty1629
work page internal anchor Pith review Pith/arXiv arXiv doi:10.1093/mnras/sty1629
-
[69]
Antipova, A.V .; Makarov, D.I.; Libeskind, N.I.; Tempel, E. Orientation of galaxy spins relative to filaments of the large-scale structure of the Universe.Publications of the Astronomical Society of Australia2025,42, e084, [arXiv:astro-ph.GA/2507.07334]. https://doi.org/10.1017/pasa.2025.10041
-
[70]
Zee, W.B.G.; Jung, S.L.; Paudel, S.; Yoon, S.J. Warped Disk Galaxies. II. From the Cosmic Web to the Galactic Warp. ApJ2025,993, 205, [arXiv:astro-ph.GA/2510.18942]. https://doi.org/10.3847/1538-4357/ae0e13
-
[71]
The great disk of Milky-Way satellites and cosmological sub-structures
Kroupa, P .; Theis, C.; Boily, C.M. The great disk of Milky-Way satellites and cosmological sub-structures. A&A2005,431, 517–521, [arXiv:astro-ph/astro-ph/0410421]. https://doi.org/10.1051/0004-6361:20041122
work page internal anchor Pith review Pith/arXiv arXiv doi:10.1051/0004-6361:20041122
-
[72]
A co-rotating gas and satellite structure around the interacting galaxy pair NGC 4490/85
Karachentsev, I.D.; Kroupa, P . A co-rotating gas and satellite structure around the interacting galaxy pair NGC 4490/85. MNRAS2024,528, 2805–2811, [arXiv:astro-ph.GA/2401.09527]. https://doi.org/10.1093/ mnras/stae184
-
[73]
SDSS-IV MaNGA: Ionization Sources of the Extra-planar Diffuse Ionized Gas
Postnikova, V .K.; Bizyaev, D. SDSS-IV MaNGA: Ionization Sources of the Extra-planar Diffuse Ionized Gas. Astronomy Letters2023,49, 151–166, [arXiv:astro-ph.GA/2307.01544]. https://doi.org/10.1134/S106377372 3040047. 34 of 38
-
[74]
Extraplanar emission in isolated edge-on late-type galaxies - II
Sardaneta, M.M.; Amram, P .; Rampazzo, R.; Rosado, M.; Fuentes-Carrera, I.; Ghosh, S. Extraplanar emission in isolated edge-on late-type galaxies - II. The Hα kinematics. MNRAS2025,544, 1861–1896, [arXiv:astro- ph.GA/2510.18110]. https://doi.org/10.1093/mnras/staf1828
-
[75]
HALOGAS: Extraplanar gas in NGC 3198
Gentile, G.; Józsa, G.I.G.; Serra, P .; Heald, G.H.; de Blok, W.J.G.; Fraternali, F.; Patterson, M.T.; Walterbos, R.A.M.; Oosterloo, T. HALOGAS: Extraplanar gas in NGC 3198. A&A2013,554, A125, [arXiv:astro- ph.CO/1304.4232]. https://doi.org/10.1051/0004-6361/201321116
work page internal anchor Pith review Pith/arXiv arXiv doi:10.1051/0004-6361/201321116
-
[76]
Imaging the disk-halo interface of NGC 891: a 2.7 kpc-thick molecular gas disk.arXiv e-prints2026, p
Jiménez-López, D.; García-Burillo, S.; Querejeta, M.; Usero, A.; Tarrío, P . Imaging the disk-halo interface of NGC 891: a 2.7 kpc-thick molecular gas disk.arXiv e-prints2026, p. arXiv:2603.06913, [arXiv:astro- ph.GA/2603.06913]. https://doi.org/10.48550/arXiv.2603.06913
-
[77]
Sil’chenko, O.K.; Moiseev, A.V .; Egorov, O.V . The Gas Kinematics, Excitation, and Chemistry, in Connection with Star Formation, in Lenticular Galaxies. ApJS2019,244, 6, [arXiv:astro-ph.GA/1907.07261]. https: //doi.org/10.3847/1538-4365/ab3415
-
[78]
Krumholz, M.R.; Dekel, A.; McKee, C.F. A Universal, Local Star Formation Law in Galactic Clouds, nearby Galaxies, High-redshift Disks, and Starbursts. ApJ2012,745, 69, [arXiv:astro-ph.CO/1109.4150]. https://doi.org/10.1088/0004-637X/745/1/69
work page internal anchor Pith review Pith/arXiv arXiv doi:10.1088/0004-637x/745/1/69
-
[79]
Volumetric star formation laws of disc galaxies
Bacchini, C.; Fraternali, F.; Iorio, G.; Pezzulli, G. Volumetric star formation laws of disc galaxies. A&A2019, 622, A64, [arXiv:astro-ph.GA/1810.03616]. https://doi.org/10.1051/0004-6361/201834382
work page internal anchor Pith review Pith/arXiv arXiv doi:10.1051/0004-6361/201834382
-
[80]
Gravitational instability and star formation in NGC 628
Marchuk, A.A. Gravitational instability and star formation in NGC 628. MNRAS2018,476, 3591–3599, [arXiv:astro-ph.GA/1804.07964]. https://doi.org/10.1093/mnras/sty457
work page internal anchor Pith review Pith/arXiv arXiv doi:10.1093/mnras/sty457
-
[81]
Two-component gravitational instability in spiral galaxies
Marchuk, A.A.; Sotnikova, N.Y. Two-component gravitational instability in spiral galaxies. MNRAS2018, 475, 4891–4910, [arXiv:astro-ph.GA/1804.07962]. https://doi.org/10.1093/mnras/sty100
work page internal anchor Pith review Pith/arXiv arXiv doi:10.1093/mnras/sty100
discussion (0)
Sign in with ORCID, Apple, or X to comment. Anyone can read and Pith papers without signing in.