FluidViews: Adaptive Drag-and-Drop Token Filters for Heterogeneous Multi-View Visual Analytics
Pith reviewed 2026-06-30 23:25 UTC · model grok-4.3
The pith
FluidViews turns visual marks into draggable, persistent tokens that apply context-sensitive filters across coordinated views without menus or dialogs.
A machine-rendered reading of the paper's core claim, the machinery that carries it, and where it could break.
Core claim
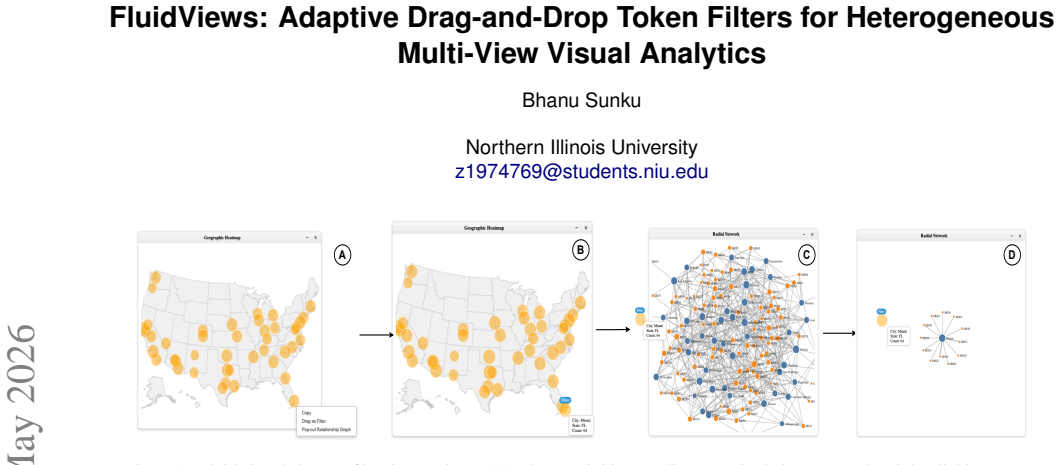
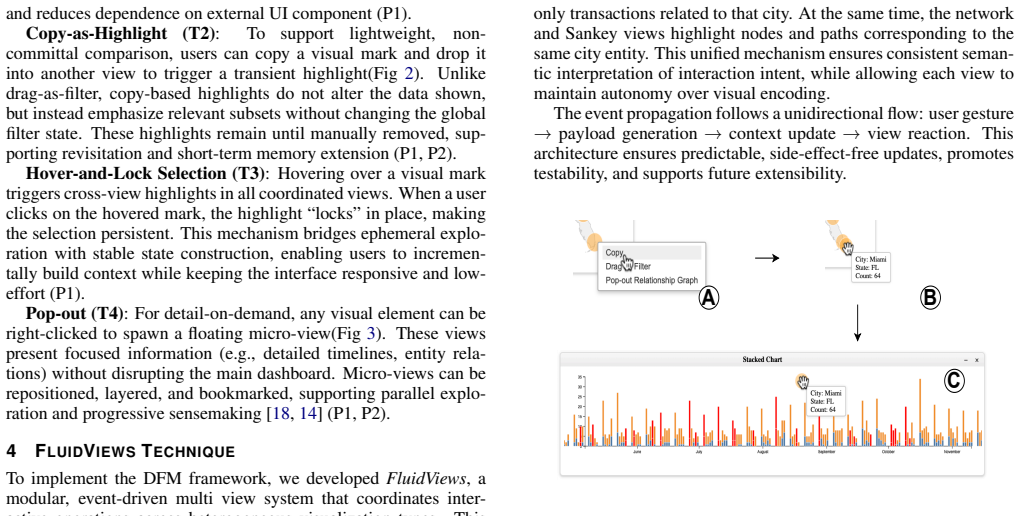
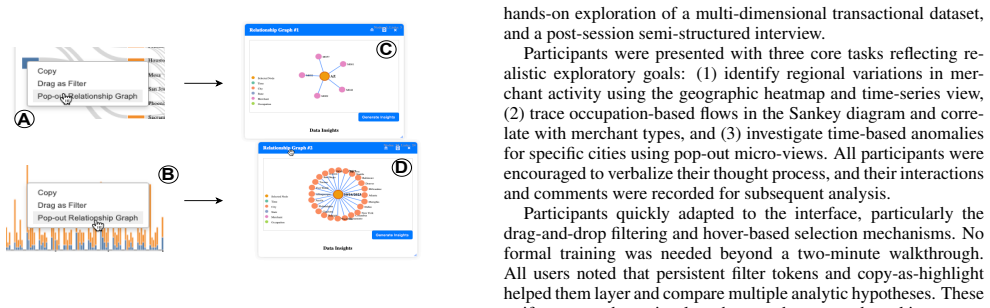
FluidViews elevates filters to manipulable token objects by implementing Copy-as-Highlight, which duplicates any visual mark into a persistent highlight token, and Drag-as-Filter, which allows the same mark to be dragged and dropped onto a target view for immediate, context-sensitive filtering, all within coordinated multi-view setups that optionally include spatially independent pop-out micro-views for on-demand detail without primary-workspace disruption.
What carries the argument
Drag-as-Filter and Copy-as-Highlight gestures that convert visual marks into persistent, draggable token objects for in-place filtering and highlighting.
If this is right
- Analysts can execute rapid cross-view comparisons by copying marks into highlight tokens that remain active across views.
- Context-sensitive filters can be applied by dropping a mark onto a target view, eliminating the need to navigate separate panels.
- Exploration of heterogeneous datasets proceeds through sequences of lightweight gestures rather than repeated panel interactions.
- Optional micro-views allow detail inspection while the primary coordinated workspace stays intact.
Where Pith is reading between the lines
- The token model could be extended to support undoable filter chains by retaining dropped marks as editable objects.
- Performance gains may depend on visual mark density; sparse views might reduce the discoverability of the gestures.
- Integration with existing visualization libraries would require mapping mark selection events to the token creation logic.
Load-bearing premise
Direct-manipulation gestures applied to visual marks can be realized without creating additional context switches or forcing users into modal dialogs.
What would settle it
A within-subjects study measuring task completion time, error rate, and reported cognitive load when the same multi-view exploration sequence is performed once with FluidViews gestures and once with conventional filter panels.
Figures
read the original abstract
Interactive visual analytics workflows are often disrupted by rigid filter panels and context switches that break analysts' cognitive flow. We introduce FluidViews, a web-based framework that elevates filters to first-class, manipulable objects through two novel direct-manipulation interactions. Copy-as-Highlight enables users to duplicate any visual mark into a persistent highlight token for rapid, transient cross-view comparison, while Drag-as-Filter allows analysts to pick up a mark and drop it onto another view to apply context-sensitive filters in place no menus, panels, or modal dialogs required. An optional pop-out micro-view provides on-demand, spatially independent subviews for detailed inspection without disrupting the primary workspace. By embedding these lightweight gestures into coordinated multi-view environments, FluidViews preserves analytic momentum, reduces cognitive overhead, and supports fluid, multi-step exploration across heterogeneous datasets. We describe the system's design and implementation, illustrate its application in exploratory workflows, and discuss how tangible filter objects can transform interactive data exploration.
Editorial analysis
A structured set of objections, weighed in public.
Referee Report
Summary. The manuscript introduces FluidViews, a web-based framework for visual analytics that elevates filters to first-class manipulable objects via two direct-manipulation gestures: Copy-as-Highlight (duplicating visual marks into persistent highlight tokens for cross-view comparison) and Drag-as-Filter (dragging a mark onto another view to apply context-sensitive filters without menus, panels, or modal dialogs). An optional pop-out micro-view supports on-demand subviews. The central claims are that embedding these gestures into coordinated multi-view environments preserves analytic momentum, reduces cognitive overhead, and supports fluid multi-step exploration across heterogeneous datasets. The paper describes the system's design and implementation and illustrates application through exploratory workflows.
Significance. If the interaction benefits hold, the work could meaningfully advance direct-manipulation techniques in visual analytics by treating filters as tangible tokens rather than panel-based controls. The design rationale for avoiding context switches and the workflow illustrations provide a clear conceptual contribution to multi-view coordination.
major comments (1)
- [Abstract] Abstract: The assertions that FluidViews 'preserves analytic momentum, reduces cognitive overhead, and supports fluid, multi-step exploration across heterogeneous datasets' rest entirely on design rationale and workflow descriptions. No user studies, task metrics, NASA-TLX scores, error rates, or comparative baselines against traditional filter panels are reported. This is load-bearing for the central claim because the performance benefits constitute the primary motivation and asserted outcome of the proposed gestures.
Simulated Author's Rebuttal
We thank the referee for the detailed review and for identifying this critical issue with the abstract. We agree that the performance-oriented claims require qualification, as the work is a design and systems contribution without empirical evaluation.
read point-by-point responses
-
Referee: [Abstract] Abstract: The assertions that FluidViews 'preserves analytic momentum, reduces cognitive overhead, and supports fluid, multi-step exploration across heterogeneous datasets' rest entirely on design rationale and workflow descriptions. No user studies, task metrics, NASA-TLX scores, error rates, or comparative baselines against traditional filter panels are reported. This is load-bearing for the central claim because the performance benefits constitute the primary motivation and asserted outcome of the proposed gestures.
Authors: We acknowledge the validity of this observation. The manuscript presents a novel interaction framework through design rationale, implementation details, and illustrative workflows rather than controlled user studies. In the revised manuscript we will (1) rephrase the abstract to describe the gestures as intended to support these outcomes based on direct-manipulation principles, (2) add an explicit statement that empirical validation of the claimed benefits is future work, and (3) apply parallel revisions to the introduction and discussion to ensure claims remain consistent with the evidence provided. We believe these changes will address the concern while preserving the paper's conceptual contribution. revision: yes
Circularity Check
No significant circularity in descriptive design framework
full rationale
The manuscript is a systems/design paper that introduces interaction techniques (Copy-as-Highlight, Drag-as-Filter) and asserts benefits via design rationale and workflow illustrations. No equations, fitted parameters, predictions, or derivation chains exist. No self-citations are used as load-bearing premises for uniqueness theorems or ansatzes. The central claims rest on descriptive assertions rather than any reduction of outputs to inputs by construction. This is the expected non-finding for papers without quantitative or formal derivations.
Axiom & Free-Parameter Ledger
axioms (1)
- domain assumption Direct manipulation of visual marks can be realized in web-based coordinated multi-view systems without introducing disruptive context switches.
Reference graph
Works this paper leans on
-
[1]
Accessed: 2025-04-19
React.js. Accessed: 2025-04-19. 3
2025
-
[2]
C. Ahlberg and B. Shneiderman. Visual information seeking: tight coupling of dynamic query filters with starfield displays. InProceed- ings of the SIGCHI Conference on Human Factors in Computing Sys- tems, CHI ’94, p. 313–317. Association for Computing Machinery, New York, NY , USA, 1994. doi: 10.1145/191666.191775 2
-
[3]
Baldonado, A
M. Baldonado, A. Woodruff, and A. Kuchinsky. Guidelines for using multiple views in information visualization. pp. 110–119, 01 2000. 1, 2
2000
-
[4]
R. A. Becker and W. S. Cleveland. Brushing scatterplots.Technomet- rics, 29(2):127–142, May 1987. 2
1987
-
[5]
C. Collins and S. Carpendale. Vislink: Revealing relationships amongst visualizations.IEEE Transactions on Visualization and Com- puter Graphics, 13(6):1192–1199, 2007. doi: 10.1109/TVCG.2007. 70521 2
-
[6]
C. Dunne, N. Henry Riche, B. Lee, R. Metoyer, and G. Robert- son. Graphtrail: analyzing large multivariate, heterogeneous networks while supporting exploration history. InProceedings of the SIGCHI Conference on Human Factors in Computing Systems, CHI ’12, p. 1663–1672. Association for Computing Machinery, New York, NY , USA, 2012. doi: 10.1145/2207676.2208293 2
-
[7]
M. Hearst. Design recommendations for hierarchical faceted search interfaces. InACM SIGIR workshop on faceted search, pp. 1–5. Seat- tle, W A, 2006. 1, 2
2006
-
[8]
J. Heer and G. Robertson. Animated transitions in statistical data graphics.IEEE Transactions on Visualization and Computer Graph- ics, 13(6):1240–1247, 2007. doi: 10.1109/TVCG.2007.70539 1
-
[9]
Hernandez, S
M.-E. Hernandez, S. M. Falconer, M.-A. D. Storey, S. Carini, and I. Sim. Synchronized tag clouds for exploring semi-structured clini- cal trial data. InConference of the Centre for Advanced Studies on Collaborative Research, 2008. 1
2008
-
[10]
P. Koytek, C. Perin, J. Vermeulen, E. Andr ´e, and S. Carpendale. My- brush: Brushing and linking with personal agency.IEEE Transactions on Visualization and Computer Graphics, 24(1):605–615, 2018. doi: 10.1109/TVCG.2017.2743859 2
-
[11]
Z. Liu and J. Heer. The effects of interactive latency on exploratory visual analysis.Visualization and Computer Graphics, IEEE Transac- tions on, 20:2122–2131, 12 2014. doi: 10.1109/TVCG.2014.2346452 2
-
[12]
P. Mindek, M. Gr ¨oller, and S. Bruckner. Managing spatial selections with contextual snapshots.Comput. Graph. Forum, 33(8):132–144, Dec. 2014. doi: 10.1111/cgf.12406 2
-
[13]
C. North and B. Shneiderman. Snap-together visualization: a user in- terface for coordinating visualizations via relational schemata. InPro- ceedings of the Working Conference on Advanced Visual Interfaces, pp. 128–135, 2000. doi: 10.1145/345513.345282 1, 2
-
[14]
C. Perin. Direct manipulation for information visualization. 2014. 3
2014
-
[15]
Pirolli and S
P. Pirolli and S. Card. The sensemaking process and leverage points for analyst technology as identified through cognitive task analysis. InProceedings of International Conference on Intelligence Analysis, vol. 5, pp. 1–6, 2005. 2
2005
-
[16]
C. Quijano-Chavez, N. Doerr, B. Lee, D. Schmalstieg, and M. Sedl- mair. Brushing and linking for situated analytics. In2024 IEEE Con- ference on Virtual Reality and 3D User Interfaces Abstracts and Work- shops (VRW), pp. 597–603, 2024. doi: 10.1109/VRW62533.2024. 00116 2
-
[17]
J. C. Roberts. State of the art: Coordinated & multiple views in ex- ploratory visualization. InProceedings of International Conference on Coordinated and Multiple Views in Exploratory Visualization, pp. 61–71. IEEE, 2007. doi: 10.1109/CMV.2007.20 1
-
[18]
B. Shneiderman. The eyes have it: a task by data type taxonomy for information visualizations. InProceedings 1996 IEEE Symposium on Visual Languages, pp. 336–343, 1996. doi: 10.1109/VL.1996.545307 2, 3, 4
-
[19]
M. J. Sifer. Filter co-ordinations for exploring multi-dimensional data. J. Vis. Lang. Comput., 17:107–125, 2006. 1
2006
-
[20]
H. Song, B. Kim, B. Lee, and J. Seo. A comparative evaluation on tree visualization methods for hierarchical structures with large fan- outs. InProceedings of the SIGCHI Conference on Human Factors in Computing Systems, pp. 223–232, 2010. 1
2010
-
[21]
M. Steinberger, M. Waldner, M. Streit, A. Lex, and D. Schmalstieg. Context-preserving visual links.IEEE Trans. on Visualization & Com- puter Graphics, 17(12):2249–2258, 2011. doi: 10.1109/TVCG.2011. 183 2
-
[22]
C. Stolper, A. Perer, and D. Gotz. Progressive visual analytics: User- driven visual exploration of in-progress analytics.IEEE Transactions on Visualization and Computer Graphics, 20:1–1, 12 2014. doi: 10. 1109/TVCG.2014.2346574 2
-
[23]
Stolte, D
C. Stolte, D. Tang, and P. Hanrahan. Polaris: a system for query, analysis, and visualization of multidimensional databases.Communi- cations of the ACM, 51(11):75–84, 2008. 1
2008
-
[24]
M. Sun, A. R. Shaikh, Y . Ma, D. Koop, and H. Alhoori. Bound- ary blending: Reconsidering the design of multi-view visualizations,
- [25]
-
[26]
C. Viau and M. J. McGuffin. Connectedcharts: Explicit visualiza- tion of relationships between data graphics.Comput. Graph. Fo- rum, 31(3pt4):1285–1294, June 2012. doi: 10.1111/j.1467-8659. 2012.03121.x 2
-
[27]
Waldner, W
M. Waldner, W. Puff, A. Lex, M. Streit, and D. Schmalstieg. Visual links across applications. InProceedings of Graphics Interface 2010, GI ’10, p. 129–136. Canadian Information Processing Society, CAN,
2010
-
[28]
C. Weaver. Cross-filtered views for multidimensional visual anal- ysis.IEEE Transactions on Visualization and Computer Graphics, 16(2):192–204, 2009. doi: 10.1109/TVCG.2009.94 2
-
[29]
Wongsuphasawat, D
K. Wongsuphasawat, D. Moritz, A. Anand, J. D. Mackinlay, B. Howe, and J. Heer. V oyager: Exploratory analysis via faceted browsing of visualization recommendations.IEEE Transactions on Visualization and Computer Graphics, 22:649–658, 2016. 2
2016
discussion (0)
Sign in with ORCID, Apple, or X to comment. Anyone can read and Pith papers without signing in.