SN 2024dy: Dust formation in a long-lived Type IIn supernova and constraints on the dust mass
Pith reviewed 2026-06-26 20:19 UTC · model grok-4.3
The pith
SN 2024dy observations indicate newly formed carbon dust of about 10^{-5} solar masses via NIR excess and red-wing suppression in Hα.
A machine-rendered reading of the paper's core claim, the machinery that carries it, and where it could break.
Core claim
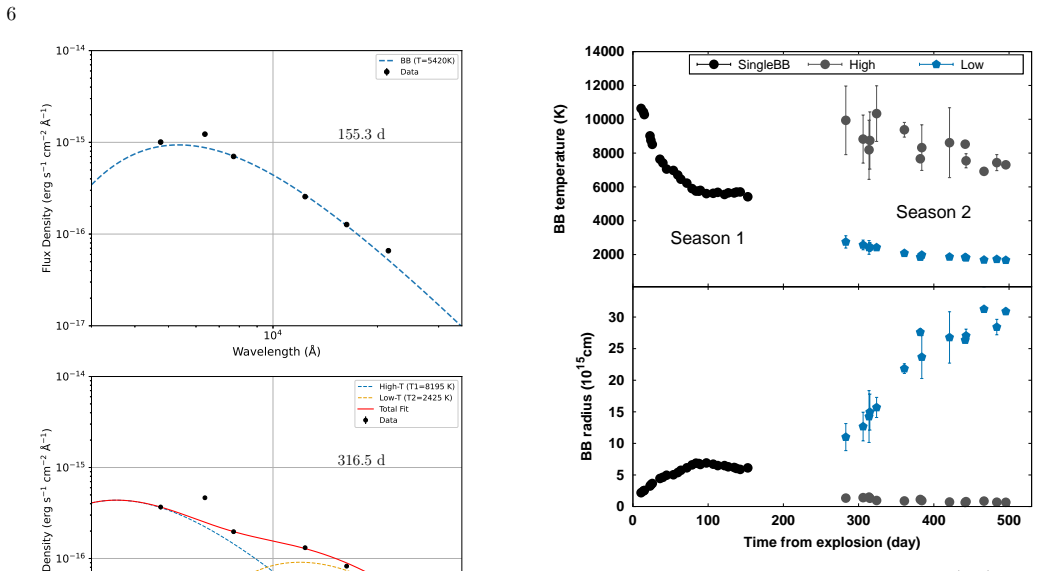
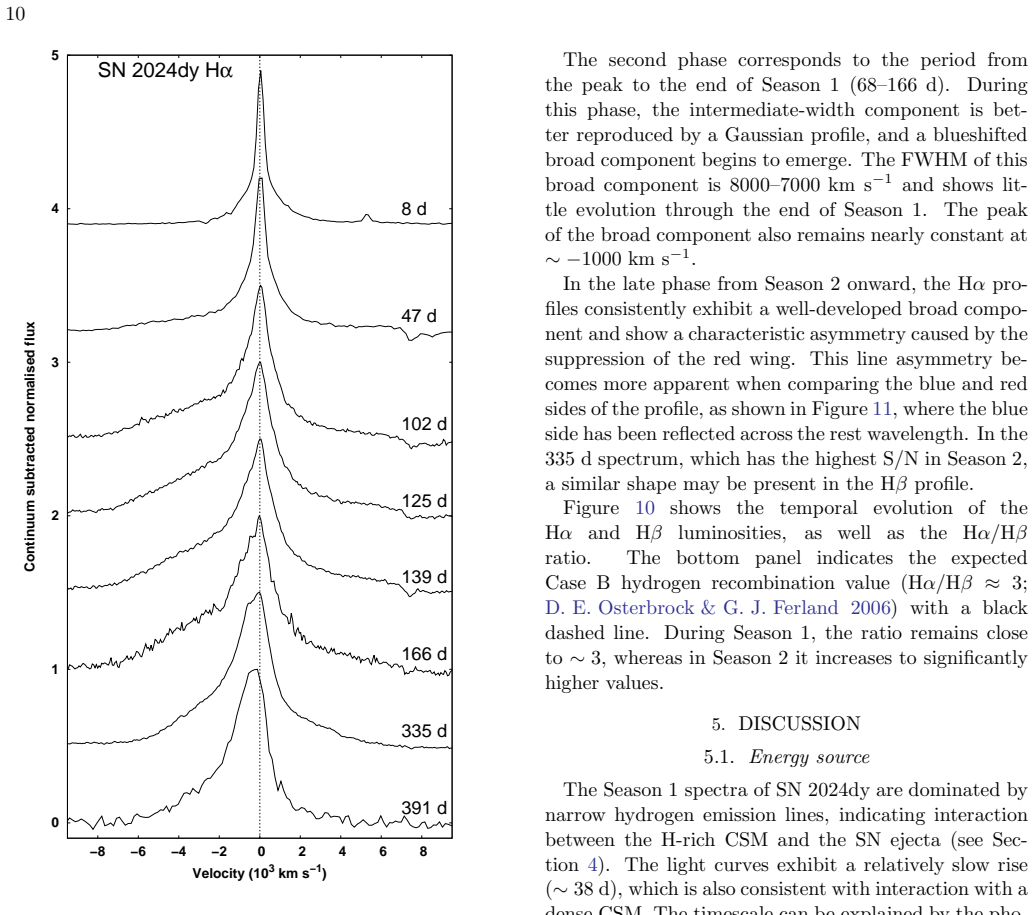
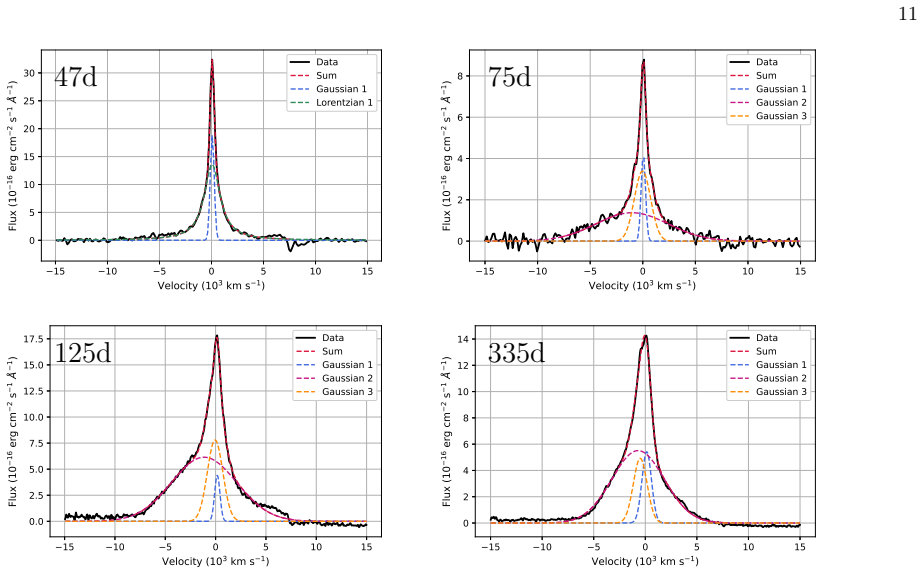
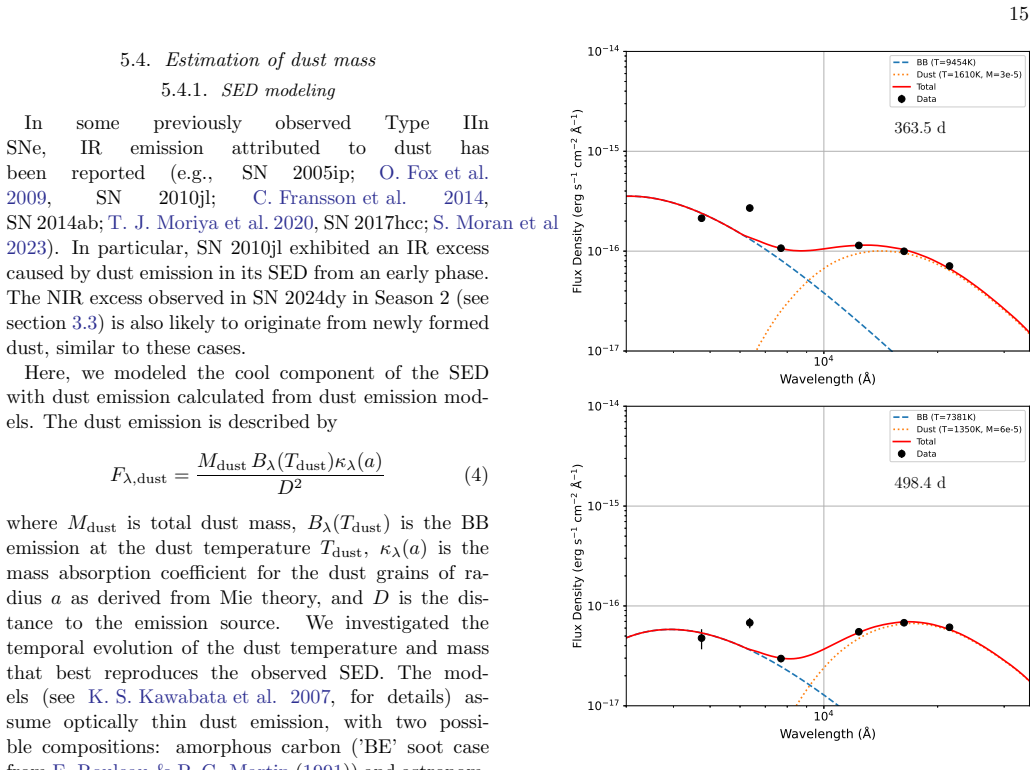
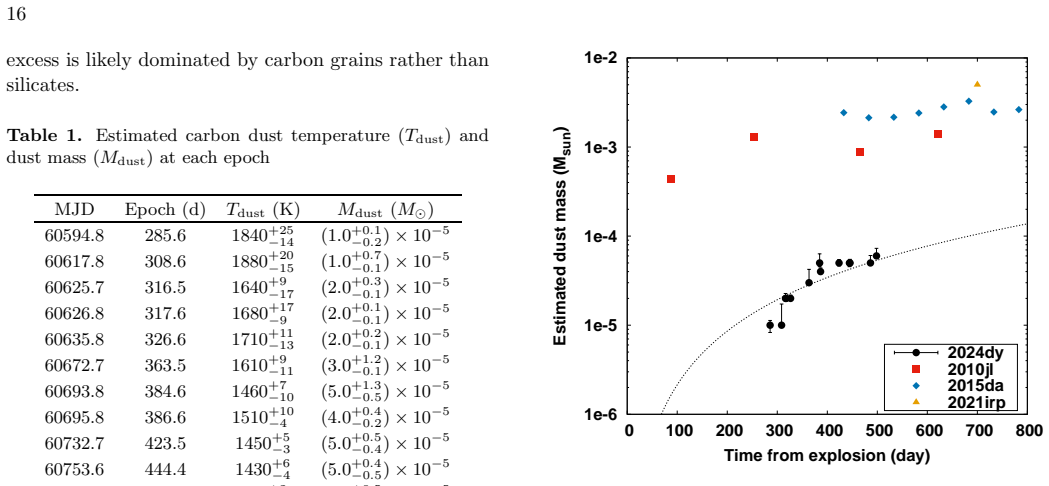
SN 2024dy exhibits a NIR excess at late phases that is modeled as carbon dust with temperatures of 1300-1800 K and masses of about 10^{-5} M_⊙. The late time Hα profile shows strong suppression of the red wing, providing evidence for newly formed dust. The results indicate that the derived dust mass may be underestimated due to optical depth effects.
What carries the argument
Spectral energy distribution modeling of the NIR excess combined with the asymmetric late-time Hα line profile.
If this is right
- Long-lived Type IIn supernovae can form detectable carbon dust at late times through interaction with dense circumstellar material.
- The reported dust mass of 10^{-5} M_⊙ constitutes a lower limit when optical-depth effects are taken into account.
- Dust formation in such events contributes to the total dust budget from core-collapse supernovae.
- The combination of NIR excess and Hα asymmetry can serve as a diagnostic for ongoing dust production in interacting supernovae.
Where Pith is reading between the lines
- If optical-depth corrections raise the dust mass, these events could supply a larger fraction of interstellar dust than currently modeled.
- Repeated late-time spectroscopy of other bright Type IIn supernovae may show the same Hα asymmetry as a common signature.
- Mid-infrared follow-up observations could directly measure the total dust mass and test the temperature range derived from NIR data alone.
- The high radiated energy and sustained interaction imply that the circumstellar environment around the progenitor was unusually dense, favoring dust condensation.
Load-bearing premise
The NIR excess and H-alpha asymmetry are produced by newly formed dust rather than pre-existing circumstellar dust, free-free emission, or other continuum sources, and that the simple SED model accurately recovers the dust mass despite possible optical-depth effects.
What would settle it
Mid-infrared photometry showing no corresponding thermal emission or spectra lacking the red-wing suppression in Hα at epochs when the NIR excess is present would falsify the new-dust interpretation.
Figures
read the original abstract
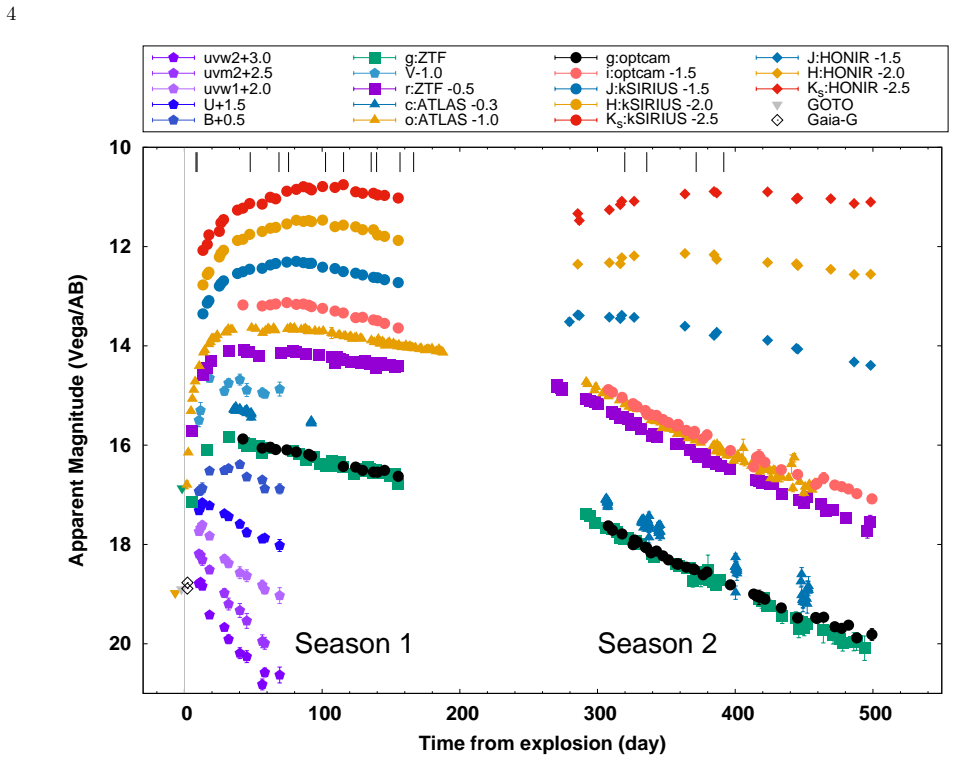
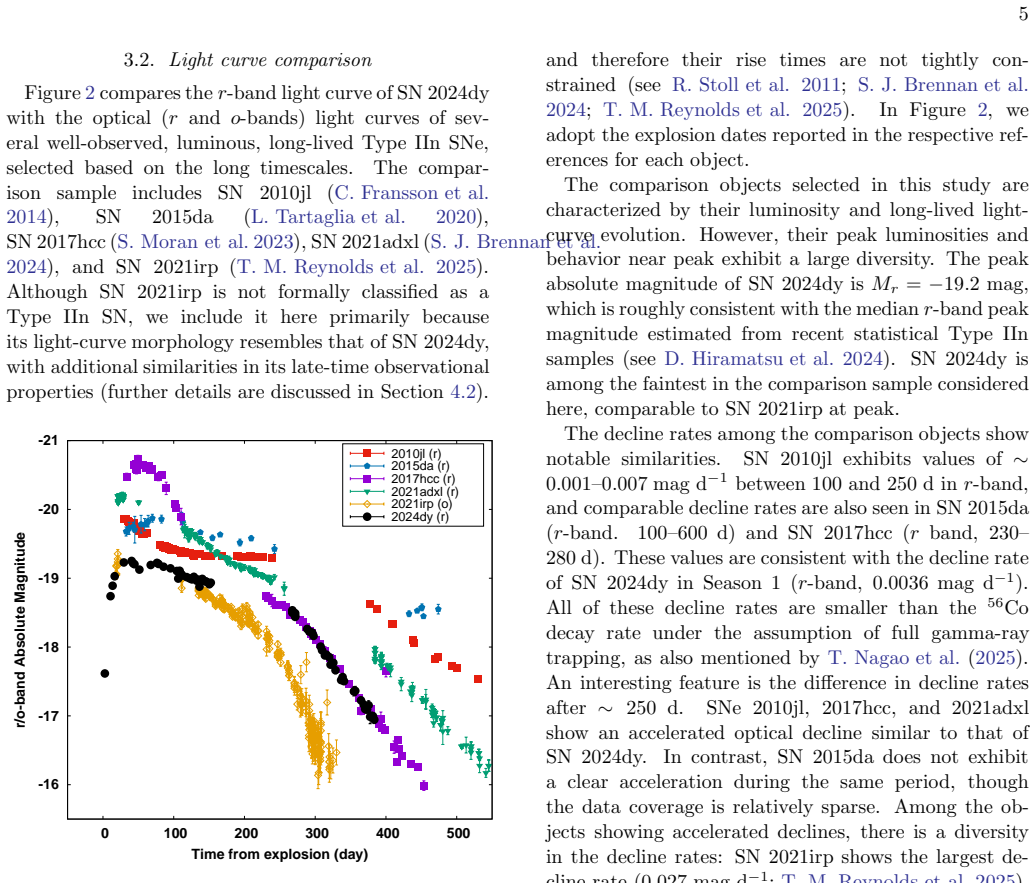
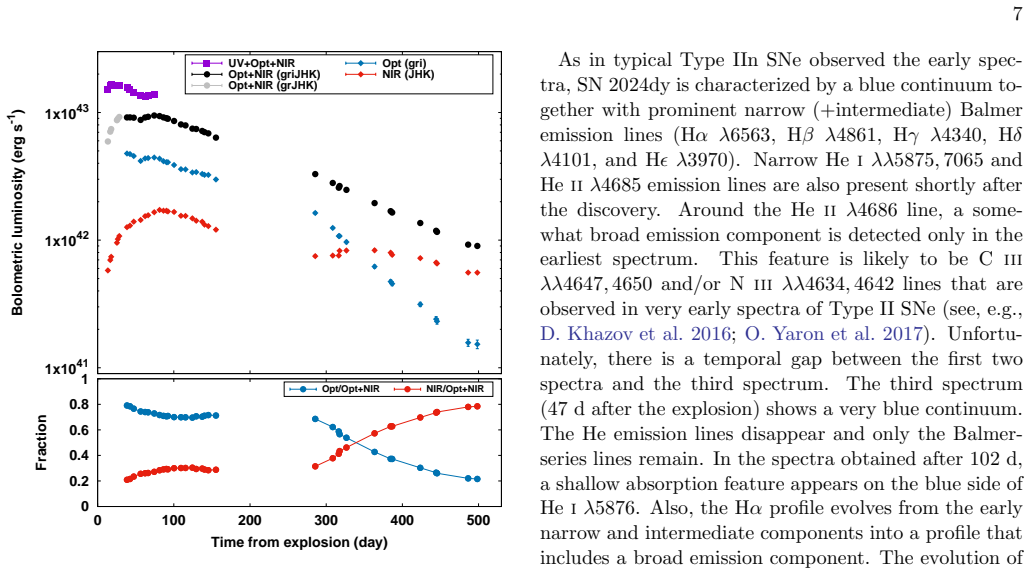
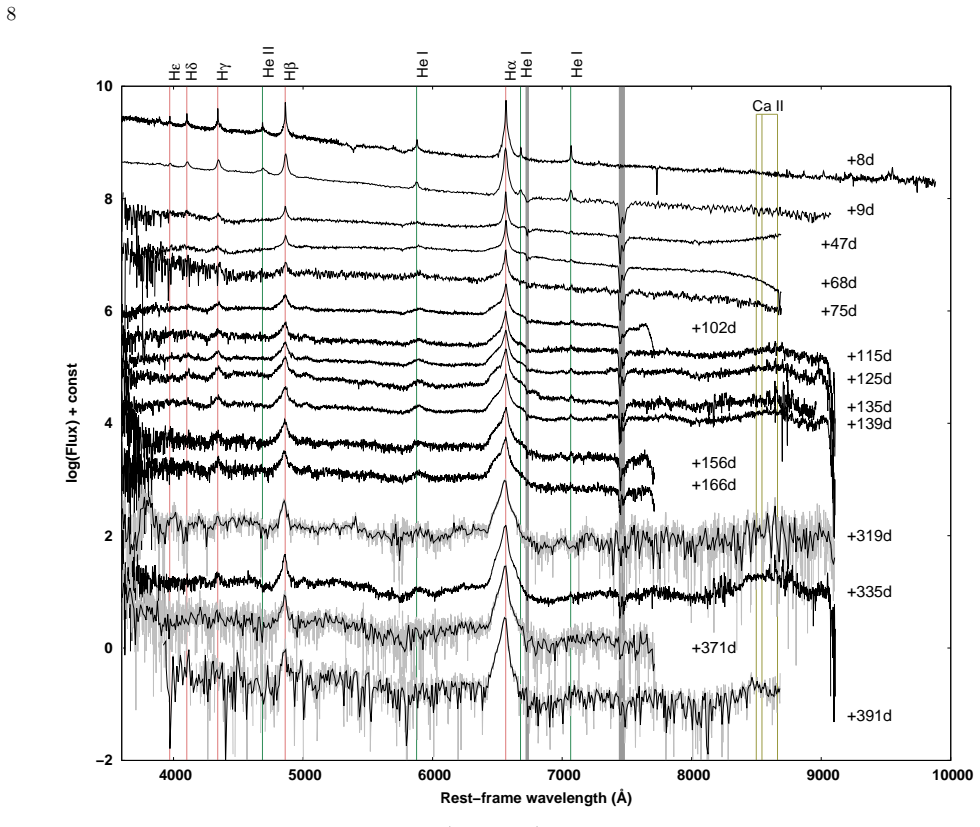
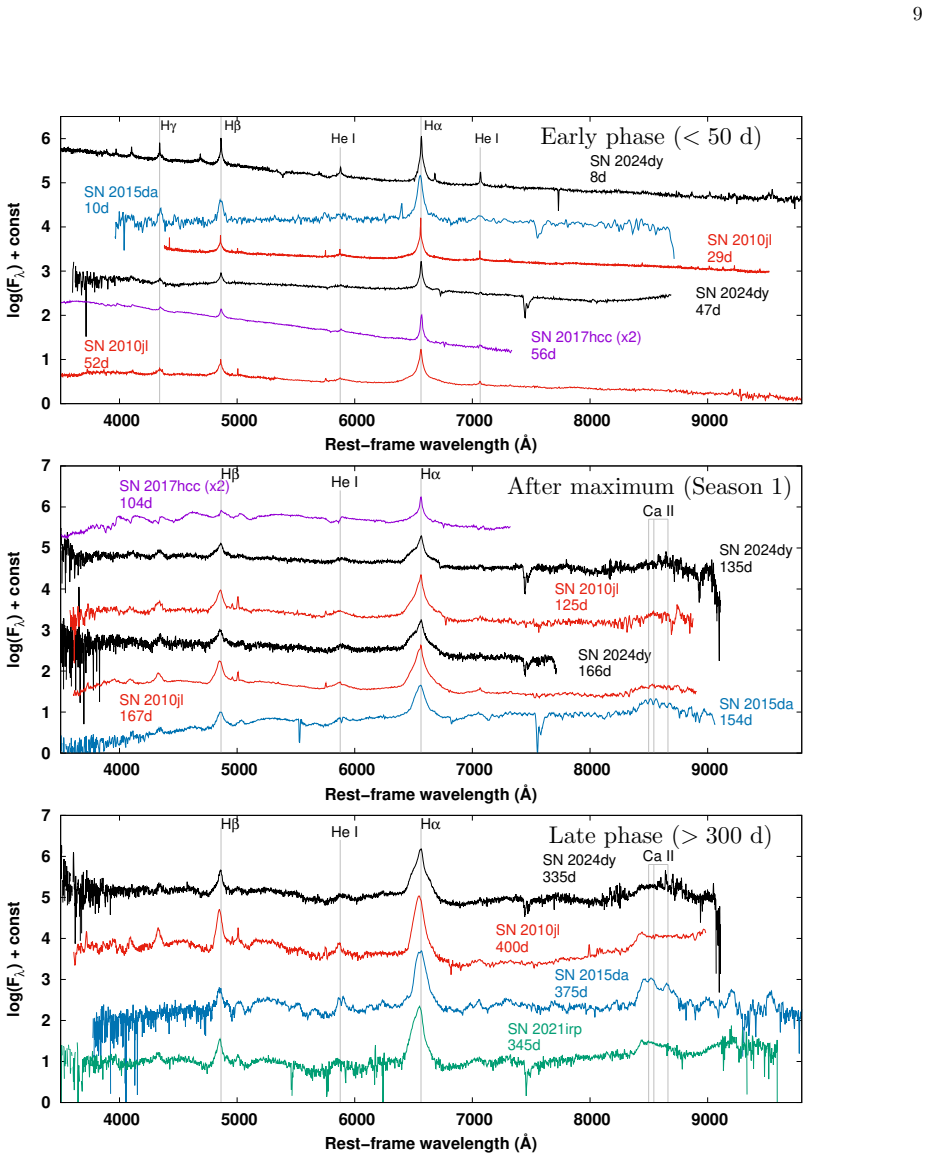
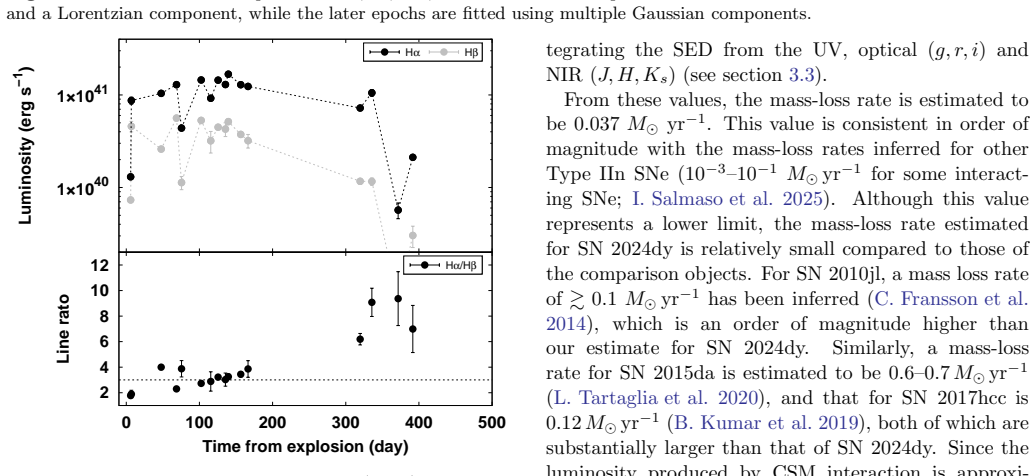
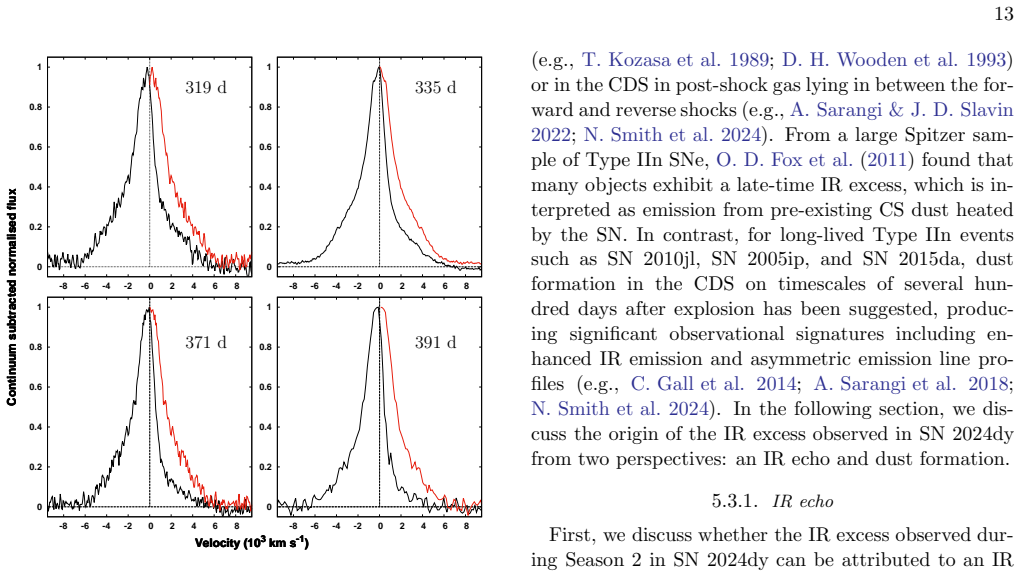
Type~IIn supernovae (SNe) are a subclass of core-collapse SNe powered by interaction between the ejecta and the dense circumstellar material. Among them, long-lived Type~IIn events are characterized by luminous, long-duration light curves with high radiative energy. Several cases of long-lived type IIn SNe exhibit substantial dust emission at late times. However, well-observed examples remain limited, and the details of their dust formation mechanisms remain poorly understood. Here we present photometric and spectroscopic observations of the Type~IIn SN~2024dy in ultraviolet, optical, and near-infrared (NIR) wavelength for $500$ days. SN~2024dy reached a peak magnitude of $M_r=-19.2$~mag with a total radiation energy of $1.9\times10^{50}$~erg. A NIR excess emerged at late phases, and the spectral energy distribution modeling indicates the presence of carbon dust with temperatures of $1300$-$1800$~K and masses of about $10^{-5}\ M_\odot$. The spectra features were typical of long-lived Type~IIn SNe. The late time H$\alpha$ profile exhibits a strong suppression of the red wing, providing evidence for newly formed dust. Our results suggest that the derived dust mass above may be underestimated due to optical depth effects. SN~2024dy provides an important observational case for understanding dust formation in Type~IIn SNe.
Editorial analysis
A structured set of objections, weighed in public.
Referee Report
Summary. The manuscript presents UV/optical/NIR photometry and spectroscopy of the long-lived Type IIn supernova SN 2024dy spanning 500 days post-explosion. It reports a peak Mr = -19.2 mag, total radiated energy of 1.9 × 10^50 erg, emergence of a late-time NIR excess, and SED modeling that attributes this excess to carbon dust at 1300–1800 K with mass ~10^{-5} M_⊙. The late-time Hα line profile is cited as showing red-wing suppression, interpreted as evidence for newly formed dust; the authors note that the derived mass may be underestimated owing to optical-depth effects.
Significance. If the attribution of the NIR excess to newly formed dust is robust, the work adds a well-observed case to the limited sample of dust-producing long-lived Type IIn events and supplies a quantitative dust-mass constraint in a dense-CSM environment. The data reduction and basic light-curve properties appear standard; however, the quantitative dust-mass result rests on a simple SED fit whose uncertainties and alternative interpretations are not fully explored in the provided text.
major comments (2)
- [Abstract] Abstract (SED modeling paragraph): the claim of carbon dust with T = 1300–1800 K and M_d ≈ 10^{-5} M_⊙ is presented without reported χ² values, parameter uncertainties, or explicit comparison to alternative continuum sources (free-free emission, pre-existing CSM dust). This is load-bearing because the manuscript itself flags possible optical-depth underestimation and the skeptic note identifies the lack of discrimination from pre-existing dust as the weakest assumption.
- [Late-time spectra] Hα profile discussion (late-time spectra section): the red-wing suppression is offered as supporting evidence for new dust, yet no quantitative radiative-transfer or geometric models are described to test whether the asymmetry could arise from ejecta geometry or scattering independent of dust. This directly affects the central claim that the NIR excess traces newly formed dust.
minor comments (1)
- [Abstract] Notation: the abstract uses “Type~IIn” (likely a non-breaking-space artifact); ensure consistent supernova subclass notation throughout the text and figures.
Simulated Author's Rebuttal
We thank the referee for the constructive report and the opportunity to clarify our analysis. We address each major comment below and have revised the manuscript accordingly to strengthen the presentation of the SED results and the supporting evidence for dust formation.
read point-by-point responses
-
Referee: [Abstract] Abstract (SED modeling paragraph): the claim of carbon dust with T = 1300–1800 K and M_d ≈ 10^{-5} M_⊙ is presented without reported χ² values, parameter uncertainties, or explicit comparison to alternative continuum sources (free-free emission, pre-existing CSM dust). This is load-bearing because the manuscript itself flags possible optical-depth underestimation and the skeptic note identifies the lack of discrimination from pre-existing dust as the weakest assumption.
Authors: We agree that the SED modeling section and abstract require additional quantitative details. In the revised manuscript we will report the χ² values of the fits, include formal uncertainties on temperature and dust mass derived from the modeling, and add an explicit comparison to alternative sources. Free-free emission is disfavored by the observed spectral shape and flux levels at the relevant epochs, while the high temperatures (1300–1800 K) are inconsistent with typical pre-existing CSM dust; we will expand this discussion and retain the caveat on possible optical-depth underestimation. revision: yes
-
Referee: [Late-time spectra] Hα profile discussion (late-time spectra section): the red-wing suppression is offered as supporting evidence for new dust, yet no quantitative radiative-transfer or geometric models are described to test whether the asymmetry could arise from ejecta geometry or scattering independent of dust. This directly affects the central claim that the NIR excess traces newly formed dust.
Authors: The red-wing suppression is presented alongside the contemporaneous NIR excess, which together favor newly formed dust over purely geometric effects. We acknowledge that the manuscript does not include quantitative radiative-transfer or geometric modeling. In revision we will expand the late-time spectra section to discuss alternative interpretations (asymmetric ejecta, scattering) and note that full RT calculations lie beyond the scope of this observational study; the combined photometric and spectroscopic evidence remains the primary support for the dust interpretation. revision: partial
Circularity Check
No circularity: dust parameters obtained via direct observational fitting
full rationale
The paper's central results (carbon dust T=1300-1800 K, M_d~10^{-5} M_⊙) come from standard SED modeling fitted to the observed NIR photometry and spectra, with the Hα red-wing suppression presented as independent supporting evidence. No derivation chain reduces by construction to fitted inputs, no self-citations are invoked as load-bearing uniqueness theorems, and no ansatz or renaming of known results is used. The derivation is self-contained against the external photometric and spectroscopic data.
Axiom & Free-Parameter Ledger
free parameters (2)
- dust temperature =
1300-1800 K
- dust mass =
~10^{-5} M_⊙
axioms (2)
- domain assumption NIR excess originates from thermal emission of newly condensed dust grains rather than other continuum processes
- domain assumption Standard dust opacity and emissivity laws for carbon grains apply at the derived temperatures
Reference graph
Works this paper leans on
-
[1]
2014, in Society of Photo-Optical Instrumentation Engineers (SPIE) Conference Series, Vol
Akitaya, H., Moritani, Y., Ui, T., et al. 2014, in Society of Photo-Optical Instrumentation Engineers (SPIE) Conference Series, Vol. 9147, Ground-based and Airborne Instrumentation for Astronomy V, ed. S. K. Ramsay, I. S. McLean, & H. Takami, 91474O, doi: 10.1117/12.2054577
-
[2]
Bellm, E. C., Kulkarni, S. R., Graham, M. J., et al. 2019, PASP, 131, 018002, doi: 10.1088/1538-3873/aaecbe 20
-
[3]
Bevan, A., Wesson, R., Barlow, M. J., et al. 2019, MNRAS, 485, 5192, doi: 10.1093/mnras/stz679
-
[4]
J., Schulze, S., Lunnan, R., et al
Brennan, S. J., Schulze, S., Lunnan, R., et al. 2024, A&A, 690, A259, doi: 10.1051/0004-6361/202349036
-
[5]
Cardelli, J. A., Clayton, G. C., & Mathis, J. S. 1989, ApJ, 345, 245, doi: 10.1086/167900
-
[6]
Chambers, K. C., Magnier, E. A., Metcalfe, N., et al. 2016, arXiv e-prints, arXiv:1612.05560, doi: 10.48550/arXiv.1612.05560
work page internal anchor Pith review Pith/arXiv arXiv doi:10.48550/arxiv.1612.05560 2016
-
[7]
Chugai, N. N. 2018, MNRAS, 481, 3643, doi: 10.1093/mnras/sty2386
-
[8]
Chugai, N. N., & Danziger, I. J. 1994, MNRAS, 268, 173, doi: 10.1093/mnras/268.1.173
-
[9]
2025, A&A, 698, A293, doi: 10.1051/0004-6361/202555161
Dessart, L., John Hillier, D., & Sarangi, A. 2025, A&A, 698, A293, doi: 10.1051/0004-6361/202555161
-
[10]
Draine, B. T. 1985, ApJS, 57, 587, doi: 10.1086/191016
-
[11]
1985, ApJ, 297, 719, doi: 10.1086/163571
Dwek, E. 1985, ApJ, 297, 719, doi: 10.1086/163571
-
[12]
Dwek, E., Sarangi, A., & Arendt, R. G. 2019, ApJL, 871, L33, doi: 10.3847/2041-8213/aaf9a8
-
[13]
Filippenko, A. V. 1997, ARA&A, 35, 309, doi: 10.1146/annurev.astro.35.1.309 F¨ orster, F., Cabrera-Vives, G., Castillo-Navarrete, E., et al. 2021, AJ, 161, 242, doi: 10.3847/1538-3881/abe9bc
-
[14]
Fox, O., Skrutskie, M. F., Chevalier, R. A., et al. 2009, ApJ, 691, 650, doi: 10.1088/0004-637X/691/1/650
-
[15]
Fox, O. D., Chevalier, R. A., Skrutskie, M. F., et al. 2011, ApJ, 741, 7, doi: 10.1088/0004-637X/741/1/7
-
[16]
Fransson, C., Ergon, M., Challis, P. J., et al. 2014, ApJ, 797, 118, doi: 10.1088/0004-637X/797/2/118
-
[17]
2020, Royal Society Open Science, 7, 200467, doi: 10.1098/rsos.200467
Fraser, M. 2020, Royal Society Open Science, 7, 200467, doi: 10.1098/rsos.200467
-
[18]
2014, Nature, 511, 326, doi: 10.1038/nature13558
Gall, C., Hjorth, J., Watson, D., et al. 2014, Nature, 511, 326, doi: 10.1038/nature13558
-
[19]
Heinze, A. N., Tonry, J. L., Denneau, L., et al. 2018, AJ, 156, 241, doi: 10.3847/1538-3881/aae47f
-
[20]
2024, arXiv e-prints, arXiv:2411.07287, doi: 10.48550/arXiv.2411.07287 Ivezi´ c,ˇZ., Kahn, S
Hiramatsu, D., Berger, E., Gomez, S., et al. 2024, arXiv e-prints, arXiv:2411.07287, doi: 10.48550/arXiv.2411.07287 Ivezi´ c,ˇZ., Kahn, S. M., Tyson, J. A., et al. 2019, ApJ, 873, 111, doi: 10.3847/1538-4357/ab042c Jacobson-Gal´ an, W. V., Dessart, L., Kilpatrick, C. D., et a l. 2025, ApJL, 994, L14, doi: 10.3847/2041-8213/ae157a
-
[21]
S., Ikeda, Y., Akitaya, H., et al
Kawabata, K. S., Ikeda, Y., Akitaya, H., et al. 2007, AJ, 134, 1877, doi: 10.1086/522629
-
[22]
2016, ApJ, 818, 3, doi: 10.3847/0004-637X/818/1/3
Khazov, D., Yaron, O., Gal-Yam, A., et al. 2016, ApJ, 818, 3, doi: 10.3847/0004-637X/818/1/3
-
[23]
2012, ApJ, 744, 10, doi: 10.1088/0004-637X/744/1/10
Kiewe, M., Gal-Yam, A., Arcavi, I., et al. 2012, ApJ, 744, 10, doi: 10.1088/0004-637X/744/1/10
-
[24]
Kozasa, T., Hasegawa, H., & Nomoto, K. 1989, ApJ, 344, 325, doi: 10.1086/167801
-
[25]
2019, MNRAS, 488, 3089, doi: 10.1093/mnras/stz1914
Kumar, B., Eswaraiah, C., Singh, A., et al. 2019, MNRAS, 488, 3089, doi: 10.1093/mnras/stz1914
-
[26]
Mattila, S., Meikle, W. P. S., Lundqvist, P., et al. 2008, MNRAS, 389, 141, doi: 10.1111/j.1365-2966.2008.13516.x
-
[27]
2023, A&A, 669, A51, doi: 10.1051/0004-6361/202244565
Moran, S., Fraser, M., Kotak, R., et al. 2023, A&A, 669, A51, doi: 10.1051/0004-6361/202244565
-
[28]
J., Maeda, K., Taddia, F., et al
Moriya, T. J., Maeda, K., Taddia, F., et al. 2013, MNRAS, 435, 1520, doi: 10.1093/mnras/stt1392
-
[29]
Moriya, T. J., Stritzinger, M. D., Taddia, F., et al. 2020, A&A, 641, A148, doi: 10.1051/0004-6361/202038118
-
[30]
Nagao, T., Reynolds, T. M., Kuncarayakti, H., et al. 2025, A&A, 699, A283, doi: 10.1051/0004-6361/202554988
-
[31]
2024, in Society of Photo-Optical Instrumentation Engineers (SPIE) Conference Series, Vol
Nagayama, T., & Nakaya, H. 2024, in Society of Photo-Optical Instrumentation Engineers (SPIE) Conference Series, Vol. 13096, Ground-based and Airborne Instrumentation for Astronomy X, ed. J. J
2024
-
[32]
Bryant, K. Motohara, & J. R. D. Vernet, 130963I, doi: 10.1117/12.3016593
-
[33]
2020, A&A, 637, A73, doi: 10.1051/0004-6361/201936097
Nyholm, A., Sollerman, J., Tartaglia, L., et al. 2020, A&A, 637, A73, doi: 10.1051/0004-6361/201936097
-
[34]
O., Arcavi, I., Tal, D., et al
Ofek, E. O., Arcavi, I., Tal, D., et al. 2014, ApJ, 788, 154, doi: 10.1088/0004-637X/788/2/154
-
[35]
E., & Ferland, G
Osterbrock, D. E., & Ferland, G. J. 2006, Astrophysics of gaseous nebulae and active galactic nuclei
2006
-
[36]
2011, A&A, 527, L6, doi: 10.1051/0004-6361/201016217
Harutyunyan, A. 2011, A&A, 527, L6, doi: 10.1051/0004-6361/201016217
-
[37]
M., Nagao, T., Gottumukkala, R., et al
Reynolds, T. M., Nagao, T., Gottumukkala, R., et al. 2025, arXiv e-prints, arXiv:2501.13619, doi: 10.48550/arXiv.2501.13619
-
[38]
Roming, P. W. A., Kennedy, T. E., Mason, K. O., et al. 2005, SSRv, 120, 95, doi: 10.1007/s11214-005-5095-4
work page internal anchor Pith review doi:10.1007/s11214-005-5095-4 2005
-
[39]
Rouleau, F., & Martin, P. G. 1991, ApJ, 377, 526, doi: 10.1086/170382
-
[40]
2025, A&A , 695, A29, doi: 10.1051/0004-6361/202451764
Salmaso, I., Cappellaro, E., Tartaglia, L., et al. 2025, A&A , 695, A29, doi: 10.1051/0004-6361/202451764
-
[41]
Sarangi, A., Dwek, E., & Arendt, R. G. 2018, ApJ, 859, 66, doi: 10.3847/1538-4357/aabfc3
-
[42]
Sarangi, A., & Slavin, J. D. 2022, ApJ, 933, 89, doi: 10.3847/1538-4357/ac713d Schlafly, E. F., & Finkbeiner, D. P. 2011, ApJ, 737, 103, doi: 10.1088/0004-637X/737/2/103
-
[43]
Schlegel, E. M. 1990, MNRAS, 244, 269
1990
-
[44]
Shahbandeh, M., Fox, O. D., Temim, T., et al. 2025, ApJ, 985, 262, doi: 10.3847/1538-4357/adce77
-
[45]
Siegel, M. H., Porterfield, B. L., Linevsky, J. S., et al. 2014 , AJ, 148, 131, doi: 10.1088/0004-6256/148/6/131
-
[46]
Skrutskie, M. F., Cutri, R. M., Stiening, R., et al. 2006, AJ, 131, 1163, doi: 10.1086/498708 21
-
[47]
Smith, K. W., Smartt, S. J., Young, D. R., et al. 2020, PASP, 132, 085002, doi: 10.1088/1538-3873/ab936e
-
[48]
2017, in Handbook of Supernovae, ed
Smith, N. 2017, in Handbook of Supernovae, ed. A. W. Alsabti & P. Murdin, 403, doi: 10.1007/978-3-319-21846-5 38
-
[49]
Smith, N., Andrews, J. E., Milne, P., et al. 2024, MNRAS, 530, 405, doi: 10.1093/mnras/stae726
-
[50]
Smith, N., Silverman, J. M., Filippenko, A. V., et al. 2012, AJ, 143, 17, doi: 10.1088/0004-6256/143/1/17
-
[51]
Smith, N., Silverman, J. M., Chornock, R., et al. 2009, ApJ, 695, 1334, doi: 10.1088/0004-637X/695/2/1334
-
[52]
Stetson, P. B. 1987, PASP, 99, 191, doi: 10.1086/131977
-
[53]
Stoll, R., Prieto, J. L., Stanek, K. Z., et al. 2011, ApJ, 730, 34, doi: 10.1088/0004-637X/730/1/34
-
[54]
Suzuki, A., Moriya, T. J., & Takiwaki, T. 2019, ApJ, 887, 249, doi: 10.3847/1538-4357/ab5a83
-
[55]
Szalai, T., Fox, O. D., Arendt, R. G., et al. 2021, ApJ, 919, 17, doi: 10.3847/1538-4357/ac0e2b
-
[56]
2020, A&A, 635, A39, doi: 10.1051/0004-6361/201936553
Tartaglia, L., Pastorello, A., Sollerman, J., et al. 2020, A&A, 635, A39, doi: 10.1051/0004-6361/201936553
-
[57]
Tinyanont, S., Kasliwal, M. M., Krafton, K., et al. 2019, ApJ, 873, 127, doi: 10.3847/1538-4357/ab0897
-
[58]
2024, Transient Name Server Discovery Report, 2024-17, 1
Tonry, J., Denneau, L., Weiland, H., et al. 2024, Transient Name Server Discovery Report, 2024-17, 1
2024
-
[59]
Tonry, J. L., Denneau, L., Heinze, A. N., et al. 2018, PASP, 130, 064505, doi: 10.1088/1538-3873/aabadf
work page internal anchor Pith review doi:10.1088/1538-3873/aabadf 2018
-
[60]
Wise, J., Hinds, K., Perley, D., Bochenek, O., & Rich, R. M. 2024, Transient Name Server Classification Report, 2024-82, 1
2024
-
[61]
Wooden, D. H., Rank, D. M., Bregman, J. D., et al. 1993, ApJS, 88, 477, doi: 10.1086/191830
-
[62]
Yaron, O., Perley, D. A., Gal-Yam, A., et al. 2017, Nature Physics, 13, 510, doi: 10.1038/nphys4025
discussion (0)
Sign in with ORCID, Apple, or X to comment. Anyone can read and Pith papers without signing in.