REVIEW 2 minor 37 references
Dimension reduction of multivariate densities in Bayes spaces
T0 review · 0 major / 2 minor · reviewed 2026-06-26 · grok-4.3
Pith's one-line read Multivariate densities in Bayes space decompose orthogonally into independent geometric marginals and an interactive component, making FPCA equivalent to separate multivariate analyses on the parts.
desk verdict The paper extends Bayes-space FPCA to multivariate densities by proving equivalence between direct and decomposed FPCA plus PCA-optimality of the independent-interactive variance split. read the letter →
The pith
A machine-rendered reading of the paper's core claim, the machinery that carries it, and where it could break.
The reading
What carries the argument
The orthogonal decomposition of multivariate densities into independent geometric marginals and interactive component, enabled by the centred logratio (clr) transformation that gives an isometric isomorphism to an L² subspace.
What would settle it
If the eigenfunctions and scores from direct FPCA on multivariate densities fail to match the decomposed versions up to the claimed additive structure, or if the variance explained by the parts is not maximal among all orthogonal splits, the optimality and equivalence would not hold.
Extended reading notes
Core claim
Embedding multivariate PDFs in the Bayes space enables an orthogonal decomposition into independent and interactive components, with the independent part further split into mutually orthogonal geometric marginals. The centred logratio transformation maps this structure isometrically to a subspace of L², so functional principal component analysis applies directly. The resulting variance decomposition is optimal in the PCA sense, and applying FPCA to the original densities is equivalent to multivariate FPCA on the decomposed form, with eigenfunctions and scores decomposing accordingly.
Load-bearing premise
The centred logratio transformation establishes an isometric isomorphism between the Bayes space and a subspace of L² space.
Editorial extensions
If this is right
- The decomposition of total variance is optimal in a PCA sense, so eigenfunctions and scores from FPCA have a direct interpretation in terms of independent and interactive contributions.
- FPCA applied directly to multivariate densities produces results equivalent to multivariate FPCA performed on the decomposed independent and interactive parts.
- Eigenfunctions and scores obtained from the full densities decompose additively according to the independent and interactive split.
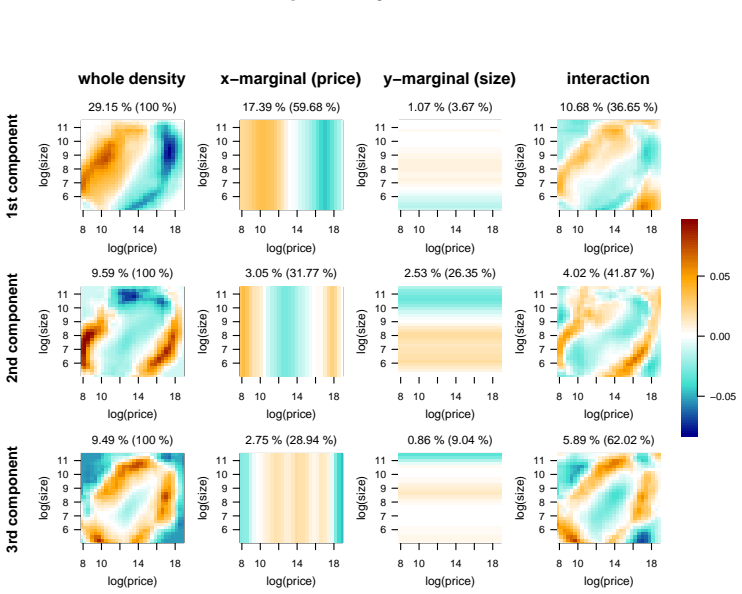
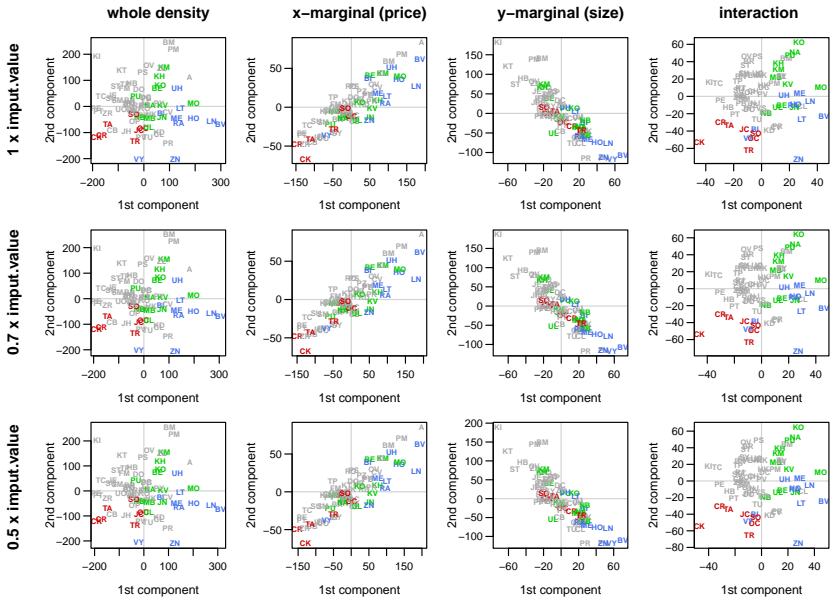
- The decomposition applied to empirical housing and geological data yields interpretable components that separate sources of variation.
Reading between the lines
- The same orthogonal split could be used with other functional data techniques such as functional regression or clustering on density data.
- Fields that routinely work with joint distributions, such as compositional data or spatial statistics, might adopt the geometric marginals as a standard way to separate marginal and dependence effects.
- Simulated examples with known independent and dependence structures could be used to check whether the PCA optimality holds numerically beyond the theoretical proof.
Editorial analysis
A structured set of objections, weighed in public.
Referee Report
Summary. The manuscript develops dimension reduction techniques for multivariate probability density functions within the Bayes space framework. It utilizes the centred logratio (clr) transformation to establish an isometric isomorphism with a subspace of L², allowing the application of functional principal component analysis (FPCA). The key contributions include an orthogonal decomposition of multivariate densities into independent and interactive components, with the independent part further decomposed into orthogonal geometric marginals. The paper proves that this variance decomposition is optimal in a PCA sense and demonstrates the equivalence of applying FPCA directly to the densities versus to their decomposed form, with corresponding decomposition of eigenfunctions and scores. The theoretical results are illustrated with applications to housing and geological data.
Significance. If the results hold, this provides a significant advancement in the analysis of multivariate density data by offering a structured way to decompose and interpret variance sources. The reliance on the standard clr isometry ensures the framework is built on solid Hilbert space foundations, and the optimality and equivalence results could influence how FPCA is applied and interpreted in compositional data analysis. The empirical applications demonstrate practical utility. The use of an established isometric isomorphism and the focus on reproducible theoretical structure are strengths.
minor comments (2)
- Abstract: the phrase 'equivalent in a certain sense' is imprecise; a brief clarification of the precise sense of equivalence (e.g., with respect to the inner product or the resulting scores) would improve readability without altering the claim.
- The manuscript would benefit from an explicit statement early in the introduction of how the geometric marginals are defined and why they are mutually orthogonal under the Bayes-space inner product.
Simulated Author's Rebuttal
We thank the referee for the positive summary, significance assessment, and recommendation of minor revision. No major comments were listed in the report.
Circularity Check
No significant circularity; derivation self-contained via standard clr isometry
full rationale
The paper's central results—the PCA-optimality of the independent/interactive variance decomposition and the equivalence between direct and decomposed FPCA—follow from the isometric isomorphism property of the clr transformation, which is invoked as an established fact from the Bayes-space literature rather than derived or fitted within the manuscript. No equation reduces a claimed prediction to a self-defined quantity, no load-bearing uniqueness theorem is imported from the authors' own prior work, and the decomposition is presented as a direct consequence of the Hilbert-space inner product supplied by clr. The framework therefore contains no self-referential steps that collapse the claimed results to their inputs by construction.
Assumptions & free parameters
assumptions (1)
- domain assumption The centred logratio (clr) transformation establishes an isometric isomorphism between the Bayes space and a subspace of L² space.
Cite this review
Pith. "Pith review of Dimension reduction of multivariate densities in Bayes spaces." pith.science (2026). https://pith.science/paper/KMLSM236
@misc{pith2026260619011,
  author       = {Pith},
  title        = {Pith review of: Dimension reduction of multivariate densities in Bayes spaces},
  year         = {2026},
  howpublished = {\url{https://pith.science/paper/KMLSM236}},
  note         = {Machine review of arXiv:2606.19011}
}
abstract
The Bayes space provides a Hilbert space structure for analysing probability density functions (PDFs), equipping them with a geometry that reflects their relative and constrained nature. A key tool in this framework is the centred logratio (clr) transformation, which establishes an isometric isomorphism between the Bayes space and (a subspace of) the classical $L^2$ space. This makes it possible to apply functional data analysis (FDA) techniques, particularly functional principal component analysis (FPCA), to both univariate and multivariate density data in the context of dimension reduction. For multivariate PDFs, embedding them in the Bayes space enables an orthogonal decomposition into independent and interactive components. Furthermore, the independent part can be decomposed into mutually orthogonal geometric marginals. This structure provides more profound insights into the sources of variation in multivariate densities. We show that this decomposition of the total variance is optimal in a PCA sense, impacting the interpretation of the eigenfunctions and scores resulting from FPCA. We demonstrate that applying FPCA directly to multivariate densities is equivalent in a certain sense to applying multivariate FPCA to their decomposed form, with the resulting eigenfunctions and scores decomposing accordingly. The unique decomposition based on these theoretical results is applied to housing and geological empirical data respectively, demonstrating the interpretability and practical value of this approach.
Figures


Figures from the paper (23 more)






Reference graph
Works this paper leans on
-
[1]
K. G. van den Boogaart, J. J. Egozcue, V . Pawlowsky-Glahn, Bayes Hilbert spaces, Australian & New Zealand Journal of Statistics 56 (2014) 171–194
2014
-
[2]
K. G. van den Boogaart, R. Tolosana-Delgado, Multivariate Bayes Spaces and Compositions, in: C. Thomas- Agnan, V . Pawlowsky-Glahn (Eds.), Proceedings of the 9th International Workshop on Compositional Data Analysis (CoDaWork 2022), CoDa Association, Toulouse, 2022
2022
-
[3]
Delicado, Dimensionality reduction when data are density functions, Computational Statistics & Data Analysis 55 (2011) 401–420
P. Delicado, Dimensionality reduction when data are density functions, Computational Statistics & Data Analysis 55 (2011) 401–420
2011
-
[4]
Eckardt, J
M. Eckardt, J. Mateu, S. Greven, Generalized functional additive mixed models with (functional) compositional covariates for areal Covid-19 incidence curves, Journal of the Royal Statistical Society Series C: Applied Statis- tics 73 (2024) 880–901
2024
-
[5]
J. J. Egozcue, J. L. Díaz-Barrero, V . Pawlowsky-Glahn, Hilbert space of probability density functions based on Aitchison geometry, Acta Mathematica Sinica 22 (2006) 1175–1182
2006
-
[6]
Filzmoser, K
P. Filzmoser, K. Hron, A. Menafoglio, Logratio approach to distributional modeling, in: A. Daouia, A. Ruiz- Gazen (Eds.), Advances in Contemporary Statistics and Econometrics: Festschrift in Honor of Christine Thomas–Agnan, Springer International Publishing, Cham, 2021, pp. 451–470
2021
-
[7]
Genest, K
C. Genest, K. Hron, J. G. Nešlehová, Orthogonal decomposition of multivariate densities in Bayes spaces and relation with their copula–based representation, Journal of Multivariate Analysis 198 (2023) 105228
2023
-
[8]
C. Happ, S. Greven, Multivariate functional principal component analysis for data observed on different (dimen- sional) domains, Journal of the American Statistical Association 113 (2018) 649–659
2018
Show all 37 references
-
[9]
K. Hron, J. Machalová, A. Menafoglio, Bivariate densities in Bayes spaces: orthogonal decomposition and spline representation, Statistical Papers 64 (2023) 1629–1667
2023
-
[10]
K. Hron, A. Menafoglio, M. Templ, K. Hr˚ uzová, P. Filzmoser, Simplical principal component analysis for density functions in Bayes spaces, Computational Statistics and Data Analysis 94 (2016) 330–350. 28
2016
-
[11]
Johnson, D
R. Johnson, D. Wichern, Applied Multivariate Statistical Analysis, Prentice Hall, Upper Saddle River, 6th edi- tion, 2007
2007
-
[12]
Kneip, K
A. Kneip, K. J. Utikal, Inference for density families using functional principal component analysis, Journal of the American Statistical Association 96 (2001) 519–542
2001
-
[13]
Kokoszka, M
P. Kokoszka, M. Reimherr, Introduction to Functional Data Analysis, CRC Press, Boca Raton, 2017
2017
-
[14]
Kutta, A
T. Kutta, A. Jach, M. Haddad, P. Kokoszka, H. Wang, Detection and localization of changes in a panel of densities, Journal of Multivariate Analysis 205 (2025) 105374
2025
-
[15]
X. Lei, Z. Chen, H. Li, Functional outlier detection for density-valued data with application to robustify distribution-to-distribution regression, Technometrics 65 (2023) 351–362
2023
-
[16]
Y . Ma, X. Zhou, W. Wu, A stochastic process representation for time warping functions, Computational Statistics and Data Analysis 194 (2024) 107941
2024
-
[17]
Maier, A
E.-M. Maier, A. Fottner, S. Greven, A. Stöcker, Additive density regression, 2025
2025
-
[18]
Maier, A
E.-M. Maier, A. Stöcker, B. Fitzenberger, S. Greven, Additive density-on-scalar regression in Bayes Hilbert spaces with an application to gender economics, Annals of Applied Statistics 19 (2025) 680–700
2025
-
[19]
Matys Grygar, U
T. Matys Grygar, U. Radoji ˇci´c, I. Pavl˚ u, S. Greven, J. Nešlehová, Š. T˚ umová, K. Hron, Exploratory functional data analysis of multivariate densities for the identification of agricultural soil contamination by risk elements, Journal of Geochemical Exploration 259 (2024) 107416
2024
-
[20]
Menafoglio, M
A. Menafoglio, M. Grasso, P. Secchi, B. Colosimo, Monitoring of probability density functions via simplicial functional pca with application to image data, Technometrics 60 (2018) 497–510
2018
-
[21]
Menafoglio, M
A. Menafoglio, M. Grasso, P. Secchi, B. M. Colosimo, A class-kriging predictor for functional compositions with application to particle-size curves in heterogeneous aquifers, Mathematical Geosciences 48 (2016) 463– 485
2016
-
[22]
Menafoglio, A
A. Menafoglio, A. Guadagnini, P. Secchi, A kriging approach based on Aitchison geometry for the characteriza- tion of particle-size curves in heterogeneous aquifers, Stochastic Environmental Research and Risk Assessment 28 (2014) 1835–1851
2014
-
[23]
Murph, J
A. Murph, J. Strait, K. Moran, J. Hyman, P. Stauffer, Visualisation and outlier detection for probability density function ensembles, Stat 13 (2024) e662
2024
-
[24]
Pavl˚ u, J
I. Pavl˚ u, J. Machalová, R. Tolosana-Delgado, K. Hron, K. Bachmann, K. G. van den Boogaart, Principal com- ponent analysis for distributions observed by samples in bayes spaces, Mathematical Geosciences 56 (2024) 1641–1669
2024
-
[25]
Pawlowsky-Glahn, J
V . Pawlowsky-Glahn, J. J. Egozcue, R. Tolosana-Delgado, Modeling and Analysis of Compositional Data, Wi- ley, Chichester, 2015
2015
-
[26]
Petersen, C
A. Petersen, C. Zhang, P. Kokoszka, Modeling probability density functions as data objects, Econometrics and Statistics 21 (2022) 159–178
2022
-
[27]
Podlešáková, J
E. Podlešáková, J. N ˇemeˇcek, G. Halová, Proposal of soil contamination limits for persistent organic xenobiotic substances in the Czech Republic, Rostlinná výroba 42 (1996) 49–54
1996
-
[28]
Poláková, K
Š. Poláková, K. Hutarová, D. Reininger, L. Kubík, Registr kontaminovaných ploch 2 M HNO3 (1990–2009), Technical report, Ústˇrední kontrolní a zkušební ústav zemˇedˇelský v Brnˇe, Brno, Czech Republic, 2011
1990
-
[29]
J. Qiu, X. Dai, Z. Zhu, Nonparametric estimation of repeated densities with heterogeneous sample sizes, Journal of the American Statistical Association 119 (2024) 176–188. 29
2024
-
[30]
Ramsay, B
J. Ramsay, B. W. Silverman, Functional Data Analysis, Springer, New York, 2 edition, 2005. [31]RCore Team,R: A Language and Environment for Statistical Computing,RFoundation for Statistical Comput- ing, Vienna, Austria, 2025
2005
-
[31]
A. S. Sakib, USA real estate dataset, 2022. [accessed 2025-10-30]
2022
-
[32]
Škor ˇna, J
S. Škor ˇna, J. Machalová, J. Burkotová, K. Hron, S. Greven, Approximation of bivariate densities with composi- tional splines, 2024
2024
-
[33]
Steyer, S
L. Steyer, S. Greven, Principal component analysis in Bayes spaces for sparsely sampled density functions, 2023
2023
-
[34]
Talská, A
R. Talská, A. Menafoglio, K. Hron, J. J. Egozcue, J. Palarea-Albaladejo, Weighting the domain of probability densities in functional data analysis, Stat 9 (2020) e283
2020
-
[35]
Talská, A
R. Talská, A. Menafoglio, J. Machalová, K. Hron, E. Fišerová, Compositional regression with functional re- sponse, Computational Statistics & Data Analysis 123 (2018) 66–85
2018
-
[36]
H. Wang, L. Shangguan, R. Guan, L. Billard, Principal component analysis for compositional data vectors, Computational Statistics 30 (2015) 1079–1096
2015
-
[37]
Zbíral, I
J. Zbíral, I. Honsa, S. Malý, D. ˇCižmár, Soil Analysis III, Central Institute for Supervising and Testing in Agriculture, Brno, Czech Republic, 2004. 30
2004
Reviewed June 26, 2026 · model on record in the stance chip above.
Discussion (0). Continue with ORCID to comment.