Scintillation of the first-known pulsar planetary system
Pith reviewed 2026-06-26 19:52 UTC · model grok-4.3
The pith
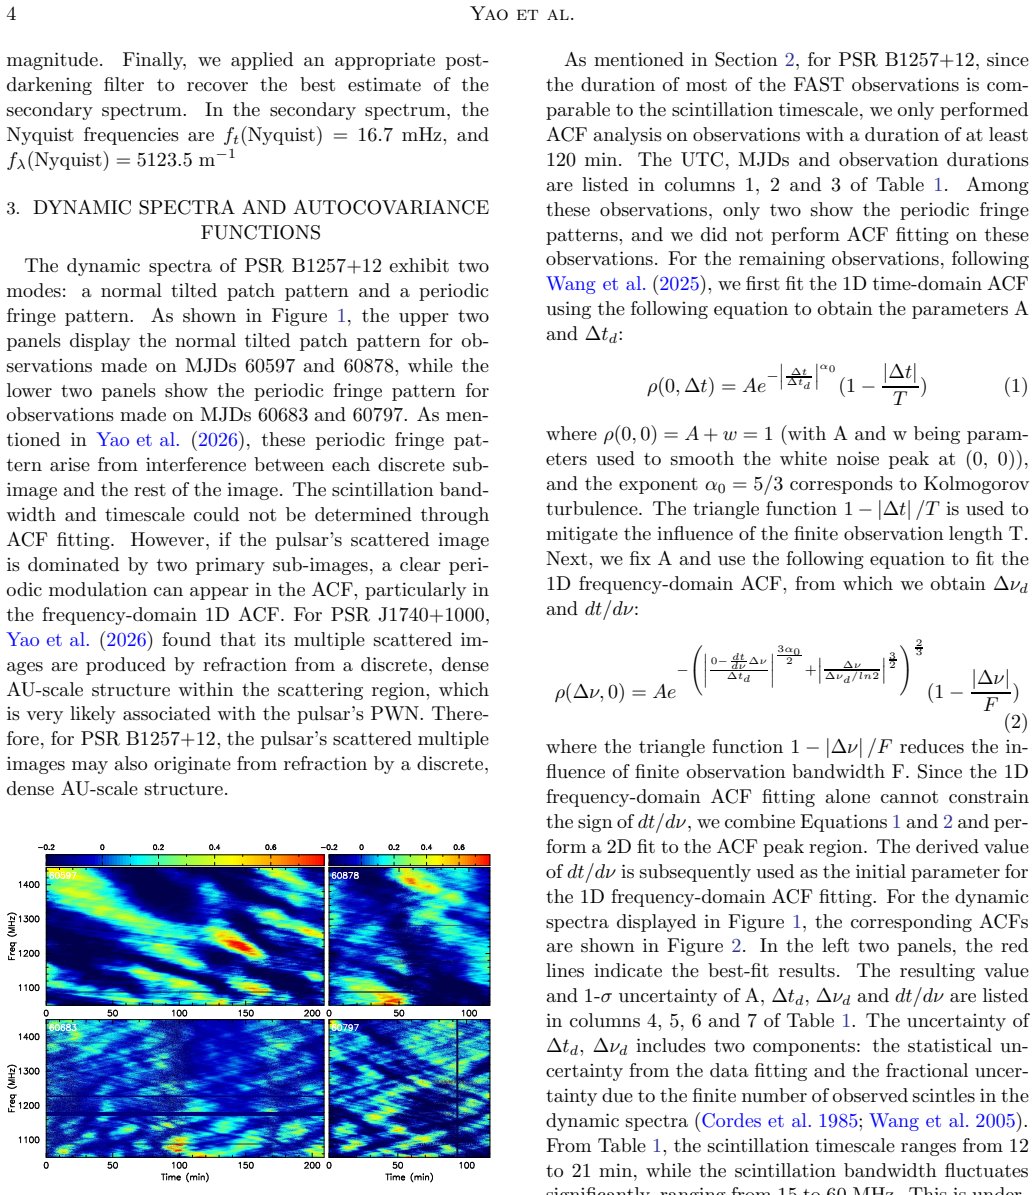
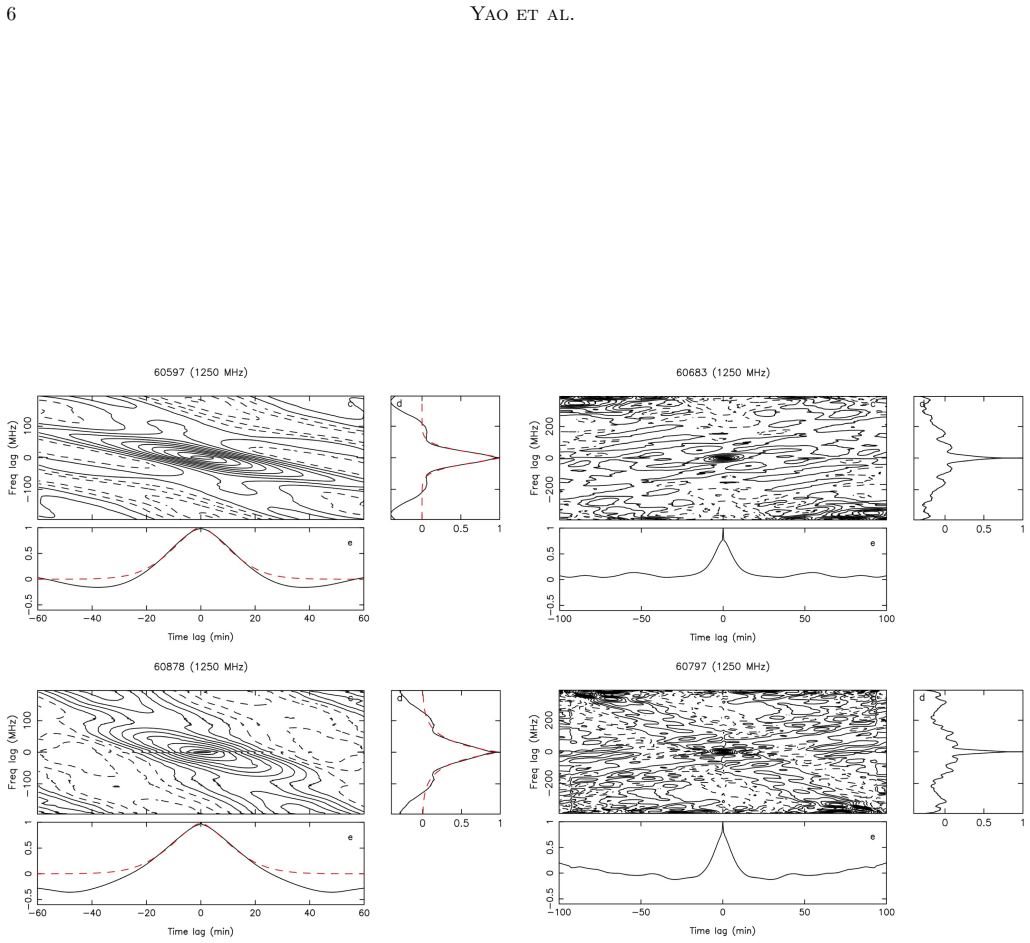
Scintillation measurements of PSR B1257+12 indicate dispersion measure variations are dominated by distant plasma.
A machine-rendered reading of the paper's core claim, the machinery that carries it, and where it could break.
Core claim
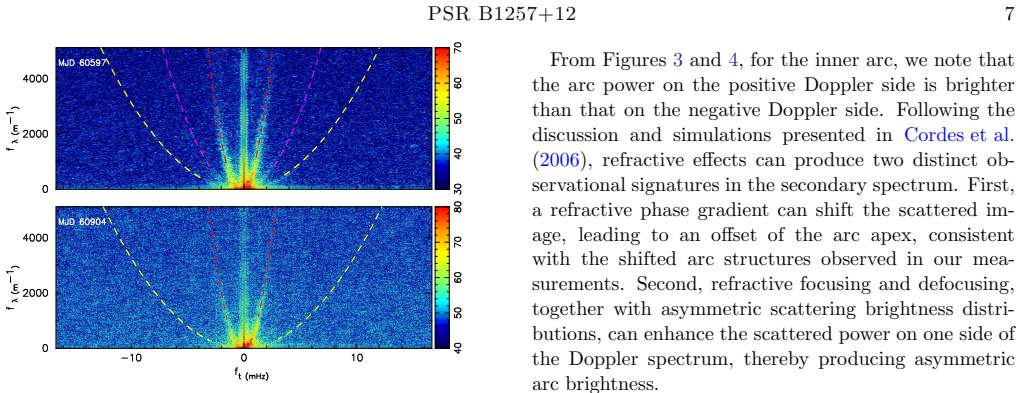
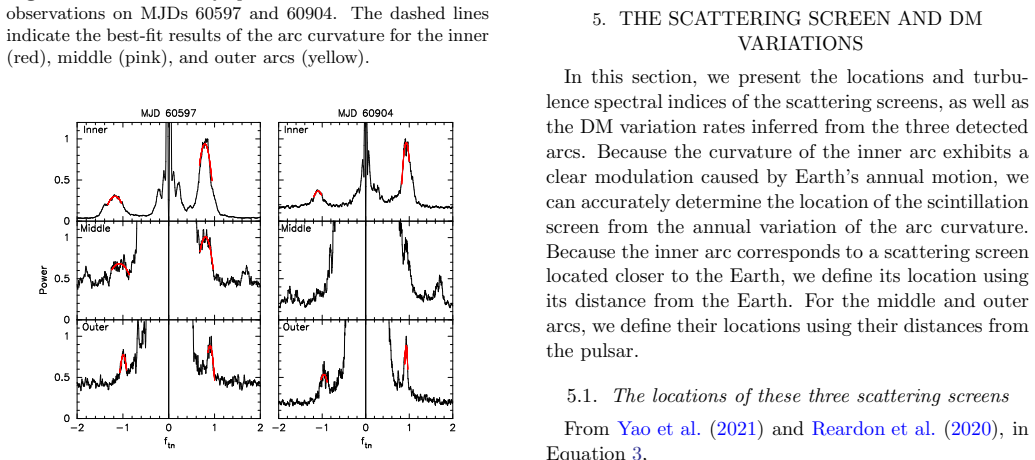
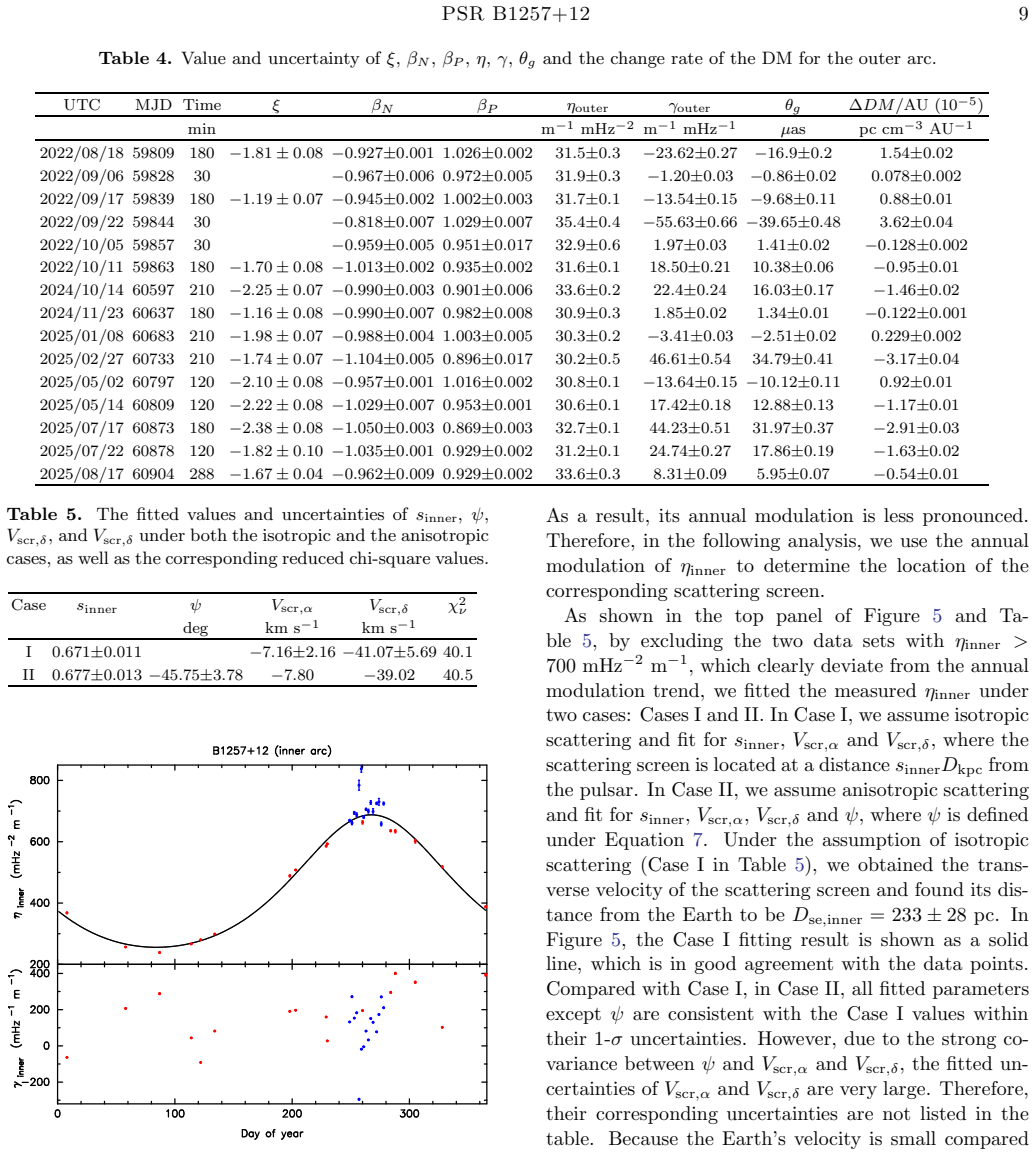
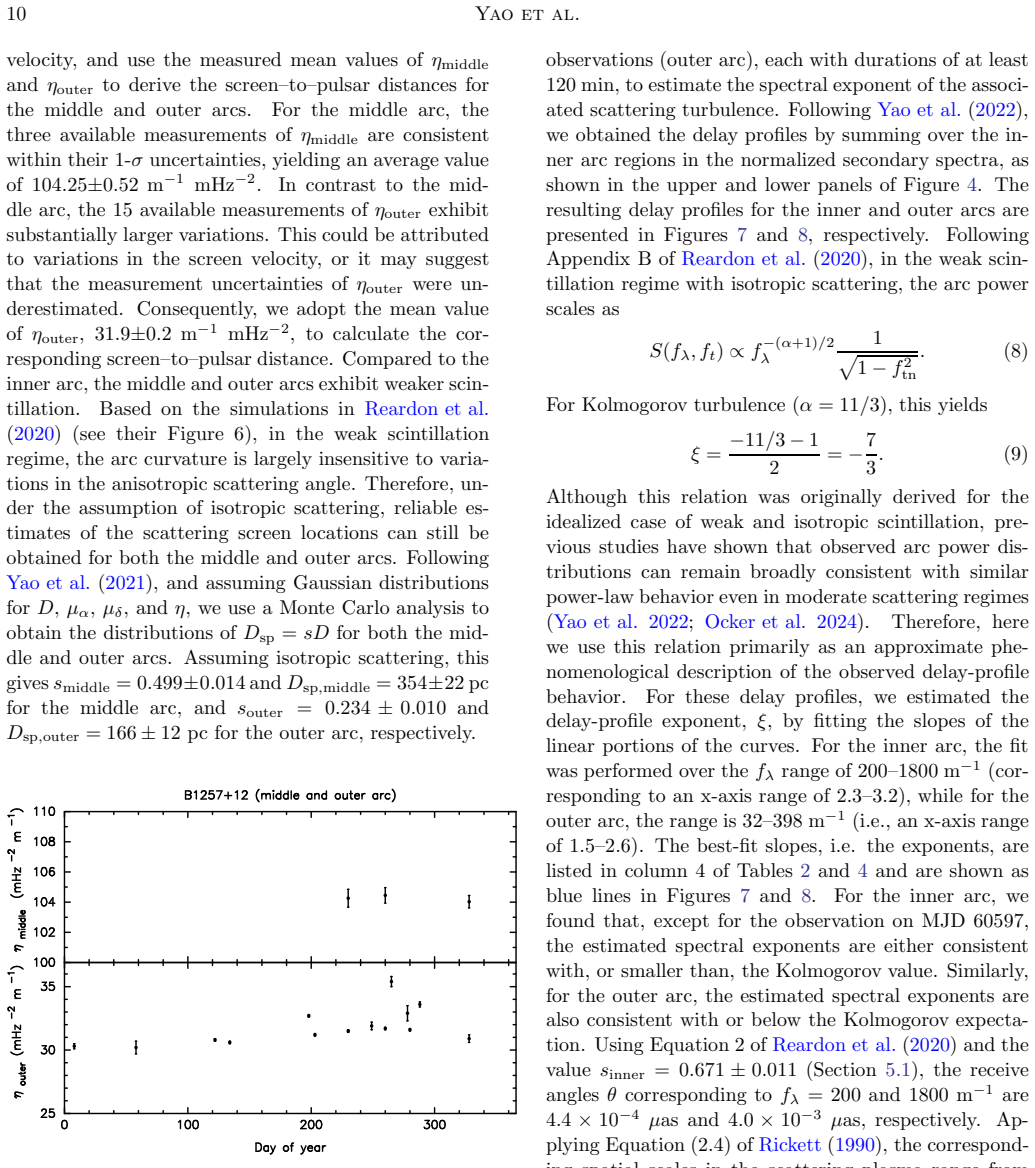
Observations reveal simultaneous detections of inner, middle, and outer arcs in the secondary spectra. Analysis of the annual modulation of the inner-arc curvature indicates isotropic scattering with a screen distance of 233 pc. Under this assumption, the middle and outer arcs correspond to screens at 354 pc and 166 pc. Combining with long-term timing, the DM variations are primarily dominated by plasma located further away from the pulsar, and the low DM-change rate of the outer arc along with absence of nearby screens suggests the immediate environment may be relatively clean.
What carries the argument
annual modulation of inner-arc curvature under isotropic scattering assumption to determine screen distance and velocity
If this is right
- DM variations in the pulsar are mainly caused by distant plasma.
- The immediate pulsar environment appears relatively clean of scattering material.
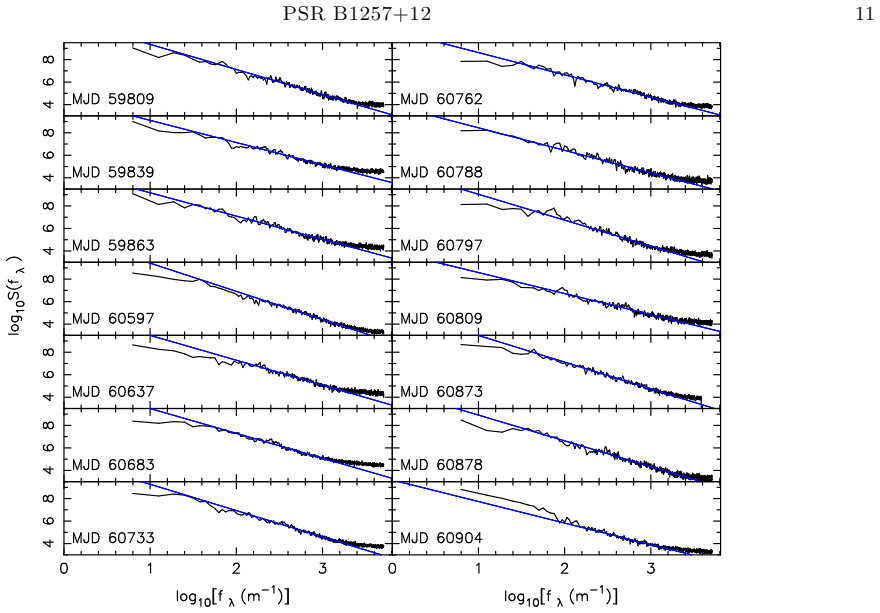
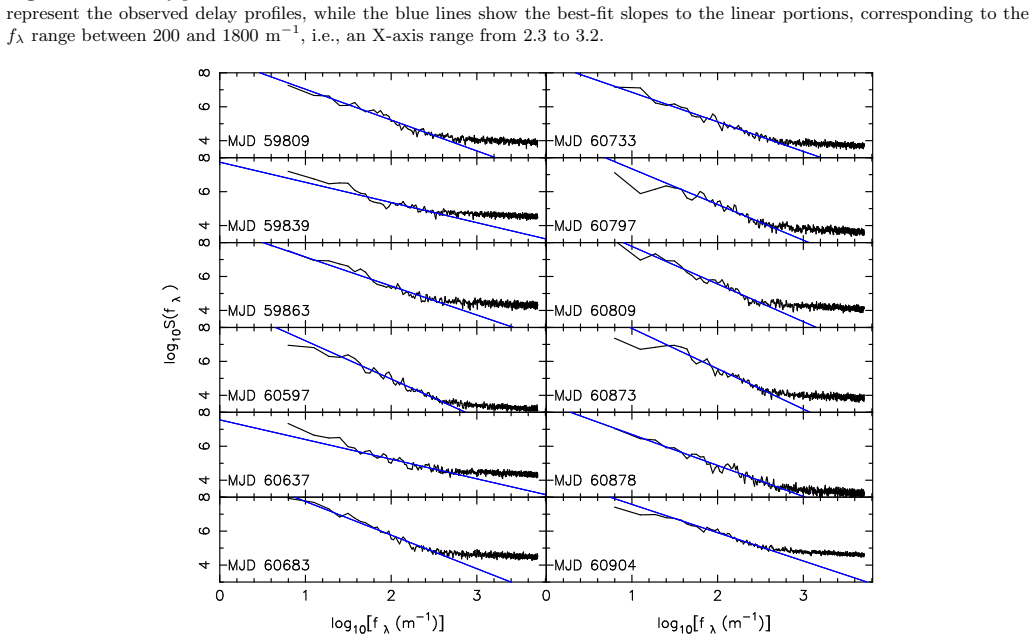
- Spectral exponents for the arcs are consistent with or below the Kolmogorov value.
- Screen-pulsar distances are derived as 354 pc for the middle arc and 166 pc for the outer arc.
Where Pith is reading between the lines
- This suggests timing residuals used for planet detection may be less contaminated by local plasma effects.
- Similar scintillation analysis on other pulsars could test whether planetary systems generally occupy clean local environments.
- If undetected screens closer to the pulsar exist, higher-sensitivity observations might locate them and adjust the attribution of DM changes.
Load-bearing premise
The derivation of screen distances and velocities assumes isotropic scattering when fitting the annual modulation of the inner-arc curvature.
What would settle it
A measurement showing anisotropic scattering or the discovery of a nearby screen that accounts for a significant portion of the observed DM variations would challenge the conclusion.
Figures
read the original abstract
We present a scintillation study of the first-known pulsar planetary system, PSR~B1257+12, using the Five-hundred-meter Aperture Spherical radio Telescope (FAST). A total of 31 observations with durations greater than or equal to 30 minutes were analyzed. For 14 longer observations (greater than or equal to 120 minutes), one-dimensional autocorrelation function analyses yielded the scintillation timescale, scintillation bandwidth, and frequency-drift rate for 12 epochs. Two observations show strong periodic modulation in the frequency-domain auto-correlation function, likely caused by astronomical-unit-scale structures along the propagation path, preventing reliable measurements of the scintillation timescale and bandwidth. In three observations, secondary spectra reveal simultaneous detections of inner, middle, and outer arcs. Analysis of the annual modulation of the inner-arc curvature indicates isotropic scattering, with a screen distance of $233\pm28$~pc and transverse velocity $V_{\rm scr,\alpha}=-7.16\pm2.16$ km~s$^{-1}$, $V_{\rm scr,\delta}=-41.07\pm5.69$ km~s$^{-1}$. Delay-profile analysis for both the inner and outer arcs suggest spectral exponents consistent with, or smaller than, the Kolmogorov value. Under isotropic scattering, the screen--pulsar distances are $354\pm22$~pc and $166\pm12$~pc for the middle and outer arcs. Combining the results from long-term timing analyses with our scintillation measurements, we find that the dispersion measure (DM) variations are primarily dominated by plasma located further away from the pulsar. The low DM-change rate of the outer arc and the absence of nearby scattering screens suggest that the immediate environment of the pulsar may be relatively clean. Alternatively, scattering screens closer to the pulsar may exist but remain undetected, requiring higher-sensitivity or longer-duration observations.
Editorial analysis
A structured set of objections, weighed in public.
Referee Report
Summary. The manuscript presents a scintillation analysis of PSR B1257+12 using 31 FAST observations, focusing on 14 long epochs. One-dimensional ACF analysis yields scintillation parameters; secondary spectra in three epochs show simultaneous inner, middle, and outer arcs. Annual modulation of inner-arc curvature is used to infer isotropic scattering with screen distance 233±28 pc and transverse velocities. Under the isotropic assumption, middle- and outer-arc distances are reported as 354±22 pc and 166±12 pc. Delay-profile analysis gives spectral exponents ≤ Kolmogorov. Combining with timing data, the authors conclude DM variations are dominated by distant plasma and that the immediate pulsar environment is relatively clean.
Significance. If the distances and isotropy assumptions hold, the work supplies concrete screen locations for the only known pulsar planetary system, directly linking scintillation geometry to the timing-derived DM stability and offering a rare empirical constraint on local versus distant scattering contributions.
major comments (2)
- [Abstract / arc-distance derivation] Abstract and § on arc analysis: isotropic scattering is demonstrated only via annual modulation of the inner-arc curvature; the middle- and outer-arc distances (354±22 pc, 166±12 pc) that underpin the 'distant-plasma dominates DM' and 'clean local environment' claims are obtained by extrapolating the same assumption without separate verification for those arcs.
- [Discussion / DM comparison] DM-variation comparison paragraph: the conclusion that the outer arc's low DM-change rate indicates distant dominance rests on the 166±12 pc distance; any anisotropy in the outer-arc geometry would alter the curvature-to-distance mapping and weaken the comparison with timing results.
minor comments (2)
- [Observations section] The manuscript states 31 observations were analyzed but provides no table or section listing the exact epochs, durations, or which 14 were used for ACF; this hinders reproducibility of the reported parameters.
- [Delay-profile analysis] Spectral-exponent values from delay-profile analysis are stated as 'consistent with or smaller than Kolmogorov' but no numerical values or fitting details are given in the text or tables.
Simulated Author's Rebuttal
We thank the referee for their careful and constructive review of our manuscript. We address each major comment below with point-by-point responses, acknowledging where the comments highlight valid limitations in our current presentation. Revisions will be made to improve clarity on assumptions without altering the core results.
read point-by-point responses
-
Referee: [Abstract / arc-distance derivation] Abstract and § on arc analysis: isotropic scattering is demonstrated only via annual modulation of the inner-arc curvature; the middle- and outer-arc distances (354±22 pc, 166±12 pc) that underpin the 'distant-plasma dominates DM' and 'clean local environment' claims are obtained by extrapolating the same assumption without separate verification for those arcs.
Authors: We agree that isotropy is directly verified only for the inner arc via annual modulation of its curvature. The middle- and outer-arc distances are derived by applying the same isotropic assumption to their measured curvatures in the three epochs where all arcs appear simultaneously. This is a reasonable extrapolation given the shared line of sight and simultaneous detection, but we accept that it lacks independent verification for the outer arcs. We will revise the abstract and arc-analysis section to explicitly note that the isotropy assumption is confirmed for the inner arc and extended to the others, and we will add discussion of how this affects the robustness of the reported distances. revision: partial
-
Referee: [Discussion / DM comparison] DM-variation comparison paragraph: the conclusion that the outer arc's low DM-change rate indicates distant dominance rests on the 166±12 pc distance; any anisotropy in the outer-arc geometry would alter the curvature-to-distance mapping and weaken the comparison with timing results.
Authors: The referee is correct that the interpretation linking the outer arc's low DM-change rate to distant plasma dominance depends on the 166±12 pc distance, which assumes isotropy. Anisotropy in the outer-arc geometry would modify the curvature-to-distance conversion and thereby affect the strength of the comparison to timing-derived DM stability. We will revise the relevant discussion paragraph to include this caveat explicitly, while noting that the overall conclusion remains supported under the isotropic model supported by the inner-arc data. This addition will clarify the assumptions without changing the reported findings. revision: partial
Circularity Check
No circularity; distances and conclusions derived from direct measurements under explicit assumption
full rationale
The derivation chain consists of measured arc curvatures from secondary spectra, annual modulation analysis yielding isotropy and distance for the inner arc, and application of the same isotropic mapping to compute middle/outer distances from their curvatures. The DM-dominance conclusion follows from comparing these independently measured distances against separate long-term timing results. No equation reduces a reported distance or cleanliness claim to a fitted parameter by construction, no self-citation is load-bearing for the central steps, and the isotropy assumption is stated rather than smuggled. The analysis remains self-contained against external data.
Axiom & Free-Parameter Ledger
free parameters (2)
- inner screen distance
- screen transverse velocities
axioms (2)
- domain assumption Scattering is isotropic
- domain assumption Spectral exponents follow or are below Kolmogorov turbulence
Reference graph
Works this paper leans on
-
[1]
Bhat, N. D. R., Rao, A. P., & Gupta, Y. 1999, ApJ, 514, 272, doi: 10.1086/306920
-
[2]
2002, ApJ, 581, 495, doi: 10.1086/344169
Wolszczan, A. 2002, ApJ, 581, 495, doi: 10.1086/344169
-
[3]
Cordes, J. M., Rickett, B. J., Stinebring, D. R., & Coles, W. A. 2006, ApJ, 637, 346, doi: 10.1086/498332
-
[4]
Cordes, J. M., Weisberg, J. M., & Boriakoff, V. 1985, ApJ, 288, 221, doi: 10.1086/162784
-
[5]
2007, ApJ, 666, 1232, doi: 10.1086/520327
Currie, T., & Hansen, B. 2007, ApJ, 666, 1232, doi: 10.1086/520327
-
[6]
2000, ApJ, 531, 345, doi: 10.1086/308450
Gothoskar, P., & Gupta, Y. 2000, ApJ, 531, 345, doi: 10.1086/308450
-
[7]
Hansen, B. M. S., Shih, H.-Y., & Currie, T. 2009, ApJ, 691, 382, doi: 10.1088/0004-637X/691/1/382
-
[8]
2025, arXiv e-prints, arXiv:2504.19531, doi: 10.48550/arXiv.2504.19531
Huang, Y., Shi, X., Yao, J., Zhu, W., & Xu, Y. 2025, arXiv e-prints, arXiv:2504.19531, doi: 10.48550/arXiv.2504.19531
-
[9]
2003, ApJL, 591, L147, doi: 10.1086/377093
Konacki, M., & Wolszczan, A. 2003, ApJL, 591, L147, doi: 10.1086/377093
-
[10]
Laycock, S. G. T., & Christodoulou, D. M. 2025, ApJ, 982, 63, doi: 10.3847/1538-4357/adb1a8
-
[11]
2018, IEEE Microwave Magazine, 19, 112, doi: 10.1109/MMM.2018.2802178
Li, D., Wang, P., Qian, L., et al. 2018, IEEE Microwave Magazine, 19, 112, doi: 10.1109/MMM.2018.2802178
-
[12]
A., Parthasarathy, A., Johnston, S., et al
Main, R. A., Parthasarathy, A., Johnston, S., et al. 2023a, MNRAS, 518, 1086, doi: 10.1093/mnras/stac3149
-
[13]
A., Antoniadis, J., Chen, S., et al
Main, R. A., Antoniadis, J., Chen, S., et al. 2023b, MNRAS, 525, 1079, doi: 10.1093/mnras/stad1980
-
[14]
2011, International Journal o f Modern Physics D, 20, 989, doi: 10.1142/S0218271811019335
Nan, R., Li, D., Jin, C., et al. 2011, International Journal o f Modern Physics D, 20, 989, doi: 10.1142/S0218271811019335
-
[15]
Ocker, S. K., Cordes, J. M., Chatterjee, S., et al. 2024, MNRAS, 527, 7568, doi: 10.1093/mnras/stad3683
-
[16]
Reardon, D. J., & Coles, W. A. 2023, MNRAS, 521, 6392, doi: 10.1093/mnras/stad962
-
[17]
Reardon, D. J., Coles, W. A., Bailes, M., et al. 2020, ApJ, 904, 104, doi: 10.3847/1538-4357/abbd40
-
[18]
Reardon, D. J., Main, R., Ocker, S. K., et al. 2025, Nature Astronomy, 9, 1053, doi: 10.1038/s41550-025-02534-6
-
[19]
Rickett, B. J. 1990, ARA&A, 28, 561, doi: 10.1146/annurev.aa.28.090190.003021
-
[20]
Sobey, C., Bilous, A. V., Grießmeier, J.-M., et al. 2019, MNRAS, 484, 3646, doi: 10.1093/mnras/stz214
-
[21]
Stinebring, D. R., McLaughlin, M. A., Cordes, J. M., et al. 2001, ApJL, 549, L97, doi: 10.1086/319133
-
[22]
Pulsar data analysis with PSRCHIVE
Stinebring, D. R., Rickett, B. J., Minter, A. H., et al. 2022, ApJ, 941, 34, doi: 10.3847/1538-4357/ac8ea8 van Straten, W., & Bailes, M. 2011, PASA, 28, 1, doi: 10.1071/AS10021 van Straten, W., Demorest, P., & Oslowski, S. 2012, Astronomical Research and Technology, 9, 237, doi: 10.48550/arXiv.1205.6276
work page internal anchor Pith review Pith/arXiv arXiv doi:10.3847/1538-4357/ac8ea8 2022
-
[23]
, year = 2005, month = apr, volume =
Wang, N., Manchester, R. N., Johnston, S., et al. 2005, MNRAS, 358, 270, doi: 10.1111/j.1365-2966.2005.08798.x
-
[24]
2025, Science China
Wang, R., Yan, Z., Shen, Z., et al. 2025, Science China
2025
-
[25]
Physics, Mechanics, and Astronomy, 68, 239512, doi: 10.1007/s11433-024-2511-6
-
[26]
Wolszczan, A. 1990, IAUC, 5073, 1 —. 1994, Science, 264, 538, doi: 10.1126/science.264.5158.538
-
[27]
Wolszczan, A., & Frail, D. A. 1992, Nature, 355, 145, doi: 10.1038/355145a0
-
[28]
2013, MNRAS, 433, 162, doi: 10.1093/mnras/stt712
Yan, Z., Shen, Z.-Q., Yuan, J.-P., et al. 2013, MNRAS, 433, 162, doi: 10.1093/mnras/stt712
-
[29]
Yao, J., Zhu, W., Manchester, R. N., et al. 2021, Nature Astronomy, 5, 788, doi: 10.1038/s41550-021-01360-w
-
[30]
Yao, J., Coles, W. A., Manchester, R. N., et al. 2022, ApJ, 939, 75, doi: 10.3847/1538-4357/ac9667
-
[31]
Yao, J. M., Kou, F. F., Yuan, J. P., et al. 2026, arXiv e-prints, arXiv:2602.23855, doi: 10.48550/arXiv.2602.23855
discussion (0)
Sign in with ORCID, Apple, or X to comment. Anyone can read and Pith papers without signing in.