REVIEW 2 major objections 2 minor 44 references
Something green beneath the surface: The dynamical nature of Fossil Structures in IllustrisTNG-100
T0 review · 2 major / 2 minor · reviewed 2026-06-26 · grok-4.3
Pith's one-line read The magnitude gap that defines fossil structures traces their recent assembly history rather than indicating full dynamical relaxation.
desk verdict The paper shows magnitude gaps in TNG-100 fossils mainly mark no recent big accretion, but the gap is a weak proxy for current dynamical state since both FS and non-FS sit at similar intermediate relaxation by the gas-BSG offset. read the letter →
The pith
A machine-rendered reading of the paper's core claim, the machinery that carries it, and where it could break.
The reading
What carries the argument
The gas-BSG centroid shift used as a dynamical proxy, together with the magnitude gap Δm_{1,2} and the stellar-mass ratio of the most massive satellite accreted in the last 6 Gyr.
What would settle it
A direct comparison, in the same simulated structures, between the gas-BSG centroid offset and an independent dynamical indicator such as X-ray morphology or member-galaxy velocity dispersion anisotropy would show whether the two populations truly share the same intermediate relaxation level.
Extended reading notes
Core claim
Fossil structures are identified by a magnitude gap of at least 2 magnitudes, traditionally thought to mark dynamically relaxed systems. Analysis reveals that the gap results from the absence of massive recent accretion events, with fossil systems showing lower stellar mass ratios for their most massive recently accreted satellites. However, both fossil and non-fossil structures display intermediate centroid shifts between the gas and brightest satellite galaxy, indicating neither population has reached full relaxation. Consequently, the magnitude gap serves as a tracer of the assembly history of massive components over the last 3-6 Gyr rather than a proxy for the stability of the intra-clus
Load-bearing premise
The gas-BSG centroid shift serves as a reliable proxy for the global dynamical state of the system.
Editorial extensions
If this is right
- Fossil systems exhibit significantly lower BSG-to-satellite stellar mass ratios for the most massive satellite accreted within the last 6 Gyr.
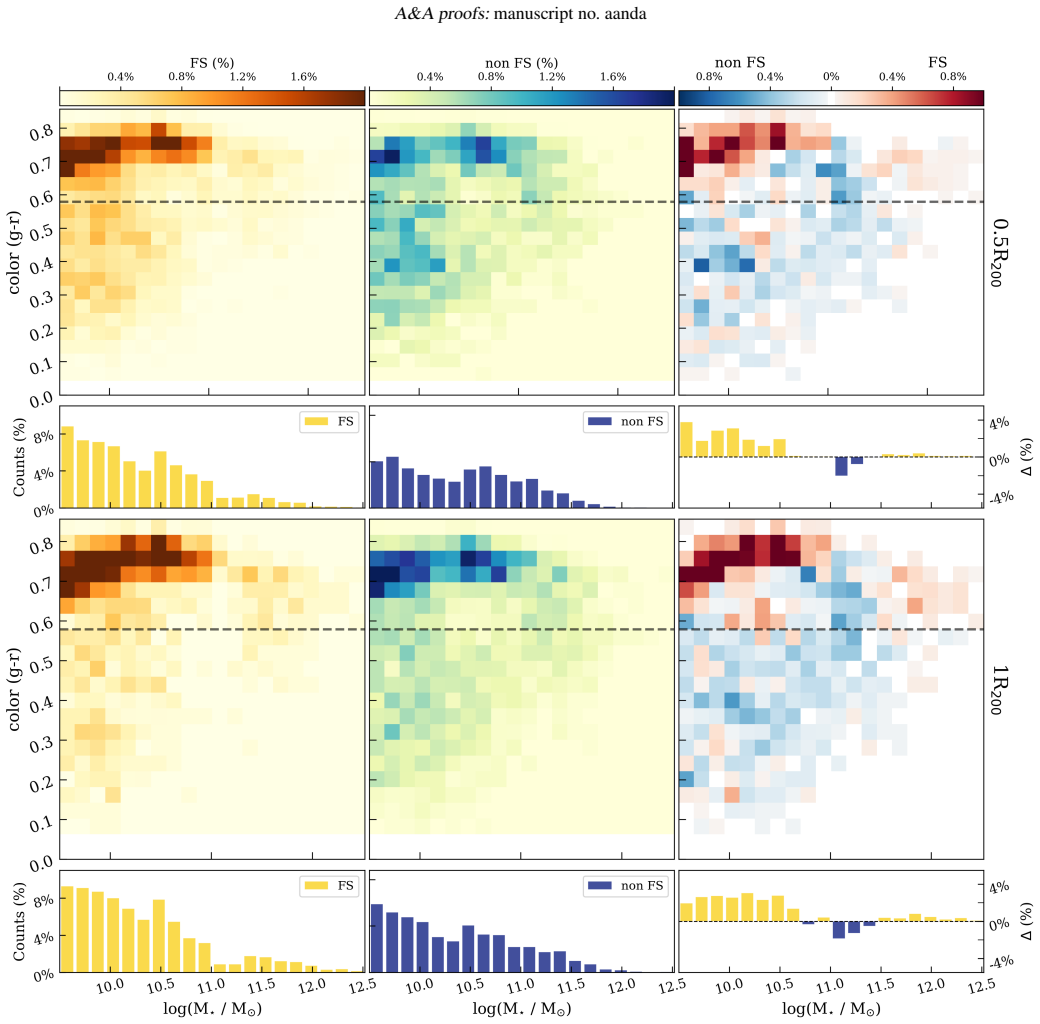
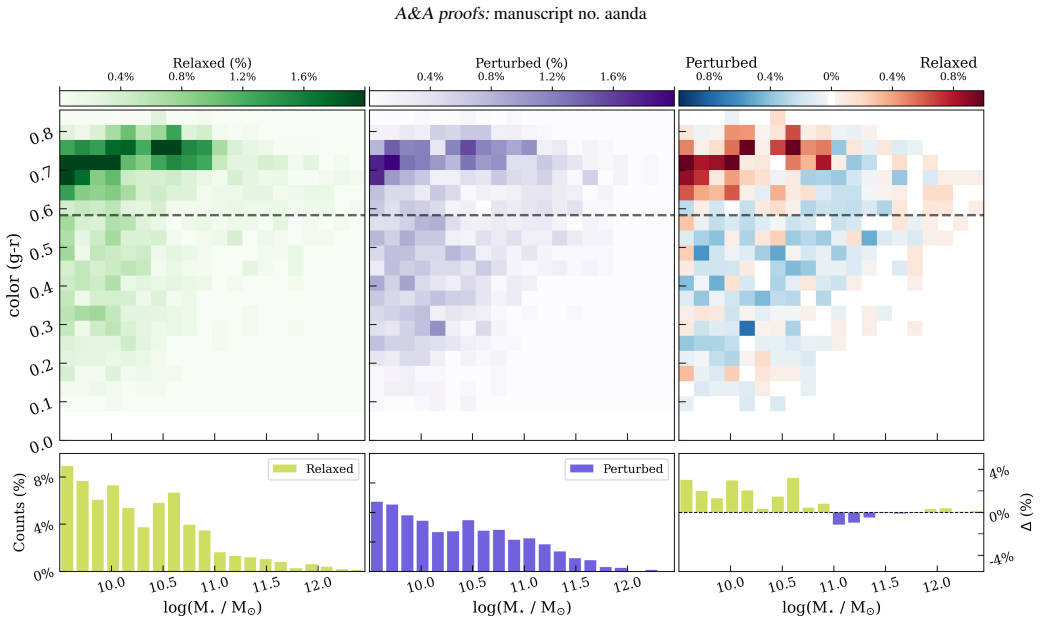
- Fossil systems host a more prominent red sequence and marginally higher quenched fractions than non-fossil systems.
- The magnitude gap identifies systems that have ceased major mergers in the last 3-6 Gyr.
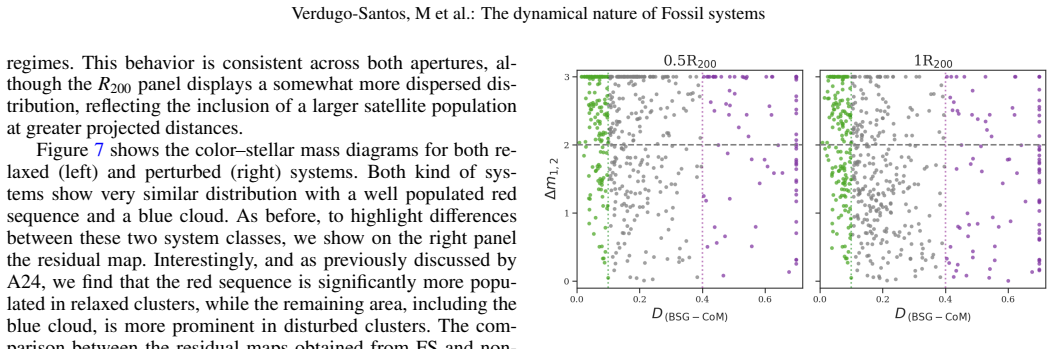
- Both fossil and non-fossil populations exhibit intermediate gas-BSG offsets of approximately 0.15 R/R_{200}.
Reading between the lines
- Surveys that select relaxed clusters by magnitude gap alone may instead be selecting systems with quiet recent accretion histories.
- Relaxation of the intra-cluster medium appears to proceed independently of the processes that create the magnitude gap.
- Repeating the centroid-shift analysis at higher redshifts could show when the decoupling between gap size and dynamical state first appears.
- The result suggests that models of intra-cluster medium heating should treat merger history and global relaxation as partially separate variables.
Editorial analysis
A structured set of objections, weighed in public.
Referee Report
Summary. The manuscript analyzes 182 structures with M200 > 10^13 Msun at z=0 in IllustrisTNG-100, classifying them as fossil structures (FS) or non-FS using an r-band magnitude gap threshold Δm1,2 ≥ 2. It tracks the gap evolution over 9 Gyr, compares quenched fractions (sSFR < 10^{-11} yr^{-1}), color-stellar mass distributions, and BSG-to-satellite mass ratios, and employs the gas-BSG centroid shift D_BSG-CM as a dynamical proxy. The central claim is that the magnitude gap identifies systems without recent major mergers (evidenced by lower μ⋆ = 0.17 in FS vs. 0.39 in non-FS for satellites accreted in last 6 Gyr) but is a poor indicator of current dynamical state, since both populations show similar intermediate relaxation with D_BSG-CM ≈ 0.15 R/R200.
Significance. If the dynamical proxy holds, the work usefully decouples the magnitude gap from relaxation state and demonstrates its link to assembly history via explicit accretion tracking. The 9 Gyr evolutionary analysis and quantitative mass-ratio comparisons provide concrete, falsifiable results on galaxy populations in FS. These elements strengthen the contribution beyond purely observational studies.
major comments (2)
- [§4 (dynamical proxy results)] §4 (dynamical proxy results): The conclusion that neither FS nor non-FS reach full relaxation, and thus that the magnitude gap traces assembly history rather than ICM stability, rests entirely on D_BSG-CM ≈ 0.15 R/R200 being a reliable global proxy. No correlations or consistency checks against standard alternatives (virial ratio 2K/|W|, DM center-of-mass offset, or substructure fraction) are reported within the same 182-structure sample. This directly undermines the decoupling claim.
- [Methods and §3 (sample definition)] Methods and §3 (sample definition): The central results on quenched fractions and dynamical offsets lack reported error analysis, bootstrap uncertainties, or robustness tests to the exact Δm1,2 ≥ 2 and sSFR thresholds. Without these, the statistical significance of the reported differences (e.g., red-sequence prominence, μ⋆ values) cannot be assessed.
minor comments (2)
- [Abstract] Abstract: The number of FS versus non-FS systems within the 182 total is not stated, reducing immediate clarity on sample balance.
- [Results] Notation: The symbols μ⋆FS and μ⋆NFS are introduced without an explicit definition sentence on first use.
Simulated Author's Rebuttal
We thank the referee for their constructive feedback, which highlights areas where additional analysis will strengthen the manuscript. We address each major comment below and will revise accordingly.
read point-by-point responses
-
Referee: [§4 (dynamical proxy results)] The conclusion that neither FS nor non-FS reach full relaxation, and thus that the magnitude gap traces assembly history rather than ICM stability, rests entirely on D_BSG-CM ≈ 0.15 R/R200 being a reliable global proxy. No correlations or consistency checks against standard alternatives (virial ratio 2K/|W|, DM center-of-mass offset, or substructure fraction) are reported within the same 182-structure sample. This directly undermines the decoupling claim.
Authors: We acknowledge that validating D_BSG-CM against other standard dynamical proxies would provide stronger support for the claim that the magnitude gap does not indicate full relaxation. D_BSG-CM was selected as it directly measures the offset between the brightest satellite galaxy and the gas center of mass, which is particularly relevant to ICM stability. In the revised manuscript we will add comparisons of D_BSG-CM with the DM center-of-mass offset and substructure fraction (computed within the same 182-structure sample) to confirm that both populations show intermediate relaxation. This will directly address the concern and reinforce the decoupling between magnitude gap and current dynamical state. revision: yes
-
Referee: [Methods and §3 (sample definition)] The central results on quenched fractions and dynamical offsets lack reported error analysis, bootstrap uncertainties, or robustness tests to the exact Δm1,2 ≥ 2 and sSFR thresholds. Without these, the statistical significance of the reported differences (e.g., red-sequence prominence, μ⋆ values) cannot be assessed.
Authors: We agree that quantitative uncertainties and robustness tests are necessary to evaluate the significance of the differences in quenched fractions, color-mass distributions, and μ⋆. In the revised manuscript we will include bootstrap uncertainties on all reported fractions and ratios. We will also test the sensitivity of the main conclusions to variations in the magnitude-gap threshold (Δm1,2 = 1.5 and 2.5) and the sSFR cut-off to demonstrate that the key results are robust. revision: yes
Circularity Check
No significant circularity in derivation chain
full rationale
The paper conducts an empirical analysis of IllustrisTNG-100 simulation outputs. Structures are classified by an independently defined magnitude gap threshold, and dynamical state is assessed via a direct geometric proxy (gas-BSG centroid shift). The decoupling conclusion follows from comparing measured values (quenched fractions, mass ratios, offsets) between the two populations without any fitted parameters renamed as predictions, self-referential equations, or load-bearing self-citations. All quantities are computed from the simulation data using standard definitions external to the target claim.
Assumptions & free parameters
free parameters (2)
- magnitude gap threshold Δm1,2 >=2
- sSFR threshold 10^{-11} yr^{-1}
assumptions (1)
- domain assumption IllustrisTNG-100 accurately models the relevant galaxy formation and dynamical processes.
Cite this review
Pith. "Pith review of Something green beneath the surface: The dynamical nature of Fossil Structures in IllustrisTNG-100." pith.science (2026). https://pith.science/paper/ADBAPWFQ
@misc{pith2026260619478,
  author       = {Pith},
  title        = {Pith review of: Something green beneath the surface: The dynamical nature of Fossil Structures in IllustrisTNG-100},
  year         = {2026},
  howpublished = {\url{https://pith.science/paper/ADBAPWFQ}},
  note         = {Machine review of arXiv:2606.19478}
}
abstract
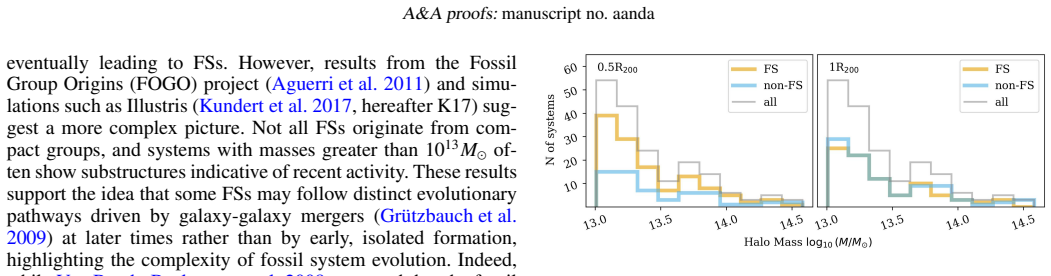
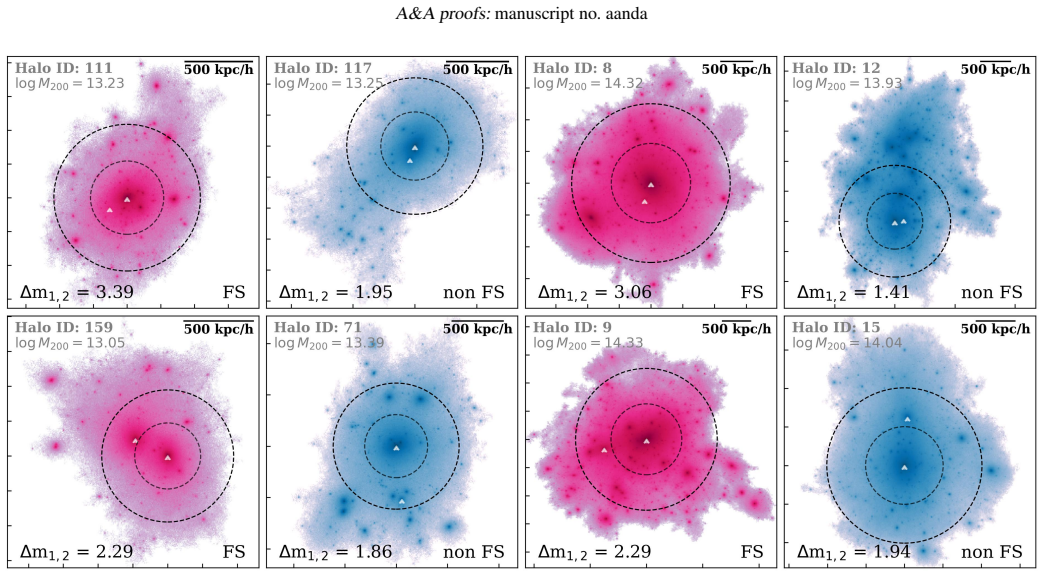
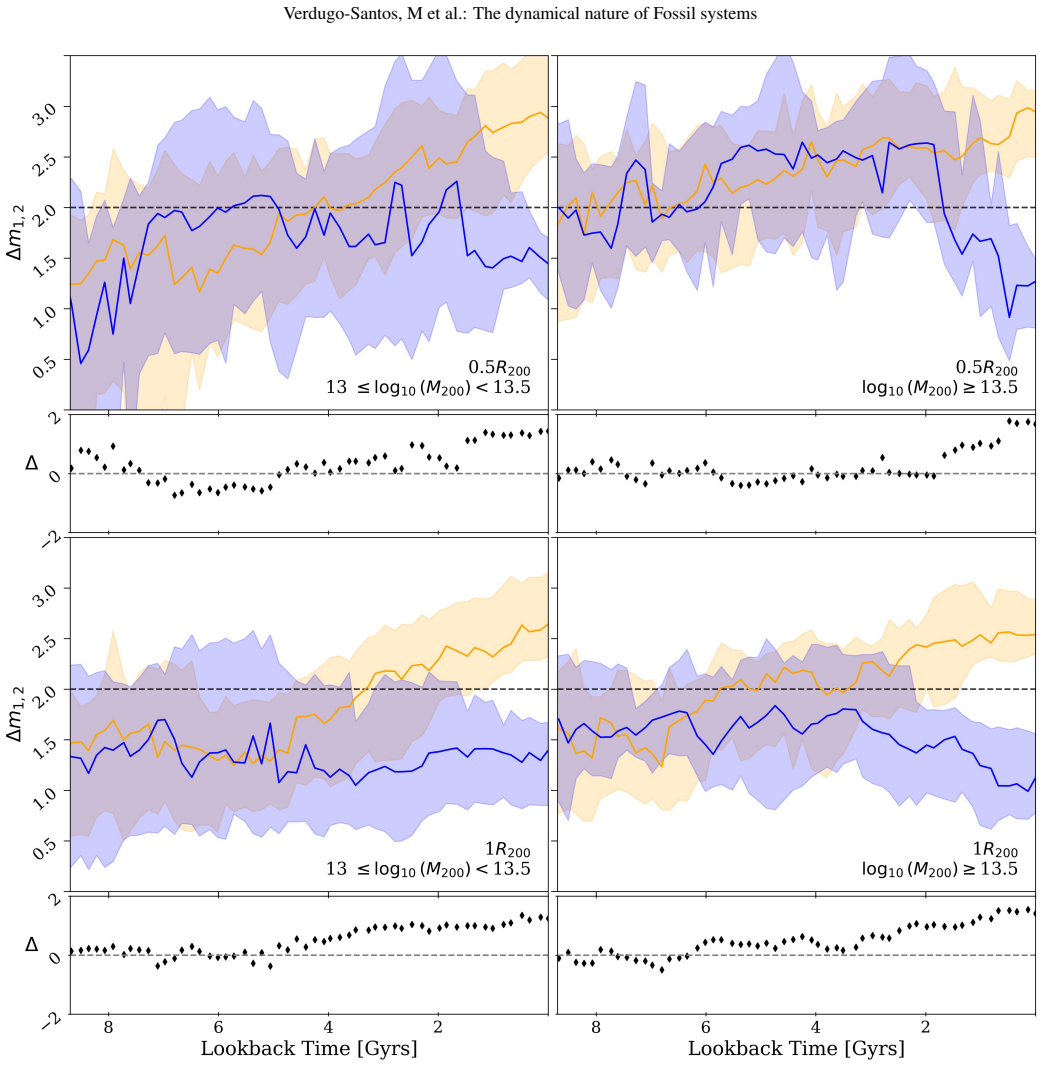
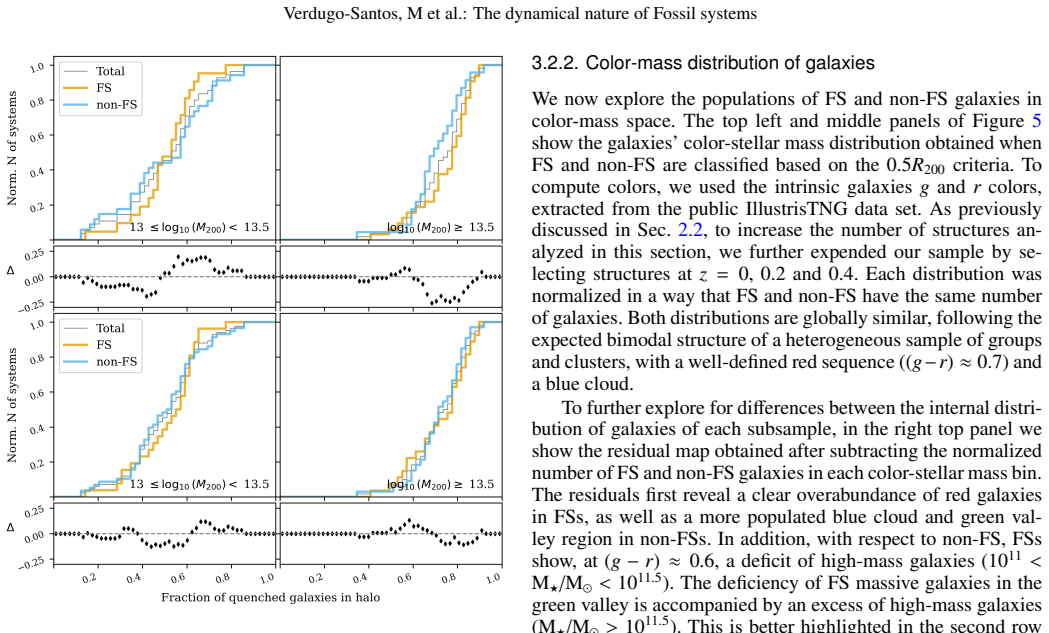
Fossil structures (FS) have traditionally been considered dynamically relaxed end-products of group evolution, characterized by a large magnitude gap ($\Delta m_{1,2} \geq 2$). However, recent observations and simulations suggest this picture is incomplete. We investigate whether FS are dynamically relaxed systems and how their galaxy populations differ from non-fossil systems (non-FS), focusing on system dynamics and evolution of the galaxies inside them. Using \textsc{IllustrisTNG-100}, we select 182 structures ($M_{200} > 10^{13}\,M_{\odot}$) at $z = 0$, classifying them as FS/non-FS based on $\Delta m_{1,2}$ in the $r$-band. We track $\Delta m_{1,2}$ evolution over 9\,Gyr and analyze: (1) the emergence of $\Delta m_{1,2}$, (2) the fraction of quenched galaxies (sSFR $< 10^{-11}$\,yr$^{-1}$), (3) the distribution of galaxies in color--stellar mass space, and (4) the gas--BSG centroid shift as a dynamical proxy. The magnitude gap in FS is primarily driven by the absence of massive recent accretion: FS exhibit significantly lower BSG-to-satellite stellar mass ratios ($\mu^{\rm{FS}}{\star}$=0.17 vs. $\mu^{\rm{NFS}}{\star}$=0.39) for the most massive satellite accreted within the last 6\,Gyr. FS also host a more prominent red sequence and marginally higher quenched fractions than non-FS. Our findings indicate that while the magnitude gap effectively identifies systems that have ceased major mergers in the last 3-6 Gyr, it is a poor proxy for their current global dynamical state. Both FS and non-FS populations exhibit intermediate gas-BSG offsets ($D_{BSG-CM} \approx 0.15 R/R_{200}$), failing to reach full relaxation. This decoupling suggests that the magnitude gap traces the assembly history of massive components rather than the overall stability of the intra cluster medium.
Figures
Figures from the paper (4 more)
Reference graph
Works this paper leans on
-
[1]
2020, A&A, 639, A97
Adami, C., Sarron, F., Martinet, N., & Durret, F. 2020, A&A, 639, A97
2020
-
[2]
Aguerri, J. A. L., Girardi, M., Boschin, W., et al. 2011, A&A, 527, A143
2011
- [3]
-
[4]
K., Glazebrook, K., Brinkmann, J., et al
Baldry, I. K., Glazebrook, K., Brinkmann, J., et al. 2004, ApJ, 600, 681
2004
-
[5]
& Gavazzi, G
Boselli, A. & Gavazzi, G. 2006, PASP, 118, 517
2006
-
[6]
2011, MNRAS, 416, 2997
Cui, W., Springel, V ., Yang, X., De Lucia, G., & Borgani, S. 2011, MNRAS, 416, 2997
2011
-
[7]
G., Ponman, T
Dariush, A., Khosroshahi, H. G., Ponman, T. J., et al. 2007, MNRAS, 382, 433
2007
-
[8]
A., Raychaudhury, S., Ponman, T
Dariush, A. A., Raychaudhury, S., Ponman, T. J., et al. 2010, MNRAS, 405, 1873
2010
Show all 44 references
-
[9]
S., & White, S
Davis, M., Efstathiou, G., Frenk, C. S., & White, S. D. M. 1985, ApJ, 292, 371 De Luca, F., De Petris, M., Yepes, G., et al. 2021, MNRAS, 504, 5383 De Lucia, G. & Blaizot, J. 2007, MNRAS, 375, 2
1985
-
[10]
2019, MNRAS, 485, 4817
Donnari, M., Pillepich, A., Nelson, D., et al. 2019, MNRAS, 485, 4817
2019
-
[11]
C., Fabian, A
Ebeling, H., Edge, A. C., Fabian, A. C., et al. 1997, ApJ, 479, L101
1997
-
[12]
2014, MNRAS, 445, 175
Genel, S., V ogelsberger, M., Springel, V ., et al. 2014, MNRAS, 445, 175
2014
-
[13]
B., Zhang, Y ., Ogando, R
Golden-Marx, J. B., Zhang, Y ., Ogando, R. L. C., et al. 2025, MNRAS, 538, 622
2025
-
[14]
G., Dariush, A
Gozaliasl, G., Khosroshahi, H. G., Dariush, A. A., et al. 2014, A&A, 571, A49 Grützbauch, R., Zeilinger, W. W., Rampazzo, R., et al. 2009, A&A, 502, 473
2014
-
[15]
R., Ponman, T
Jones, L. R., Ponman, T. J., Horton, A., et al. 2003, MNRAS, 343, 627
2003
-
[16]
M., White, S
Kauffmann, G., Heckman, T. M., White, S. D. M., et al. 2003, MNRAS, 341, 33
2003
-
[17]
2025, MNRAS, 543, 3391
Khalid, A., Brough, S., Martin, G., et al. 2025, MNRAS, 543, 3391
2025
-
[18]
2026, A&A, 708, A262
Kim, H., Canducci, M., Smith, R., et al. 2026, A&A, 708, A262
2026
-
[19]
Kundert, A., D’Onghia, E., & Aguerri, J. A. L. 2017, ApJ, 845, 45
2017
-
[20]
2018, MNRAS, 480, 5113 Mendes de Oliveira, C
Marinacci, F., V ogelsberger, M., Pakmor, R., et al. 2018, MNRAS, 480, 5113 Mendes de Oliveira, C. L. & Carrasco, E. R. 2007, ApJ, 670, L93 Méndez-Abreu, J., Aguerri, J. A. L., Barrena, R., et al. 2012, A&A, 537, A25
2018
-
[21]
P., Pillepich, A., Springel, V ., et al
Naiman, J. P., Pillepich, A., Springel, V ., et al. 2018, MNRAS, 477, 1206
2018
-
[22]
2015, Astronomy and Computing, 13, 12
Nelson, D., Pillepich, A., Genel, S., et al. 2015, Astronomy and Computing, 13, 12
2015
-
[23]
2018, MNRAS, 475, 624
Nelson, D., Pillepich, A., Springel, V ., et al. 2018, MNRAS, 475, 624
2018
-
[24]
A., Padilla, N
Pallero, D., Gómez, F. A., Padilla, N. D., et al. 2022, MNRAS, 511, 3210
2022
-
[25]
A., Padilla, N
Pallero, D., Gómez, F. A., Padilla, N. D., et al. 2019, MNRAS, 488, 847
2019
-
[26]
2018b, MNRAS, 473, 4077 Planck Collaboration, Ade, P
Pillepich, A., Springel, V ., Nelson, D., et al. 2018b, MNRAS, 473, 4077 Planck Collaboration, Ade, P. A. R., Aghanim, N., et al. 2016, A&A, 594, A13
2016
-
[27]
J., Allan, D
Ponman, T. J., Allan, D. J., Jones, L. R., et al. 1994, Nature, 369, 462
1994
-
[28]
G., Ponman, T
Raouf, M., Khosroshahi, H. G., Ponman, T. J., et al. 2014, Monthly Notices of the Royal Astronomical Society, 442, 1578
2014
-
[29]
A., Mendes de Oliveira, C., & Sodré, Laerte, J
Santos, W. A., Mendes de Oliveira, C., & Sodré, Laerte, J. 2007, AJ, 134, 1551
2007
-
[30]
2015, MNRAS, 452, 575
Sijacki, D., V ogelsberger, M., Genel, S., et al. 2015, MNRAS, 452, 575
2015
-
[31]
2010, Monthly Notices of the Royal Astronomical Society, 401, 791
Springel, V . 2010, Monthly Notices of the Royal Astronomical Society, 401, 791
2010
-
[32]
2018, MNRAS, 475, 676
Springel, V ., Pakmor, R., Pillepich, A., et al. 2018, MNRAS, 475, 676
2018
-
[33]
Springel, V ., White, S. D. M., Jenkins, A., et al. 2005, Nature, 435, 629
2005
-
[34]
Springel, V ., White, S. D. M., Tormen, G., & Kauffmann, G. 2001, MNRAS, 328, 726
2001
-
[35]
2004, ApJ, 612, 805 Véliz Astudillo, S., Carrasco, E
Sun, M., Forman, W., Vikhlinin, A., et al. 2004, ApJ, 612, 805 Véliz Astudillo, S., Carrasco, E. R., Nilo Castellón, J. L., Zenteno, A., & Cuevas, H. 2025, A&A, 693, A106 V ogelsberger, M., Genel, S., Springel, V ., et al. 2014, MNRAS, 444, 1518 V on Benda-Beckmann, A. M., D’O...
2004
-
[36]
Walters, D., Woo, J., & Ellison, S. L. 2022, MNRAS, 511, 6126
2022
-
[37]
2017, MNRAS, 465, 3291
Weinberger, R., Springel, V ., Hernquist, L., et al. 2017, MNRAS, 465, 3291
2017
-
[38]
R., Tinker, J
Wetzel, A. R., Tinker, J. L., & Conroy, C. 2012, Monthly Notices of the Royal Astronomical Society, 424, 232
2012
-
[39]
White, S. D. M. & Rees, M. J. 1978, MNRAS, 183, 341
1978
-
[40]
2025, arXiv e-prints, arXiv:2508.00667
Yang, M., Han, J., Wang, W., et al. 2025, arXiv e-prints, arXiv:2508.00667
2025
-
[41]
J., & van den Bosch, F
Yang, X., Mo, H. J., & van den Bosch, F. C. 2008, ApJ, 676, 248
2008
-
[42]
Zarattini, S., Aguerri, J. A. L., Sánchez-Janssen, R., et al. 2015, A&A, 581, A16
2015
-
[43]
Zarattini, S., Biviano, A., Aguerri, J. A. L., Girardi, M., & D’Onghia, E. 2021, A&A, 655, A103
2021
-
[44]
2022, MNRAS, 516, 26 Article number, page 12
Zhang, B., Cui, W., Wang, Y ., Dave, R., & De Petris, M. 2022, MNRAS, 516, 26 Article number, page 12
2022
Reviewed June 26, 2026 · model on record in the stance chip above.
Discussion (0). Continue with ORCID to comment.