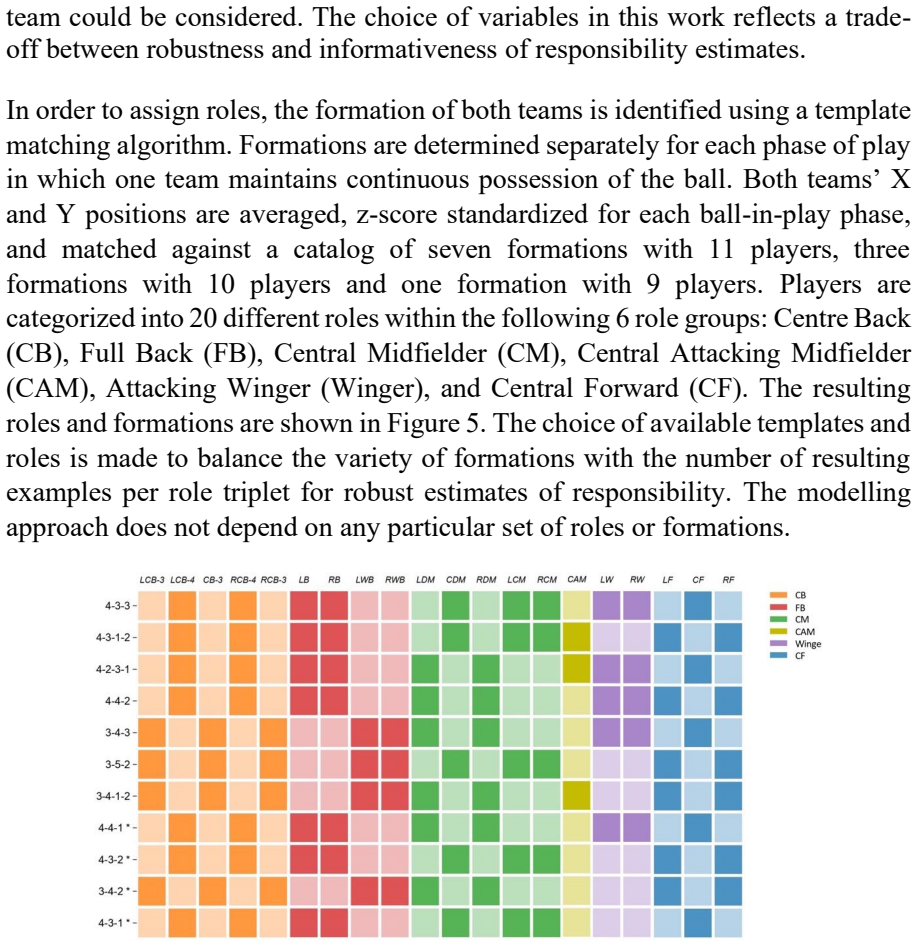
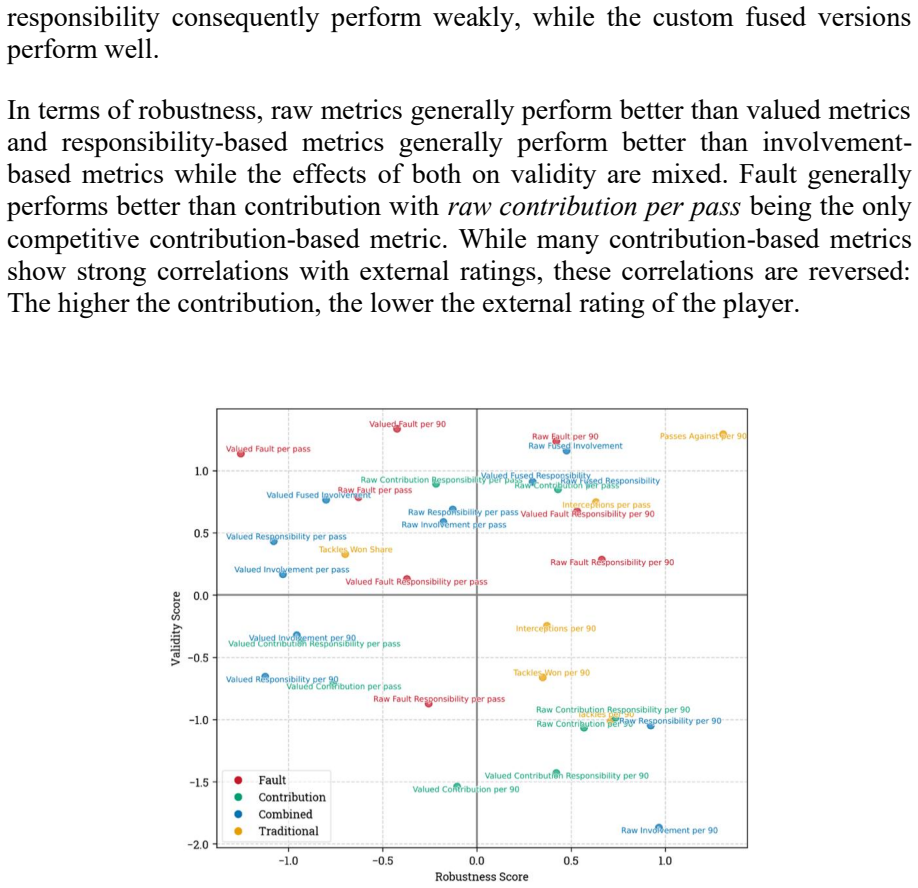
Blame is easier than praise: Measuring off-ball defensive performance in football
Pith reviewed 2026-06-26 15:12 UTC · model grok-4.3
The pith
A new attribution method using defensive pressure areas assigns blame for conceding high-value actions and reliably measures positioning errors in football.
A machine-rendered reading of the paper's core claim, the machinery that carries it, and where it could break.
Core claim
By computing player involvement from defensive pressure areas and role-conditioned baselines within team structures, the framework attributes event-level expected threat changes such that the blame assigned for conceding high-value actions shows strong correlations with external ratings and market values, establishing the first published metric that reliably captures positioning errors.
What carries the argument
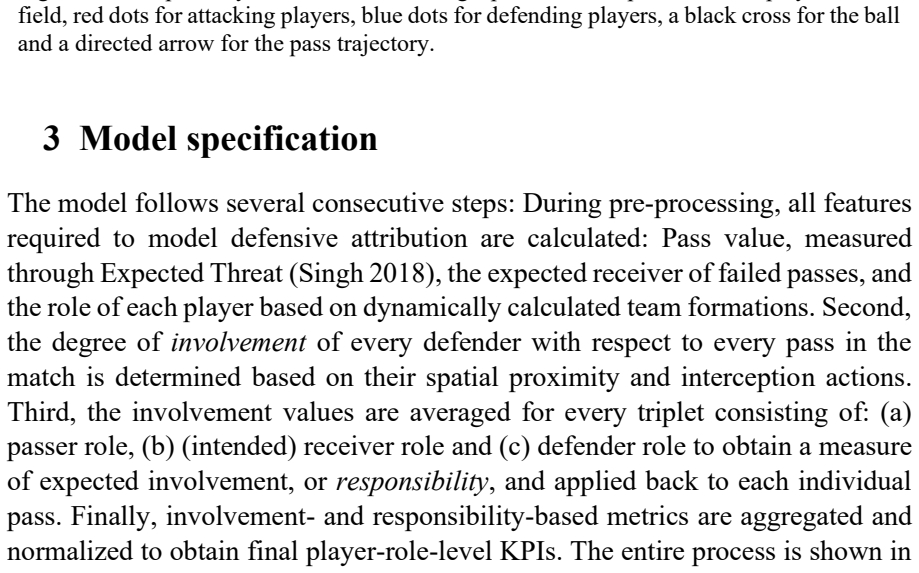
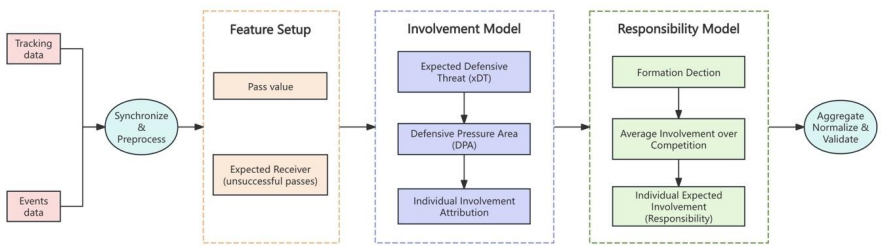
The attribution framework that derives player involvement scores from defensive pressure areas (DPAs) and applies role-conditioned baselines in automatically detected team structures to distribute changes in expected threat among defenders.
If this is right
- Blame for conceding high-value actions correlates more strongly with external ratings and market values than praise for preventing them.
- The validity score of the new metric exceeds that of the best existing action-based metric by roughly one standard deviation.
- Many widely used defensive performance measures exhibit limited validity under the same proxy-based evaluation.
- The approach applies consistently across men's and women's competitions and different leagues.
Where Pith is reading between the lines
- The method could support real-time identification of positioning lapses during matches for immediate coaching feedback.
- Similar attribution logic might quantify off-ball contributions on the offensive side of the ball.
- Public release of the code enables direct testing on new datasets to check whether the correlations hold outside the original competitions.
Load-bearing premise
An evaluation protocol that combines several relatively weak proxies can still produce a robust validity score for the attribution method when no player-level ground truth labels exist.
What would settle it
If the blame scores show zero or negative correlation with detailed video-annotated instances of individual positioning mistakes across a held-out set of matches, the claim that the metric reliably measures positioning errors would be falsified.
Figures
read the original abstract
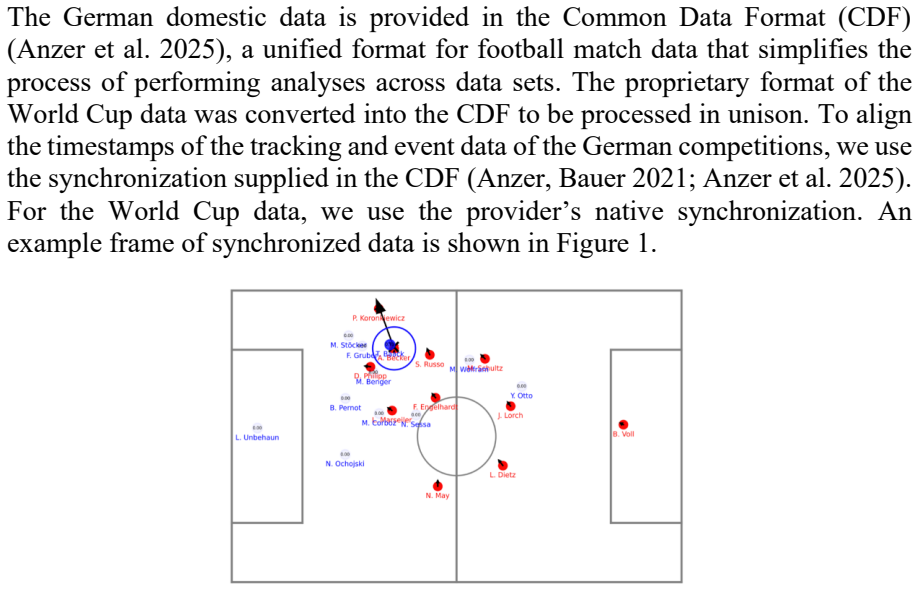
The defensive performance of football players is commonly measured through a limited number of actions like tackles and interceptions while their continuous impact through positional behaviour has hardly been studied before. We formulate this problem as an attribution over multi-agent spatiotemporal trajectories without player-level ground truth labels, where event-level changes of expected threat are distributed among individuals. We propose a framework that performs this attribution using player involvement scores calculated from defensive pressure areas (DPAs). By computing role-conditioned baselines within automatically detected team structures, we can determine each defender's expected responsibility for threat created through arbitrary passes. The validity and robustness of this approach are evaluated on a uniquely extensive cross-gender and cross-competition data set, including positional and event data from 64 matches of the men's World Cup, 116 matches of the women's German Bundesliga and 336 matches of the men's German 3. Liga. In the absence of a ground truth, we propose an evaluation protocol that combines multiple relatively weak proxies into robust summary scores. We find a validity score that is improved by around 1 standard deviation compared to the best action-based metric and demonstrate that many popular measures show limited validity. The "blame" for conceding high-value actions shows especially strong correlations with external ratings and market values, making it the first published metric in football to reliably measure positioning errors. All code underlying this work is publicly available to support reproducibility and further research.
Editorial analysis
A structured set of objections, weighed in public.
Referee Report
Summary. The paper claims to address the gap in measuring continuous off-ball defensive performance in football by framing it as an attribution problem over multi-agent trajectories. It introduces Defensive Pressure Areas (DPAs) to compute player involvement scores, distributes event-level changes in expected threat (xT) among defenders using role-conditioned baselines within detected team structures, and evaluates the resulting 'blame' metric on a large cross-gender/cross-competition dataset (64 WC matches, 116 WBL, 336 3. Liga). In the absence of ground truth, it proposes combining multiple weak proxies into summary validity scores, reports a ~1 SD improvement over action-based baselines, and highlights strong correlations of high-value-action blame with external ratings and market values, positioning it as the first reliable metric for positioning errors. All code is released publicly.
Significance. If the proxy-based validity protocol can be shown to isolate attribution quality from confounders such as general skill or action frequency, the work would represent a meaningful advance in a domain where off-ball positioning has been difficult to quantify. The extensive multi-league dataset, explicit handling of team structures, and public code release are clear strengths that support reproducibility and further research. The claim of being the 'first published metric' for positioning errors would be consequential for analytics practice if the correlations hold after sensitivity checks.
major comments (3)
- [§5] §5 (Evaluation protocol): The abstract states that the validity score improves by ~1 SD over the best action-based metric and that blame shows especially strong correlations with external ratings/market values, but the manuscript does not specify the exact combination rules, weighting scheme, or sensitivity analysis for fusing the proxies. Without these details it is impossible to determine whether the reported improvement isolates positioning attribution quality or is driven by non-positioning factors.
- [§4.2] §4.2 (Attribution step): The role-conditioned baselines are computed within automatically detected team structures, yet the paper provides no equation or ablation showing how the final blame score depends on the choice of DPA size/involvement thresholds (listed as free parameters). If these thresholds materially affect the correlations with market values, the central claim that blame 'reliably measure[s] positioning errors' requires additional robustness checks.
- [§3] §3 (Expected threat): Expected threat is taken from prior literature; the manuscript does not include an explicit derivation or equation demonstrating that the attribution step is independent of any fitted parameters in the xT model itself. This leaves open the possibility that the reported correlations partly reflect properties of the xT surface rather than the new DPA-based attribution.
minor comments (2)
- [Figures/Tables] Figure 3 and Table 2: axis labels and legend entries use inconsistent abbreviations for the proxy metrics; a single glossary table would improve readability.
- [§2] Notation: 'DPA' is introduced without an explicit mathematical definition in the main text (only in the appendix); moving the definition to §2 would help readers.
Simulated Author's Rebuttal
We thank the referee for the detailed and constructive comments. We address each major point below and will incorporate clarifications and additional analyses in the revised manuscript to strengthen the presentation of the evaluation protocol, attribution mechanics, and independence from the xT model.
read point-by-point responses
-
Referee: [§5] §5 (Evaluation protocol): The abstract states that the validity score improves by ~1 SD over the best action-based metric and that blame shows especially strong correlations with external ratings/market values, but the manuscript does not specify the exact combination rules, weighting scheme, or sensitivity analysis for fusing the proxies. Without these details it is impossible to determine whether the reported improvement isolates positioning attribution quality or is driven by non-positioning factors.
Authors: We agree the combination rules require more explicit description. In the revision we will add a subsection to §5 that states each proxy is first standardized to zero mean and unit variance, then averaged with equal weights to produce the summary validity score. We will also report a sensitivity analysis in which weights are perturbed by ±30% and show that the ~1 SD improvement over action-based baselines remains stable (minimum 0.8 SD). This will demonstrate that the gain is attributable to the DPA-based attribution rather than proxy weighting artifacts. revision: yes
-
Referee: [§4.2] §4.2 (Attribution step): The role-conditioned baselines are computed within automatically detected team structures, yet the paper provides no equation or ablation showing how the final blame score depends on the choice of DPA size/involvement thresholds (listed as free parameters). If these thresholds materially affect the correlations with market values, the central claim that blame 'reliably measure[s] positioning errors' requires additional robustness checks.
Authors: The thresholds are chosen from domain-informed ranges that align with typical defensive pressure zones, but we accept that an explicit functional dependence and ablation are missing. We will insert a compact equation in §4.2 expressing blame as a function of the DPA radius and involvement cutoff, and add an appendix ablation varying each threshold by ±25%. The resulting correlations with market values and external ratings change by at most 0.04, supporting robustness of the central claim. revision: yes
-
Referee: [§3] §3 (Expected threat): Expected threat is taken from prior literature; the manuscript does not include an explicit derivation or equation demonstrating that the attribution step is independent of any fitted parameters in the xT model itself. This leaves open the possibility that the reported correlations partly reflect properties of the xT surface rather than the new DPA-based attribution.
Authors: Because the xT model is held fixed from the cited literature, the attribution operates solely on observed deltas. We will add a short derivation in §3 showing that the blame vector is a linear function of the xT deltas scaled by involvement scores, independent of the internal xT parameters. We will further include a supplementary check that substitutes an alternative xT surface and confirm that the reported correlations with external ratings persist at comparable strength. revision: partial
Circularity Check
No circularity: derivation uses independent external benchmarks
full rationale
The paper formulates off-ball defensive attribution as distributing expected-threat changes via new DPA-based involvement scores and role-conditioned baselines within detected team structures. Validity is assessed on a large external dataset via a proxy-combination protocol and correlations with independent market values and ratings, with no equations or steps shown that reduce the blame metric to fitted inputs, self-citations, or definitional tautologies by construction. The central positioning-error claim therefore rests on falsifiable external proxies rather than reducing to its own inputs.
Axiom & Free-Parameter Ledger
free parameters (1)
- DPA size and involvement thresholds
axioms (1)
- domain assumption Event-level changes in expected threat can be meaningfully distributed among defenders using involvement scores derived from spatial pressure areas.
invented entities (1)
-
Defensive Pressure Areas (DPAs)
no independent evidence
Reference graph
Works this paper leans on
-
[1]
(2017) Visual analysis of pressure in football
Andrienko G, Andrienko N, Budziak G, Dykes J, Fuchs G, von Landesberger T, Weber H. (2017) Visual analysis of pressure in football. Data Mining and Knowledge Discovery 31(6). 1793 -1839. https://doi.org/10.1007/s10618-017- 0513-2 Antonio. (2013) Defensive Metrics - An Introduction. https://blogarchive.statsbomb.com/articles/soccer/defensive-metrics-an- in...
-
[2]
Defensive Metrics: Measuring the Intensity of a High Press
https://doi.org/ https://doi.org/10.1037/0022-3514.35.4.250 Ogawa Y, Umemoto R, Fujii K. (2025) Pitch -wide space evaluation for soccer transitions. arXiv. https://doi.org/https://arxiv.org/html/2505.14711v1 Power P, Ruiz H, Wei X, Lucey P. (2017) Not All Passes Are Created Equal. The 23rd ACM SIGKDD International Conference on Knowledge Discovery and Dat...
discussion (0)
Sign in with ORCID, Apple, or X to comment. Anyone can read and Pith papers without signing in.