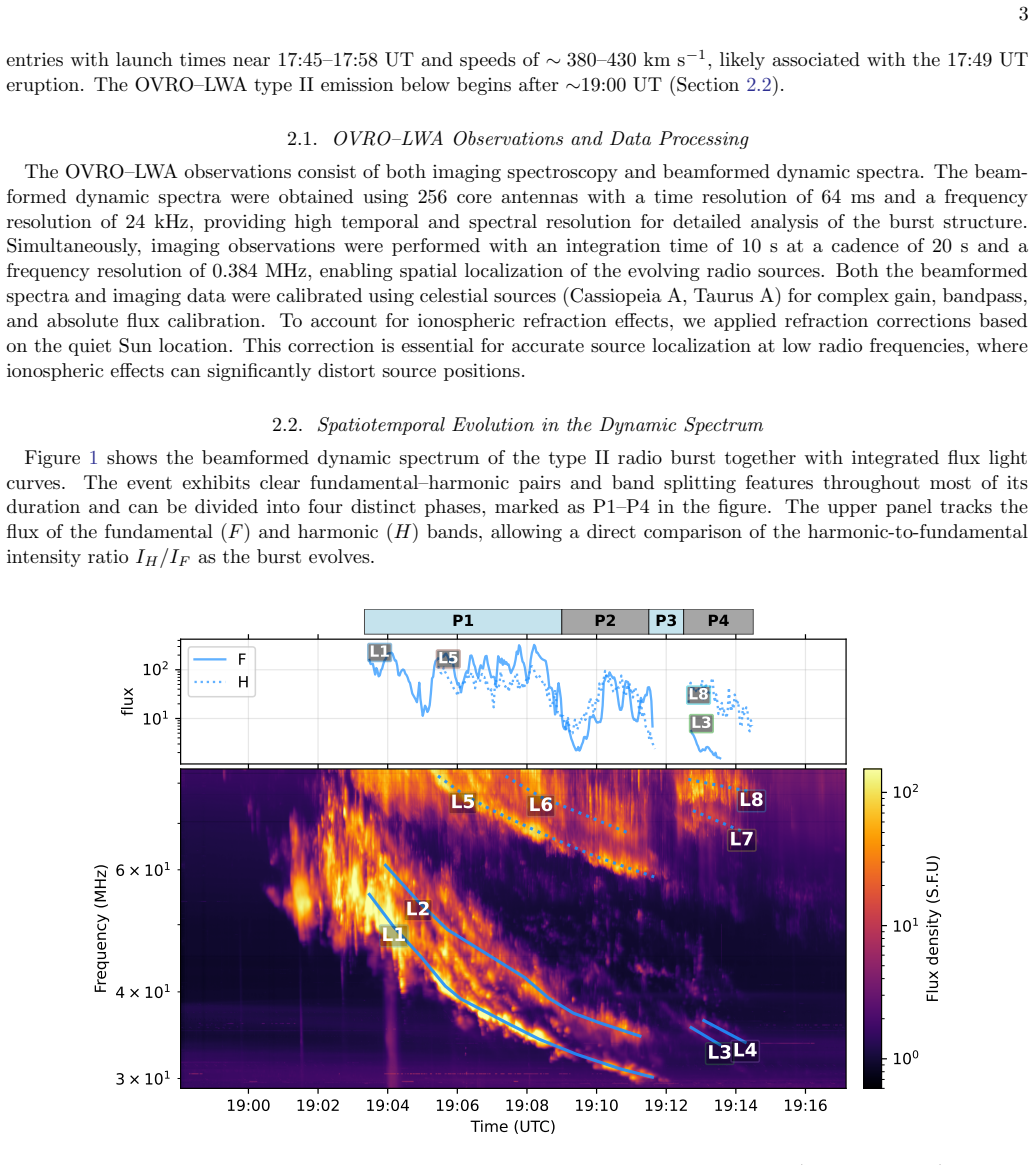
Radio Spectral Imaging and MHD Modeling of a CME-Driven Shock: Connecting Solar Type II Radio Bursts with Shock-Surface Magnetic Geometry
Pith reviewed 2026-06-26 15:14 UTC · model grok-4.3
The pith
Type II radio burst sources align with magnetic geometry on coronal shocks.
A machine-rendered reading of the paper's core claim, the machinery that carries it, and where it could break.
Core claim
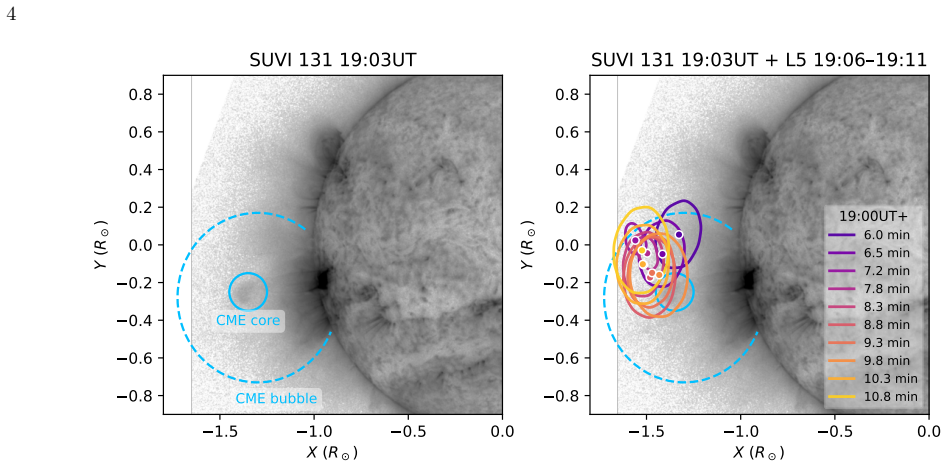
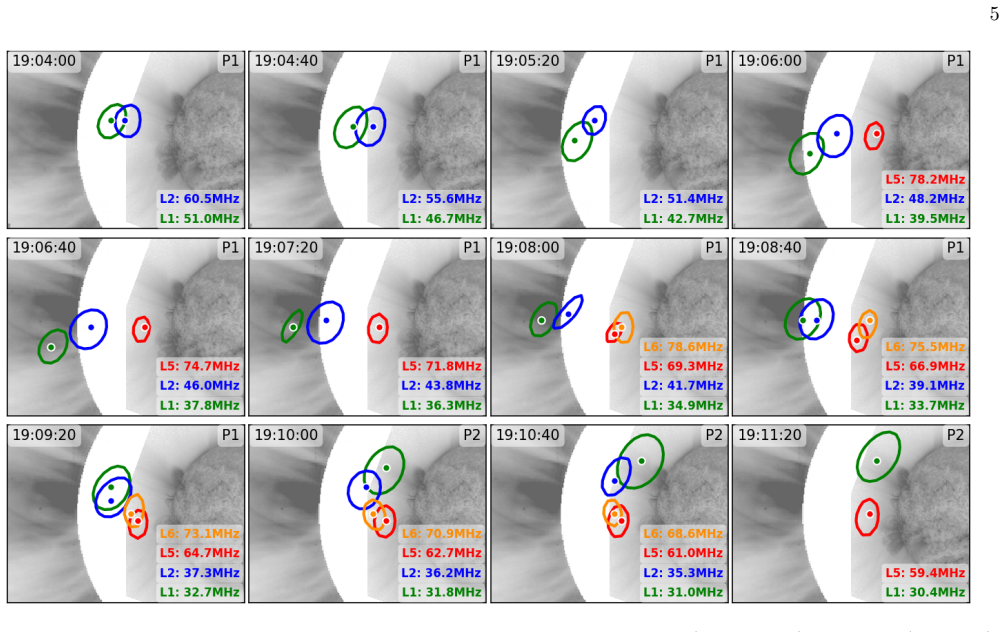
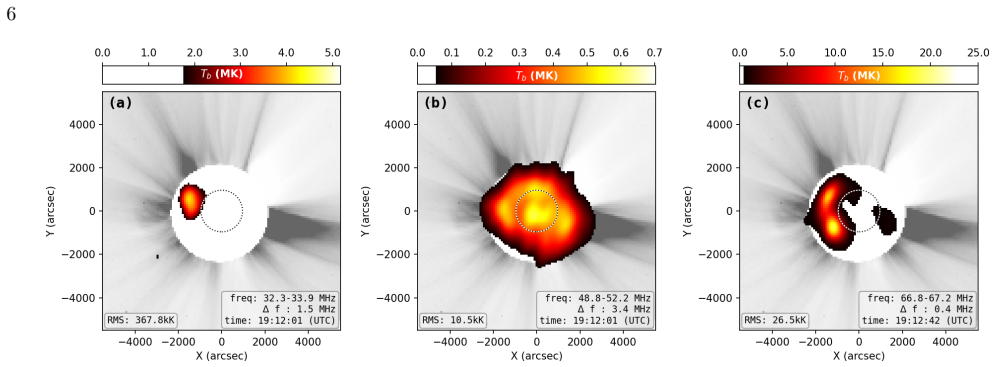
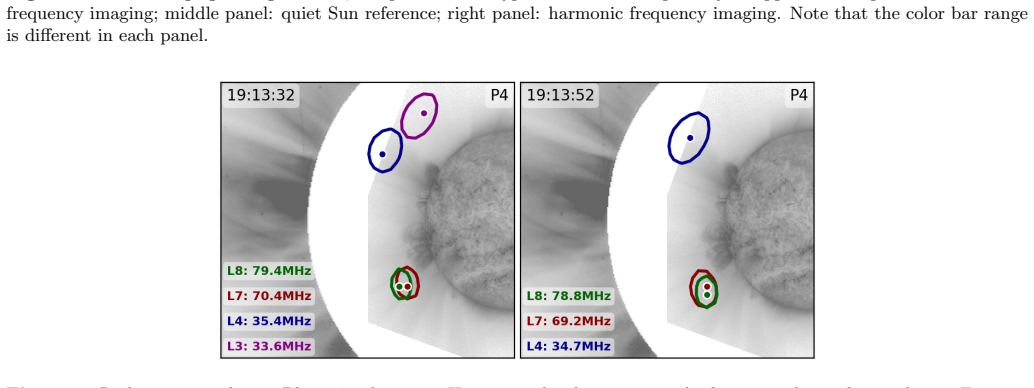
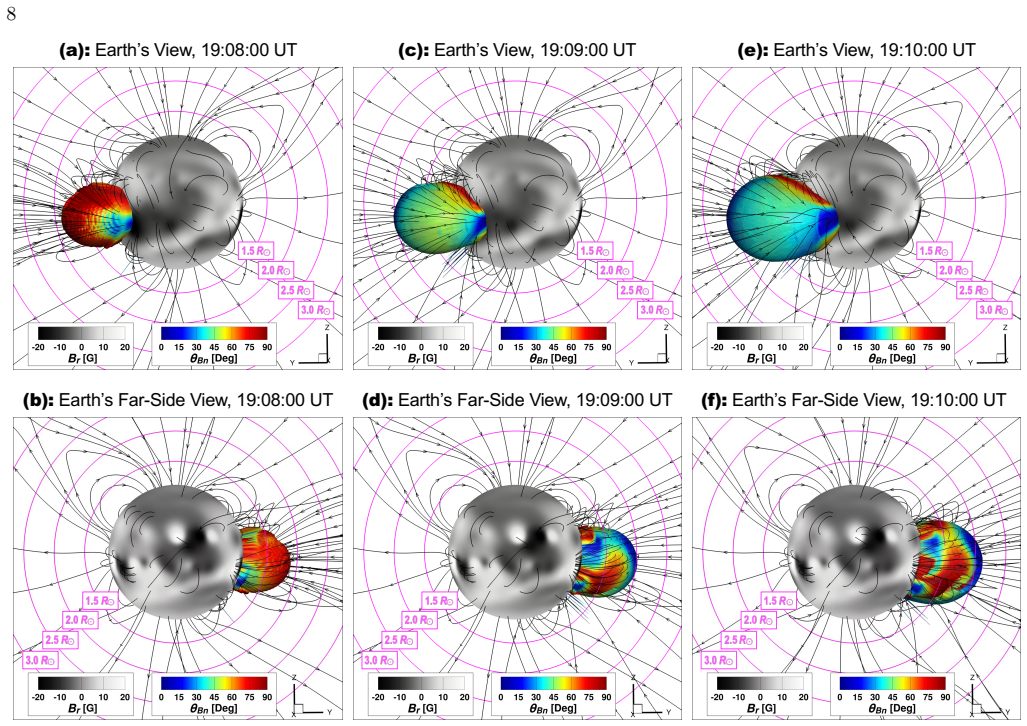
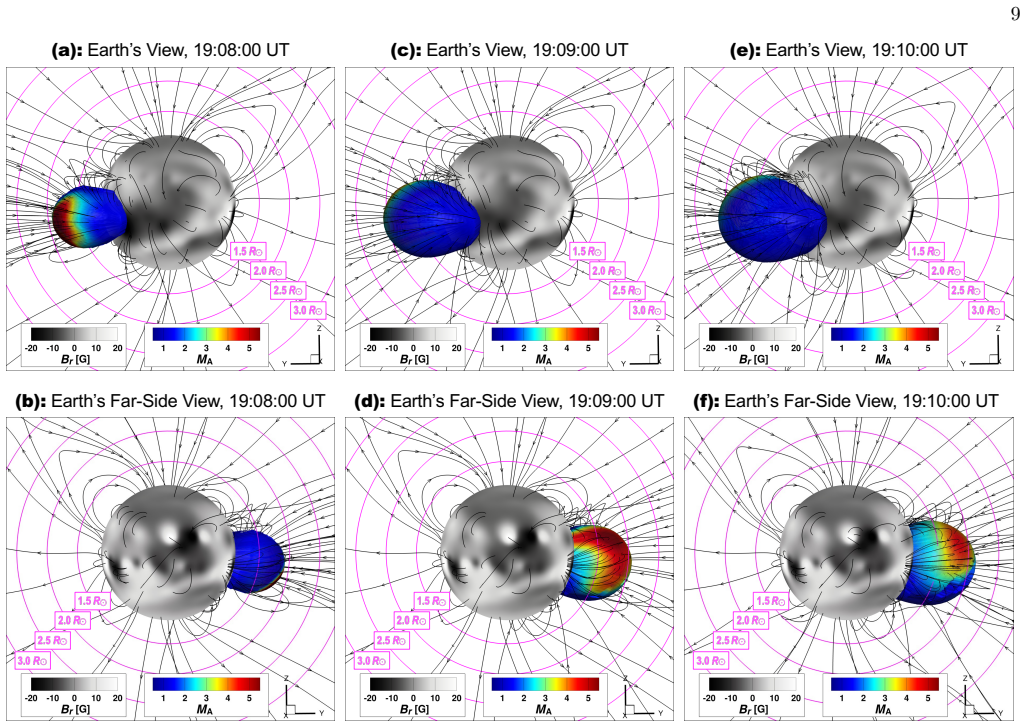
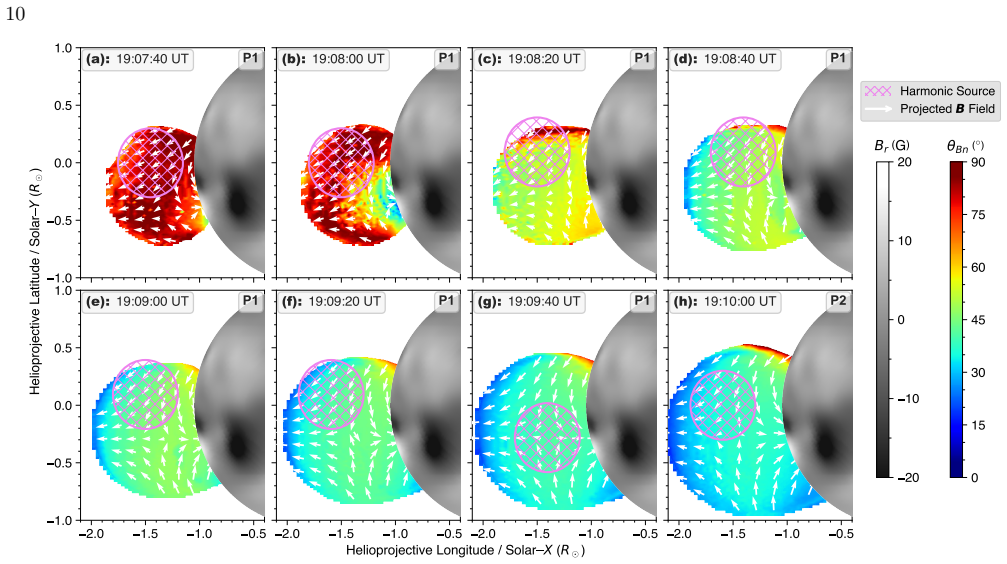
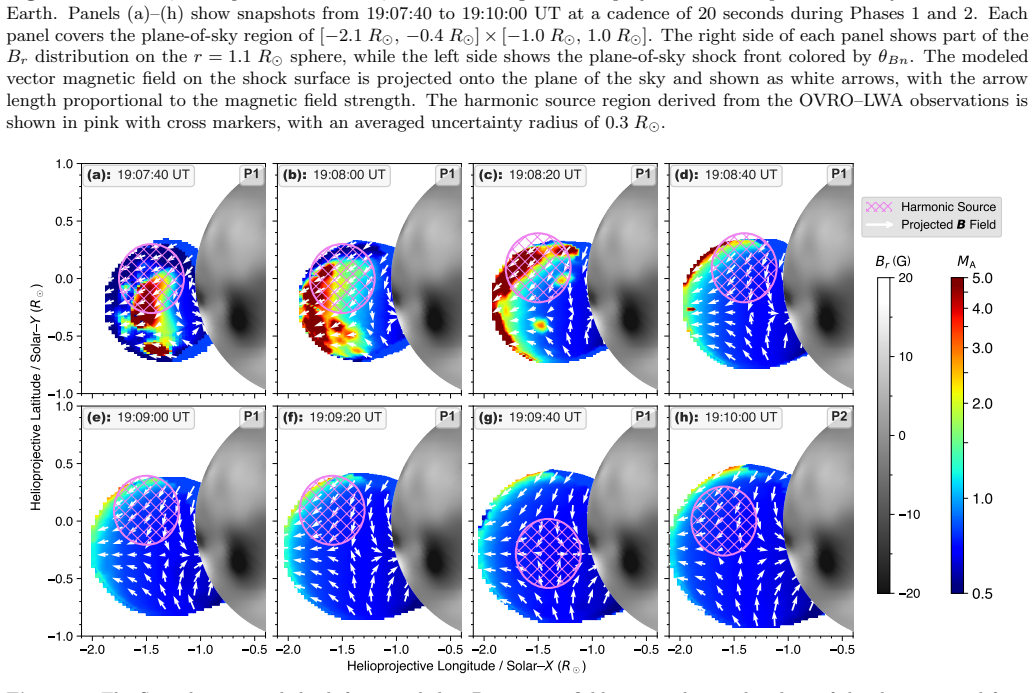
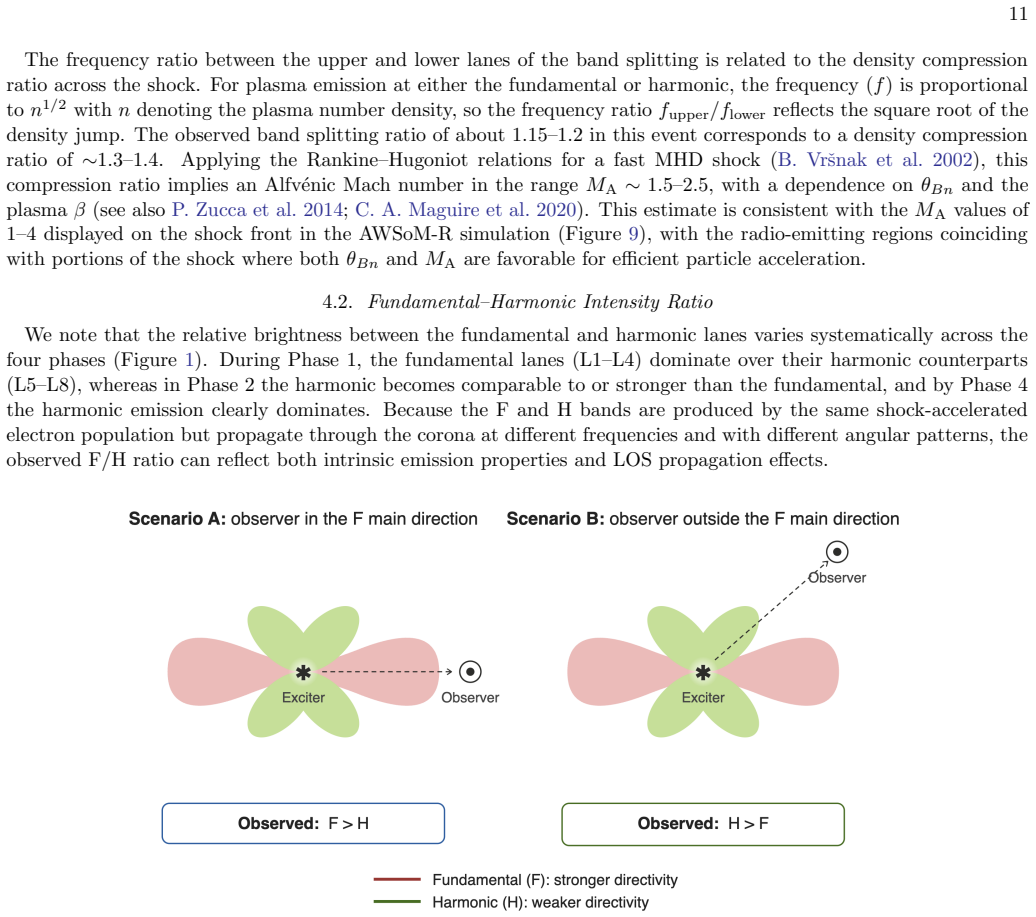
In this event, the burst intensity evolves from fundamental-emission dominated to harmonic-emission dominated. Meanwhile, the preferential emission source region moves from the Earth-facing side to the limb or far side, coinciding with quasi-perpendicular shock regions with enhanced Mach numbers. The observed spatial offset between the fundamental and harmonic sources is generally aligned with the projected shock-surface magnetic field from the simulation, consistent with anisotropic scattering in a magnetized turbulent plasma. These results establish a physical connection between type II radio sources and coronal shock magnetic geometry, providing new insight into the origin of the multi-la
What carries the argument
Alignment between observed radio source locations and the projected magnetic field on the simulated shock surface, which organizes emission regions and accounts for multi-lane structure via anisotropic scattering.
If this is right
- Multi-lane features in type II bursts can diagnose the magnetic obliquity and Mach number distribution across a coronal shock.
- Emission sources preferentially trace quasi-perpendicular regions where the shock is stronger.
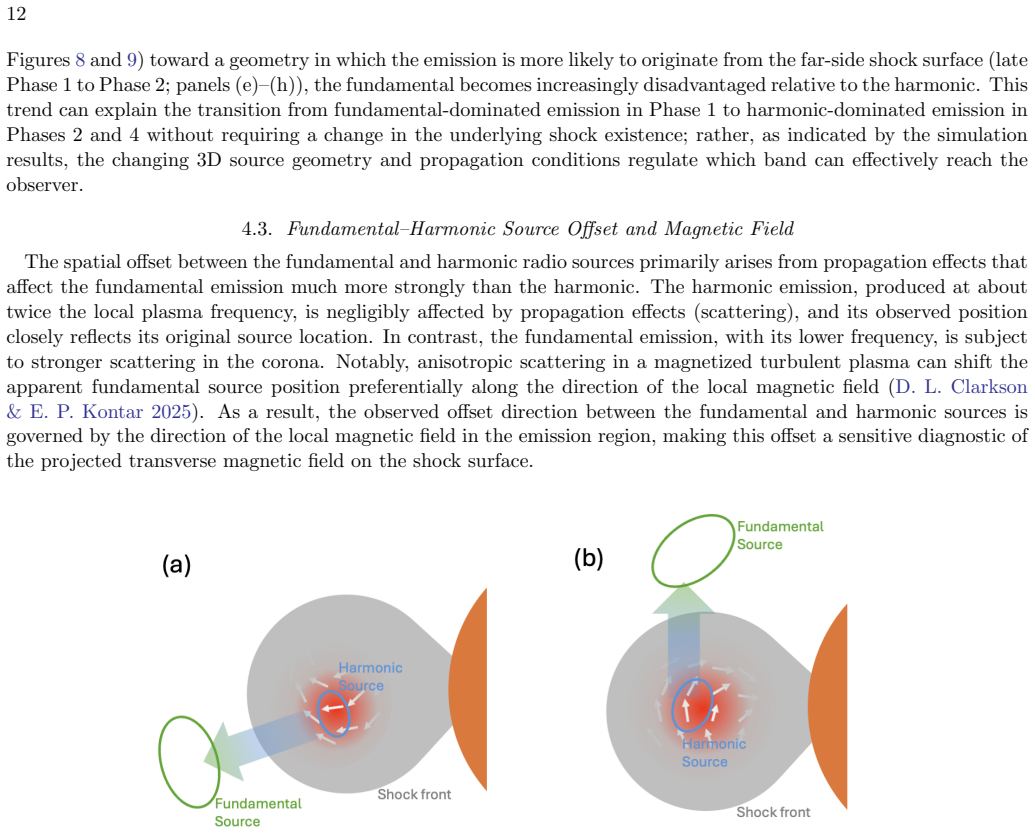
- Spatial offsets between fundamental and harmonic bands reflect the local magnetic field direction on the shock.
- The shift from fundamental to harmonic dominance tracks the shock's propagation into different magnetic geometries.
Where Pith is reading between the lines
- The same mapping technique could be applied to additional events to test whether lane spacing scales with local field strength.
- If the connection holds, radio data might supply remote estimates of shock obliquity that complement in-situ measurements.
- This geometry link may help refine models of electron acceleration sites within CME-driven shocks.
Load-bearing premise
The three-dimensional global MHD simulation accurately reproduces the real shock morphology, magnetic field configuration, and Mach number distribution for this event.
What would settle it
Radio source positions in high-resolution imaging that fail to coincide with the simulated quasi-perpendicular zones or magnetic field projections on the shock surface.
Figures
read the original abstract
Solar type II radio bursts are widely regarded as signatures of shock waves propagating in the solar corona and are of particular importance for understanding shock-driven particle acceleration processes. Type II radio bursts often exhibit complex multi-lane and split-band features. The detailed spectral, temporal, and spatial structures carry key information about the shock properties and evolution. However, the physical origin of the multi-lane and split-band features remains unclear, largely due to a lack of spatially resolved data and understanding of the concurrent shock morphology and its magnetic-field context. In this work, we combine radio imaging spectroscopy of a multi-lane, split-band type II burst event with a three-dimensional global magnetohydrodynamic simulation of the associated coronal mass ejection-driven shock using the Alfv\'en Wave Solar atmosphere Model-Realtime. In this event, the burst intensity evolves from fundamental-emission dominated to harmonic-emission dominated. Meanwhile, the preferential emission source region moves from the Earth-facing side to the limb or far side, coinciding with quasi-perpendicular shock regions with enhanced Mach numbers. The observed spatial offset between the fundamental and harmonic sources is generally aligned with the projected shock-surface magnetic field from the simulation, consistent with anisotropic scattering in a magnetized turbulent plasma. These results establish a physical connection between type II radio sources and coronal shock magnetic geometry, providing new insight into the origin of the multi-lane features and their diagnostics of coronal shocks.
Editorial analysis
A structured set of objections, weighed in public.
Referee Report
Summary. The manuscript combines radio spectral imaging spectroscopy of a multi-lane, split-band type II solar radio burst with a 3D global MHD simulation of the associated CME-driven shock using the AWSoM-R model. It reports that the burst evolves from fundamental- to harmonic-emission dominated, with the source region shifting toward quasi-perpendicular shock areas of enhanced Mach number; the observed fundamental-harmonic spatial offset aligns with the projected shock-surface magnetic field in the simulation, which the authors interpret as evidence for anisotropic scattering. The central claim is that these alignments establish a direct physical connection between type II radio sources and coronal shock magnetic geometry, offering diagnostics for the origin of multi-lane features.
Significance. If the simulation is demonstrated to reproduce the actual event morphology and Mach-number distribution, the work would offer a useful framework for interpreting complex type II burst structures in terms of shock geometry and scattering, advancing diagnostics of coronal shocks and particle acceleration. The integration of spatially resolved radio data with global MHD modeling is a constructive approach, though its impact depends on establishing the model's fidelity to observations.
major comments (3)
- [Abstract] Abstract: The claimed alignments between radio sources and simulation features (quasi-perpendicular regions, Mach-number enhancements, and magnetic-field projections) are presented without quantitative metrics, error bars, or statistical measures of agreement. This absence directly undermines the central claim that the observations establish a physical connection, as the reported spatial offsets could arise from model mismatch.
- [Results] Simulation and results sections: No quantitative validation is provided comparing simulated shock properties (e.g., CME leading-edge height, shock speed, or standoff distance) against coronagraph or EUV observations at the precise times of the radio bursts. Because the interpretation of source locations, multi-lane features, and scattering relies on the simulated magnetic geometry and Mach-number distribution matching reality, this validation gap is load-bearing for the conclusions.
- [Methods] Methods: The simulation is described as independent of the radio data, yet the absence of any cross-check against independent observables leaves open the possibility that the reported coincidences reflect tuning or selection rather than a genuine physical link.
minor comments (1)
- [Abstract] Notation for the model (Alfvén Wave Solar atmosphere Model-Realtime) should be standardized on first use and used consistently thereafter.
Simulated Author's Rebuttal
We thank the referee for the constructive comments, which highlight important areas for strengthening the manuscript. We agree that quantitative metrics and validation against independent observations are needed to support the central claims and will revise the paper accordingly.
read point-by-point responses
-
Referee: [Abstract] Abstract: The claimed alignments between radio sources and simulation features (quasi-perpendicular regions, Mach-number enhancements, and magnetic-field projections) are presented without quantitative metrics, error bars, or statistical measures of agreement. This absence directly undermines the central claim that the observations establish a physical connection, as the reported spatial offsets could arise from model mismatch.
Authors: We agree that the absence of quantitative metrics limits the strength of the presented alignments. In the revised manuscript we will add explicit measures, including the angular offset (with uncertainty) between the observed fundamental-harmonic source separation vector and the projected shock-surface magnetic-field direction, as well as the fractional overlap between radio source contours and regions of quasi-perpendicular geometry with Mach number above a stated threshold. These additions will allow a statistical evaluation of the reported spatial correspondences. revision: yes
-
Referee: [Results] Simulation and results sections: No quantitative validation is provided comparing simulated shock properties (e.g., CME leading-edge height, shock speed, or standoff distance) against coronagraph or EUV observations at the precise times of the radio bursts. Because the interpretation of source locations, multi-lane features, and scattering relies on the simulated magnetic geometry and Mach-number distribution matching reality, this validation gap is load-bearing for the conclusions.
Authors: We acknowledge that direct, time-specific validation of the simulated shock against coronagraph and EUV data is required. We will add a dedicated comparison subsection that reports the simulated CME leading-edge height, shock speed, and standoff distance at the epochs of the radio bursts and contrasts these quantities with measurements from LASCO C2/C3 and SDO/AIA EUV imaging. This will demonstrate that the modeled magnetic geometry and Mach-number distribution are consistent with the observed event morphology. revision: yes
-
Referee: [Methods] Methods: The simulation is described as independent of the radio data, yet the absence of any cross-check against independent observables leaves open the possibility that the reported coincidences reflect tuning or selection rather than a genuine physical link.
Authors: The AWSoM-R run was initialized with standard event-specific parameters (CME speed, direction, and background solar wind) taken from white-light and EUV observations and was not adjusted to reproduce the radio source locations. To close the validation gap we will include explicit cross-checks of the simulated shock front against independent EUV and coronagraph data, thereby showing that the reported alignments arise from the model physics rather than post-hoc selection. revision: yes
Circularity Check
No significant circularity detected
full rationale
The paper's central derivation combines radio imaging spectroscopy of an observed type II burst with an independent 3D global MHD simulation (AWSoM-R) of the associated CME-driven shock. The simulation is not fitted or tuned to the radio data; radio source locations are instead compared post hoc to simulated shock morphology, magnetic geometry, and Mach-number distributions. No self-definitional steps, fitted inputs renamed as predictions, load-bearing self-citations, or ansatzes smuggled via prior work appear in the abstract or described chain. The result is a correlative physical interpretation rather than a closed logical loop, making the derivation self-contained against external benchmarks.
Axiom & Free-Parameter Ledger
axioms (1)
- standard math Standard MHD equations and boundary conditions govern coronal plasma dynamics in the Alfvén Wave Solar atmosphere Model-Realtime
Reference graph
Works this paper leans on
-
[1]
Armstrong, T. P., Pesses, M. E., & Decker, R. B. 1985, Collisionless Shocks in the Heliosphere: Reviews of Current Research, 35, 271, doi: 10.1029/GM035p0271
-
[2]
Gombosi, T. I. 2017, Journal of Geophysical Research: Space Physics, 122, 7979, doi: 10.1002/2017JA024304
-
[3]
2011, Living Reviews in Solar Physics, 8, 1, doi: 10.12942/lrsp-2011-1
Chen, P. 2011, Living Reviews in Solar Physics, 8, 1, doi: 10.12942/lrsp-2011-1
-
[4]
2025, ApJL, 990, L50, doi: 10.3847/2041-8213/adfa71
Chen, X., Chen, B., Yu, S., et al. 2025, ApJL, 990, L50, doi: 10.3847/2041-8213/adfa71
-
[5]
2025, ApJ, 994, 242, doi: 10.3847/1538-4357/ae1227
Chen, X., Zhao, L., Giacalone, J., et al. 2025, ApJ, 994, 242, doi: 10.3847/1538-4357/ae1227
-
[6]
Clarkson, D. L., & Kontar, E. P. 2025, ApJ, 978, 73, doi: 10.3847/1538-4357/ad969c
-
[7]
Corti, C., Kuznetsova, M. M., Reiss, M., et al. 2026, ESS Open Archive, doi: 10.22541/essoar.176824639.92354528/v1
-
[8]
Darnel, J. M., Seaton, D. B., Bethge, C., et al. 2022, Space Weather, 20, e2022SW003044, doi: 10.1029/2022SW003044
-
[9]
Gibson, S. E., & Low, B. 1998, ApJ, 493, 460, doi: 10.1086/305107
-
[10]
Gopalswamy, N., Yashiro, S., Michalek, G., et al. 2009,
2009
-
[11]
Earth, Moon, and Planets, 104, 295, doi: 10.1007/s11038-008-9282-7
-
[12]
1996, Science, 272, 1284, doi: 10.1126/science.272.5266.1284
Harvey, J., Hill, F., Hubbard, R., et al. 1996, Science, 272, 1284, doi: 10.1126/science.272.5266.1284
-
[13]
Hegedus, A. M., Manchester IV, W. B., & Kasper, J. C. 2021, ApJ, 922, 203, doi: 10.3847/1538-4357/ac2361
-
[14]
2018, Space Weather, 16, 1488, doi: 10.1029/2018SW002001
Hill, F. 2018, Space Weather, 16, 1488, doi: 10.1029/2018SW002001
-
[15]
Holman, G. D., & Pesses, M. E. 1983, ApJ, 267, 837, doi: 10.1086/160918 6 https://www.nas.nasa.gov/hecc/ 7 https://tacc.utexas.edu/
-
[16]
2025, SoPh, 300, 168, doi: 10.1007/s11207-025-02589-8
Monstein, C. 2025, SoPh, 300, 168, doi: 10.1007/s11207-025-02589-8
-
[17]
2017, ApJ, 834, 173, doi: 10.3847/1538-4357/834/2/173
Jin, M., Manchester, W., van der Holst, B., et al. 2017, ApJ, 834, 173, doi: 10.3847/1538-4357/834/2/173
-
[18]
2020, ApJ, 896, 136, doi: 10.3847/1538-4357/ab8e32
Kong, F.-J., & Qin, G. 2020, ApJ, 896, 136, doi: 10.3847/1538-4357/ab8e32
-
[19]
Kontar, E. P., Yu, S., Kuznetsov, A. A., et al. 2017, Nature Communications, 8, doi: 10.1038/s41467-017-01597-8
-
[20]
Liu, W., Liu, X., Lario, D., et al. 2026a, arXiv preprint arXiv:2606.02445, doi: 10.48550/arXiv.2606.02445
work page internal anchor Pith review Pith/arXiv arXiv doi:10.48550/arxiv.2606.02445
-
[21]
Liu, W., Sokolov, I. V., Zhao, L., et al. 2025, ApJ, 985, 82, doi: 10.3847/1538-4357/adc4e3
-
[22]
Liu, W., Zhao, L., Sokolov, I. V., et al. 2026b, Space Weather, 24, e2025SW004811, doi: 10.1029/2025SW004811
-
[23]
Liu, X., Liu, W., Manchester IV, W. B., et al. 2026, ApJ, 997, 243, doi: 10.3847/1538-4357/ae290f
-
[24]
Maguire, C. A., Carley, E. P., McCauley, J., & Gallagher, P. T. 2020, A&A, 633, A56, doi: 10.1051/0004-6361/201936449
-
[25]
2005, ApJ, 622, 1225, doi: 10.1086/427768
Manchester, W., Gombosi, T., De Zeeuw, D., et al. 2005, ApJ, 622, 1225, doi: 10.1086/427768
-
[26]
2025, ApJ, 992, 51, doi: 10.3847/1538-4357/adf855
Manchester, W., Sachdeva, N., Kilpua, E., et al. 2025, ApJ, 992, 51, doi: 10.3847/1538-4357/adf855
-
[27]
1994, in Fragmented Energy Release in Sun and Stars, ed
Mann, G. 1994, in Fragmented Energy Release in Sun and Stars, ed. G. H. J. van den Oord (Dordrecht: Springer), 199–203, doi: 10.1007/978-94-011-1014-3 27
-
[28]
Carley, E. P. 2019, A&A, 623, doi: 10.1051/0004-6361/201834078
-
[29]
Morosan, D. E., Jebaraj, I. C., Zhang, P., et al. 2025, A&A, 695, A70, doi: 10.1051/0004-6361/202452775
-
[30]
J., & Melrose, D
Nelson, G. J., & Melrose, D. B. 1985, Solar Radiophysics: Studies of Emission from the Sun at Metre Wavelengths, 333 15
1985
-
[31]
E., Zhang, P., Zucca, P., & Vainio, R
Normo, S., Morosan, D. E., Zhang, P., Zucca, P., & Vainio, R. 2025, A&A, 698, A175, doi: 10.1051/0004-6361/202553702
-
[32]
Reid, H. A. S., & Ratcliffe, H. 2014, Research in Astronomy and Astrophysics, 14, 773, doi: 10.1088/1674-4527/14/7/003
-
[33]
Reiss, M. A., Arge, C. N., Henney, C. J., et al. 2023, Advances in Space Research, doi: 10.1016/j.asr.2023.08.039
-
[34]
Robinson, P. A., & Cairns, I. H. 2000, Geophysical Monograph Series, 119, 37, doi: 10.1029/GM119p0037
-
[35]
Sachdeva, N., van Der Holst, B., Manchester, W., et al. 2019, ApJ, 887, 83, doi: 10.3847/1538-4357/ab4f5e
-
[36]
2022, ApJ, 928, 34, doi: 10.3847/1538-4357/ac52ab
Shi, T., Manchester, W., Landi, E., et al. 2022, ApJ, 928, 34, doi: 10.3847/1538-4357/ac52ab
-
[37]
Smerd, S. F., Sheridan, K. V., & Stewart, R. T. 1974, Astrophysics and Space Science, 27, 243, doi: 10.1007/BF00645163
-
[38]
V., van der Holst, B., Oran, R., et al
Sokolov, I. V., van der Holst, B., Oran, R., et al. 2013, ApJ, 764, 23, doi: 10.1088/0004-637X/764/1/23
-
[39]
Sokolov, I. V., van der Holst, B., Manchester, W., et al. 2021, ApJ, 908, 172, doi: 10.3847/1538-4357/abc000
-
[40]
Stanzione, D., West, J., Evans, R. T., et al. 2020, in Practice and Experience in Advanced Research Computing 2020: Catch the Wave (Association for Computing Machinery), 106–111, doi: 10.1145/3311790.3396656 van der Holst, B., Sokolov, I. V., Meng, X., et al. 2014, ApJ, 782, 81, doi: 10.1088/0004-637X/782/2/81 Vrˇ snak, B., Magdaleni´ c, J., & Aurass, H. ...
-
[41]
Zhang, P., Morosan, D. E., Zucca, P., et al. 2024, A&A, 684, L22, doi: 10.1051/0004-6361/202449365
-
[42]
Zhang, P., Wang, C., & Kontar, E. P. 2021, ApJ, 909, 195, doi: 10.3847/1538-4357/abd8c5
-
[43]
2024, Space Weather, 22, e2023SW003729, doi: 10.1029/2023SW003729
Zhao, L., Sokolov, I., Gombosi, T., et al. 2024, Space Weather, 22, e2023SW003729, doi: 10.1029/2023SW003729
-
[44]
2014, ApJ, 795, 68, doi: 10.1088/0004-637X/795/1/68
Zucca, P., Pick, M., D´ emoulin, P., et al. 2014, ApJ, 795, 68, doi: 10.1088/0004-637X/795/1/68
-
[45]
2025, A&A, 703, A271, doi: 10.1051/0004-6361/202554348
Zucca, P., Zhang, P., Kozarev, K., et al. 2025, A&A, 703, A271, doi: 10.1051/0004-6361/202554348
discussion (0)
Sign in with ORCID, Apple, or X to comment. Anyone can read and Pith papers without signing in.