Intraday Optical Variability of BL Lacertae during its Highly Active 2020-2024 Phase
Pith reviewed 2026-06-26 11:56 UTC · model grok-4.3
The pith
BL Lacertae displayed significant intraday optical variability in 88 of 117 light curves during its active 2020-2024 phase, showing a bluer-when-brighter trend consistent with synchrotron jet emission.
A machine-rendered reading of the paper's core claim, the machinery that carries it, and where it could break.
Core claim
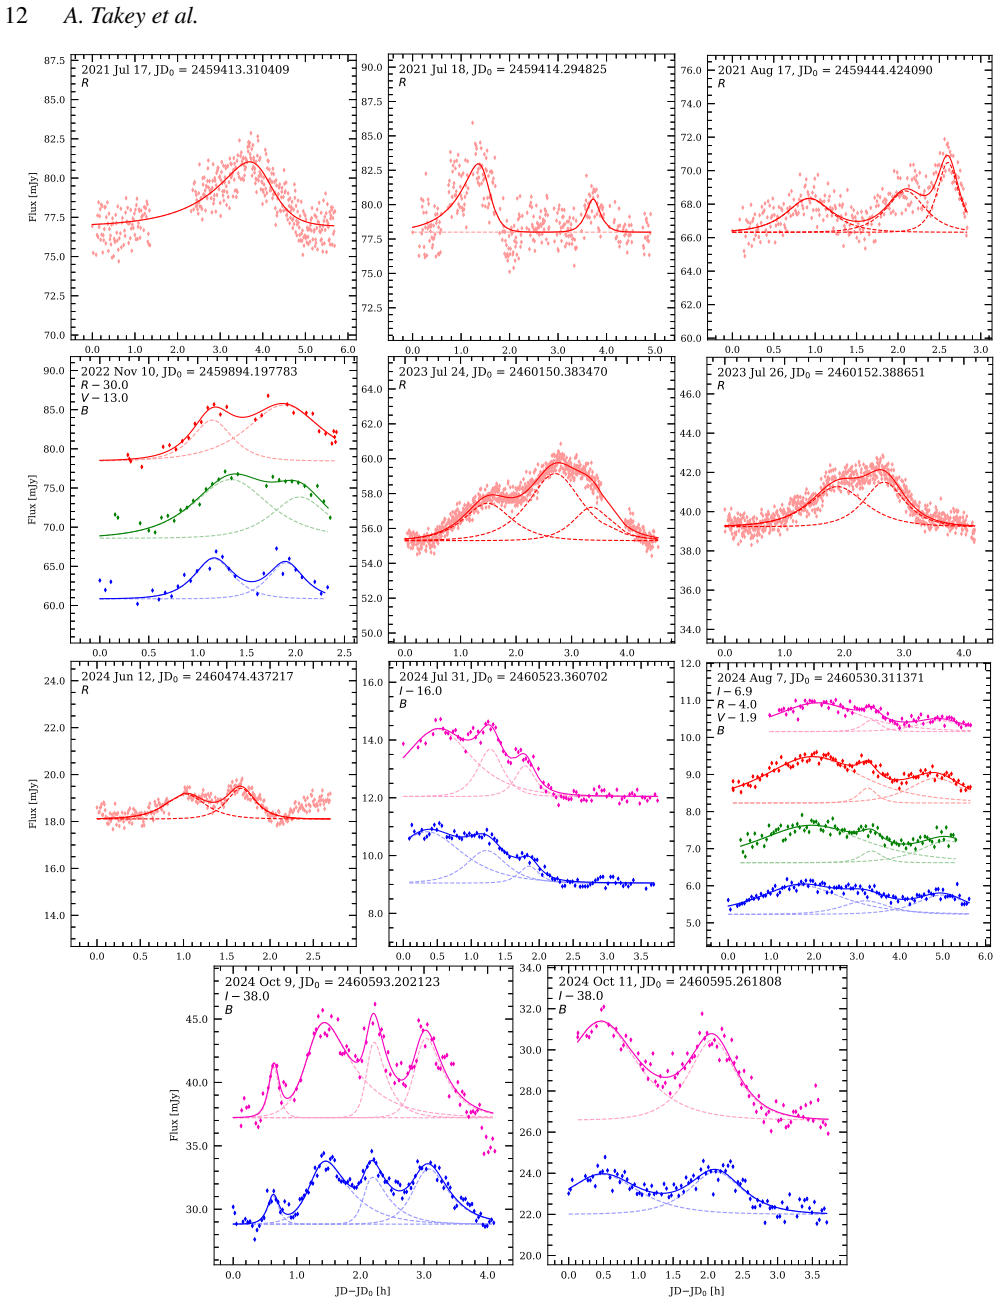
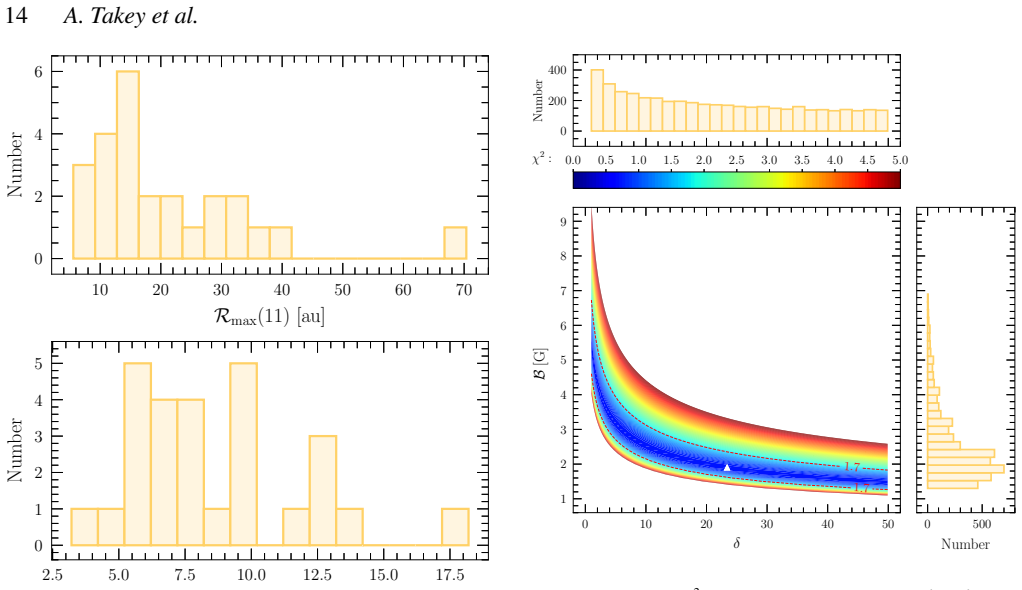
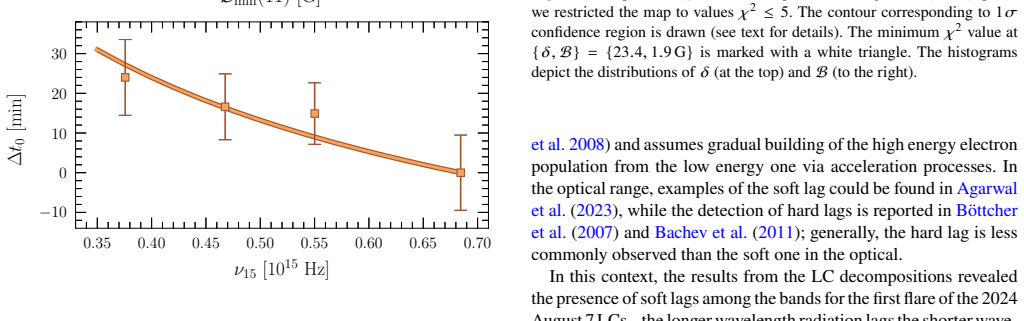
During 2020-2024, BL Lacertae was in an exceptionally active phase where intraday flux variability occurred commonly, detected in 88 out of 117 BVRI light curves. Spectral analysis shows a bluer-when-brighter trend during flares, supporting a synchrotron origin. Double-exponential modeling of well-sampled flares yields rise and decay timescales that constrain particle acceleration and cooling, while soft time lags in one multi-band flare allow derivation of the Doppler factor and magnetic field strength of the emitting region. Limits on emitting region radii and magnetic fields follow from a turbulent jet model.
What carries the argument
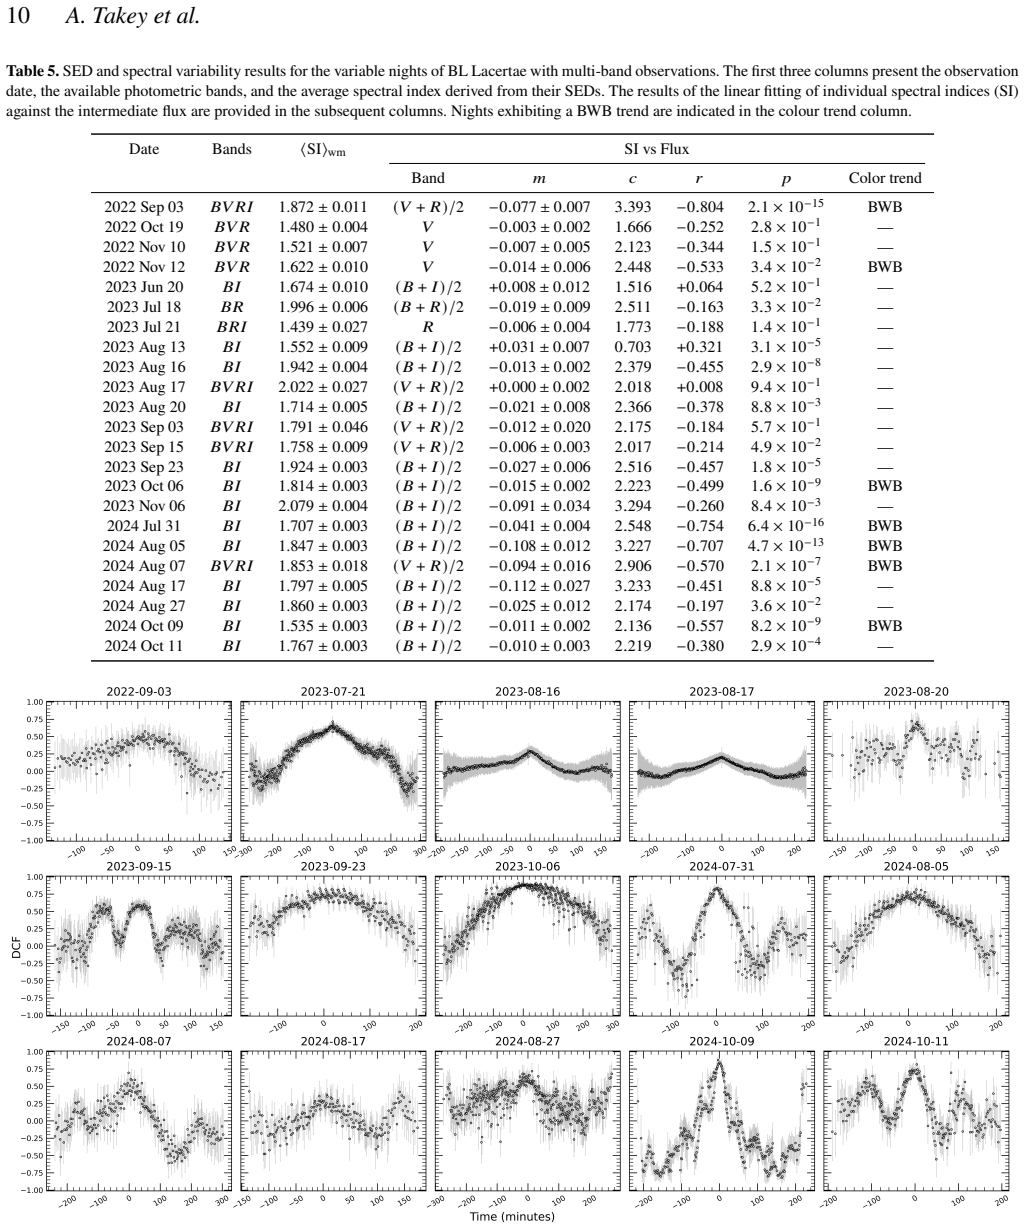
Power-enhanced F-test and nested ANOVA tests for variability detection, double-exponential modeling of flare profiles, and inter-band time-lag analysis to derive Doppler factor and magnetic field.
If this is right
- Intraday variability is a common phenomenon in BL Lacertae during high-flux states.
- The bluer-when-brighter trend indicates synchrotron emission from the jet.
- Derived rise and decay timescales constrain particle acceleration and cooling processes.
- Time-lag analysis provides specific estimates for the Doppler factor and magnetic field strength.
- The study sets limits on the radii and magnetic field strengths of the emitting regions.
Where Pith is reading between the lines
- Comparable high-cadence campaigns on other blazars could test whether frequent intraday variability is tied to high-activity states across the class.
- The derived jet parameters offer benchmarks for numerical simulations of turbulent emission regions.
- Extending the time-lag method to simultaneous X-ray or gamma-ray data could map multi-zone structure in the jet.
Load-bearing premise
The detected variability is intrinsic to the source jet and not significantly contaminated by atmospheric effects, instrumental systematics, or source confusion.
What would settle it
Space-based photometry of the same epochs that finds no significant variability or lacks the bluer-when-brighter trend would falsify the intrinsic origin and jet-emission interpretation.
Figures
read the original abstract
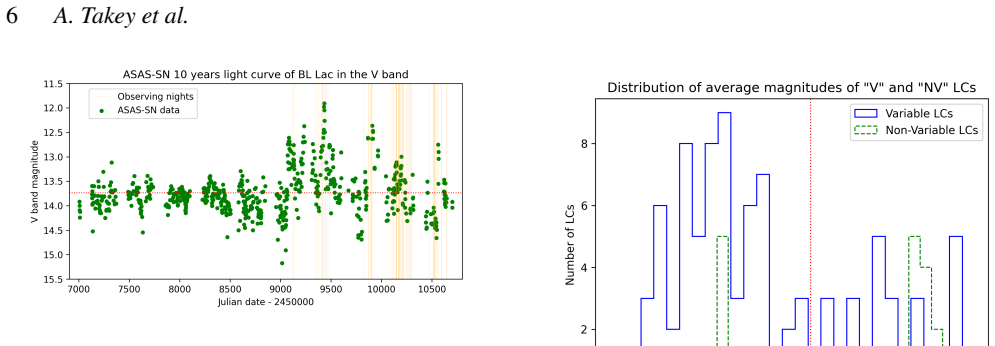
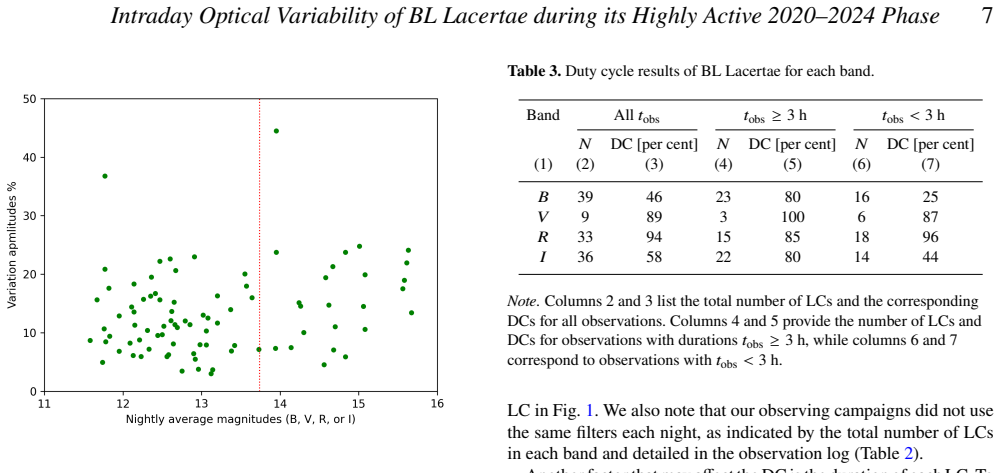
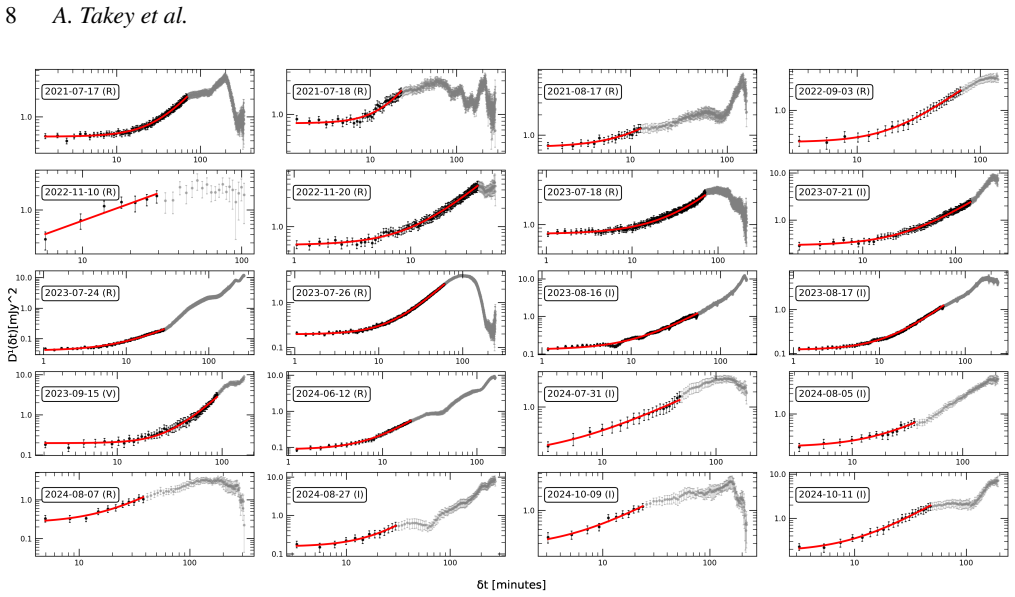
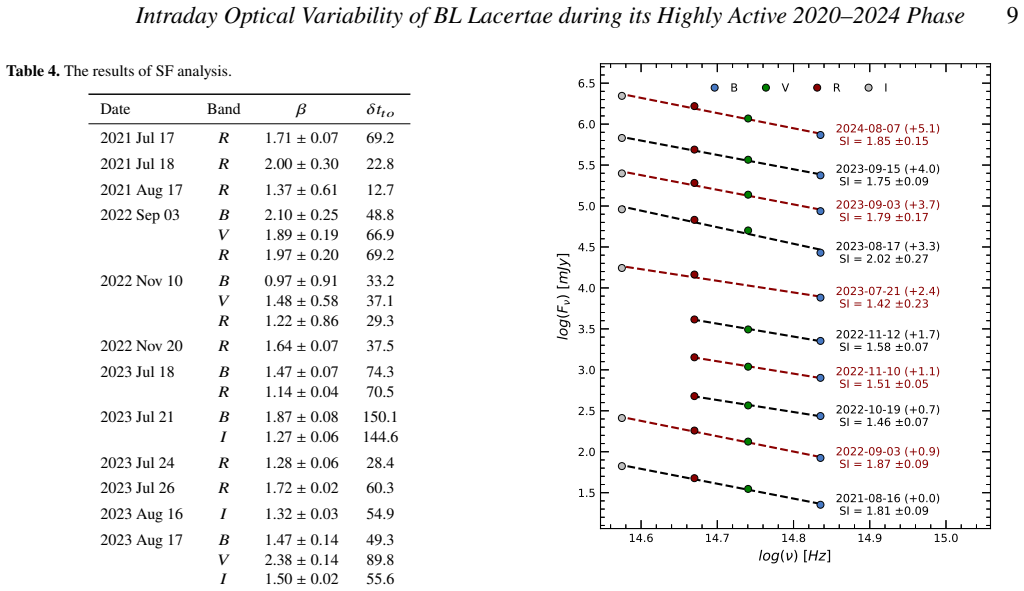
We present an analysis of the intraday flux and spectral variability of BL Lacertae from 2020 September 30 to 2024 December 7, covering its highest recorded brightness and low, intermediate, and high flux states. Our study involved 62 nights of multi-band (BVRI) optical monitoring using four ground-based telescopes located in Egypt, T\"urkiye, and Bulgaria. We assessed intraday flux variability using the power-enhanced F-test and the nested ANOVA test. Significant variability was detected in 88 out of 117 light curves, consistent with previous studies of this object during active epochs. The maximum variability amplitude is 44.5 per cent in the B band. Spectral analysis reveals a bluer-when-brighter trend during intraday flares, supporting a synchrotron origin for the variable emission. For a subset of well-sampled flares, we model their profiles with a double exponential function, deriving rise and decay time-scales, thereby constraining the characteristic times of particle acceleration and cooling processes within the relativistic jet. Assuming a turbulent jet model, we determined limits on the radii and magnetic field strengths of the emitting regions. We detected soft time lags for a multi-band flare and from their analysis, derived the Doppler factor and magnetic field strength of the corresponding emitting region. Our long-term, high-cadence study confirms that BL Lacertae was in an exceptionally active phase during the 2020-2024 period, with intraday variability being a common phenomenon. The results underscore the dynamic nature of the jet emission region and provide valuable observational constraints for models of blazar variability and jet physics.
Editorial analysis
A structured set of objections, weighed in public.
Referee Report
Summary. The manuscript reports multi-band (BVRI) intraday optical monitoring of BL Lacertae over 62 nights (2020 Sep 30 to 2024 Dec 7) from four ground-based telescopes. Using the power-enhanced F-test and nested ANOVA, significant variability is claimed in 88 of 117 light curves, with a maximum amplitude of 44.5% in B. Additional results include a bluer-when-brighter spectral trend, double-exponential modeling of selected flares to extract rise/decay timescales, limits on emitting-region radii and B-fields under a turbulent jet model, and soft time-lag analysis yielding a Doppler factor and magnetic-field strength. The work concludes that BL Lacertae was in an exceptionally active phase with intraday variability as a common feature.
Significance. A multi-year, high-cadence campaign spanning low-to-high states supplies a large sample of intraday light curves that, if the variability detections hold, can constrain particle-acceleration and cooling timescales as well as jet microphysical parameters. The reported detection fraction and derived quantities would add to the observational basis for synchrotron-jet models during active epochs.
major comments (3)
- [Section describing the application of the power-enhanced F-test and nested ANOVA (variability analysis)] The central claim that intrinsic jet variability is detected in 88/117 light curves rests on the power-enhanced F-test and nested ANOVA applied to ground-based photometry from four separate telescopes. The manuscript provides no quantitative description of how photometric errors were derived, whether ensemble comparison stars were used to remove common-mode atmospheric or instrumental signals, or whether the tests were validated on simulated light curves that include realistic airmass-dependent extinction and red-noise components. Without these controls, the reported detection statistics and all subsequent physical inferences (timescales, Doppler factor, B-field) cannot be confidently attributed to the source rather than systematics.
- [Section on flare-profile modeling] For the subset of flares modeled with the double-exponential function, the manuscript should report the goodness-of-fit statistics (reduced χ², degrees of freedom) and the formal uncertainties on the fitted rise and decay timescales. These quantities are required to evaluate whether the derived acceleration and cooling times are robust or dominated by sampling and noise properties.
- [Section on multi-band time-lag analysis] The time-lag analysis that yields the Doppler factor and magnetic-field strength assumes a specific geometric and emission model for the flaring region. The manuscript must state the exact assumptions, the measured lag value with its uncertainty, and the propagation of that uncertainty into the derived parameters.
minor comments (2)
- [Abstract and results summary] The abstract states that 'limits on the radii and magnetic field strengths' were obtained but does not indicate whether these are formal 1σ bounds or order-of-magnitude estimates; this should be clarified in the text and any associated table.
- [Data presentation] Full data tables or a machine-readable archive of the 117 light curves (with timestamps, magnitudes, and errors) should be provided or linked, as the absence of these prevents independent verification of the statistical tests.
Simulated Author's Rebuttal
We thank the referee for the detailed and constructive report. The comments highlight areas where additional methodological transparency is needed, and we address each point below with plans for revision.
read point-by-point responses
-
Referee: [Section describing the application of the power-enhanced F-test and nested ANOVA (variability analysis)] The central claim that intrinsic jet variability is detected in 88/117 light curves rests on the power-enhanced F-test and nested ANOVA applied to ground-based photometry from four separate telescopes. The manuscript provides no quantitative description of how photometric errors were derived, whether ensemble comparison stars were used to remove common-mode atmospheric or instrumental signals, or whether the tests were validated on simulated light curves that include realistic airmass-dependent extinction and red-noise components. Without these controls, the reported detection statistics and all subsequent physical inferences (timescales, Doppler factor, B-field) cannot be confidently attributed to the source rather than systematics.
Authors: We agree that the current manuscript lacks sufficient detail on these aspects of the variability analysis. Photometric uncertainties were estimated from the scatter in the comparison-star light curves, and an ensemble of comparison stars was employed to correct for common-mode effects, but these steps were not described quantitatively. In the revised manuscript we will add an explicit subsection on data reduction that reports the error estimation procedure, confirms the use of ensemble photometry, and includes a validation test on simulated light curves that incorporate airmass-dependent extinction and red-noise properties. This will strengthen the attribution of the detected variability to the source. revision: yes
-
Referee: [Section on flare-profile modeling] For the subset of flares modeled with the double-exponential function, the manuscript should report the goodness-of-fit statistics (reduced χ², degrees of freedom) and the formal uncertainties on the fitted rise and decay timescales. These quantities are required to evaluate whether the derived acceleration and cooling times are robust or dominated by sampling and noise properties.
Authors: The referee is correct that goodness-of-fit metrics and parameter uncertainties were not reported for the double-exponential fits. In the revised version we will tabulate the reduced χ², degrees of freedom, and 1σ uncertainties on the rise and decay timescales for each modeled flare, allowing readers to assess the robustness of the derived particle-acceleration and cooling timescales. revision: yes
-
Referee: [Section on multi-band time-lag analysis] The time-lag analysis that yields the Doppler factor and magnetic-field strength assumes a specific geometric and emission model for the flaring region. The manuscript must state the exact assumptions, the measured lag value with its uncertainty, and the propagation of that uncertainty into the derived parameters.
Authors: We will expand the time-lag section to state the precise geometric and emission-model assumptions (including the adopted turbulent-jet geometry and synchrotron self-absorption optical-depth relations), report the measured soft lag value together with its formal uncertainty, and show the step-by-step propagation of that uncertainty into the derived Doppler factor and magnetic-field strength. These additions will make the derivation fully reproducible. revision: yes
Circularity Check
No circularity: direct measurements and fits to new observational data
full rationale
The paper presents new multi-telescope BVRI photometry of BL Lacertae over 62 nights, applies standard statistical tests (power-enhanced F-test and nested ANOVA) to the light curves to detect variability, fits double-exponential profiles to a subset of flares, and performs time-lag analysis under a turbulent jet model to derive Doppler factors and magnetic field strengths. All central results are direct outputs of data reduction, statistical detection, and parameter fitting to independent observations rather than quantities defined in terms of prior fitted parameters from the same equations, self-citation chains, or ansatzes smuggled via prior work. No self-definitional steps, fitted inputs renamed as predictions, or load-bearing uniqueness theorems appear in the derivation chain.
Axiom & Free-Parameter Ledger
Reference graph
Works this paper leans on
-
[1]
Improved AGN light curve analysis with the z-transformed discrete correlation function
Abdo A. A., et al., 2010a, ApJ, 716, 30 Abdo A. A., et al., 2010b, ApJ, 722, 520 Ackermann M., et al., 2011, ApJ, 743, 171 Agarwal A., Gupta A. C., 2015, MNRAS, 450, 541 Agarwal A., et al., 2015, MNRAS, 451, 3882 Agarwal A., et al., 2019, MNRAS, 488, 4093 Agarwal A., et al., 2021, A&A, 645, A137 AgarwalA.,PandeyA.,ÖzdönmezA.,EgeE.,KumarDasA.,KarakulakV., ...
work page internal anchor Pith review Pith/arXiv arXiv doi:10.1007/978-94-015-8941-3_14 2011
-
[2]
95.35 1.49 V V 22.21 2020 Oct 12 B𝑅12.61 3.83 (271,
2020
-
[3]
97.04 1.61 V V 12.08 2021 May 16 B𝑅12.9 2.6 (111,
2021
-
[4]
10.55 2.07 V V 6.43 2021 Jun 14 B𝑅13.12 1.72 (86,
2021
-
[5]
5.09 2.28 V V 3.01 2021 Jul 11 B𝑅11.58 3.93 (358,
2021
-
[6]
17.95 1.52 V V 8.68 2021 Jul 17 B𝑅12.15 5.69 (437,
2021
-
[7]
54.01 1.46 V V 11.29 2021 Jul 18 B𝑅12.14 4.91 (372,
2021
-
[8]
3.22 1.5 V V 13.57 2021 Jul 30 B𝑅11.76 1.47 (211,
2021
-
[9]
3.35 1.71 V V 10.65 2021 Aug 16 B𝐵14.3 5.56 (96,
2021
-
[10]
3.49 2.18 V PV 10.06 2021 Aug 16 B𝑉13.38 5.55 (94,
2021
-
[11]
8.11 2.18 V PV 6.88 2021 Aug 16 B𝑅12.68 5.53 (97,
2021
-
[12]
2.34 2.18 NV PV 2021 Aug 16 B𝐼11.83 5.58 (93,
2021
-
[13]
0.83 2.23 NV PV 2021 Aug 17 B𝑅12.31 2.84 (284,
2021
-
[14]
11.12 1.59 V V 10.4 2021 Sep 05 B𝑅13.02 4.93 (294,
2021
-
[15]
21.87 1.57 V V 13.0 2021 Sep 28 B𝑅12.26 7.3 (546,
2021
-
[16]
40.79 1.4 V V 15.71 2022 Sep 03 B𝐵15.08 2.82 (68,
2022
-
[17]
133.6 2.55 V V 10.56 2022 Sep 03 B𝑉14.14 2.81 (68,
2022
-
[18]
80.38 2.55 V V 7.45 2022 Sep 03 B𝑅13.42 2.8 (66,
2022
-
[19]
84.31 2.55 V V 7.83 2022 Sep 03 B𝐼12.56 2.79 (66,
2022
-
[20]
26.47 2.55 V V 5.95 2022 Oct 18 A𝑅12.09 0.93 (77,
2022
-
[21]
45.99 2.39 V V 8.25 2022 Oct 19 A𝐵13.37 1.42 (25,
2022
-
[22]
79.87 4.43 V V 13.97 2022 Oct 19 A𝑉12.62 1.39 (29,
2022
-
[23]
127.58 3.9 V V 13.65 2022 Oct 19 A𝑅11.95 1.37 (22,
2022
-
[24]
48.4 5.29 V V 12.9 2022 Nov 10 A𝐵13.2 2.33 (26,
2022
-
[25]
6.58 4.43 V V 11.67 2022 Nov 10 A𝑉12.44 2.2 (28,
2022
-
[26]
38.31 4.43 V V 9.53 2022 Nov 10 A𝑅11.78 2.13 (28,
2022
-
[27]
26.13 4.43 V V 8.46 2022 Nov 12 A𝐵13.57 2.23 (18,
2022
-
[28]
60.51 6.93 V V 17.98 2022 Nov 12 A𝑉12.79 2.24 (18,
2022
-
[29]
38.62 6.93 V V 12.04 2022 Nov 12 A𝑅12.11 2.24 (16,
2022
-
[30]
69.77 6.93 V V 14.42 2022 Nov 19 A𝑅12.33 0.69 (176,
2022
-
[31]
7.18 1.79 V V 7.2 2022 Nov 20 A𝑅11.95 0.93 (177,
2022
-
[32]
27.55 1.79 V V 6.82 2022 Nov 26 A𝑅11.77 1.11 (42,
2022
-
[33]
5.44 3.26 V V 20.88 2023 May 24 A𝑅12.69 1.73 (320,
2023
-
[34]
27.05 1.55 V V 10.88 2023 Jun 19 C𝐵14.91 3.54 (116,
2023
-
[35]
1.21 2.04 NV NV 2023 Jun 19 C𝐼12.53 3.54 (121,
2023
-
[36]
2.22 2.01 NV NV 2023 Jun 20 C𝐵15.01 3.41 (103,
2023
-
[37]
3.61 2.14 V V 24.77 2023 Jun 20 C𝐼12.6 3.43 (120,
2023
-
[38]
4.49 2.01 V V 22.62 2023 Jul 18 D𝐵14.56 3.29 (179,
2023
-
[39]
14.36 1.78 V V 4.54 2023 Jul 18 A𝑅12.92 3.68 (702,
2023
-
[40]
11.81 1.35 V V 5.48 2023 Jul 21 C𝐵13.95 5.01 (194,
2023
-
[41]
95.66 1.74 V V 44.48 2023 Jul 21 A𝑅12.47 1.92 (295,
2023
-
[42]
214.66 1.57 V V 15.62 2023 Jul 21 C𝐼11.77 5.01 (201,
2023
-
[43]
47.11 1.73 V V 36.76 2023 Jul 24 A𝑅12.41 4.56 (793,
2023
-
[44]
292.95 1.33 V V 16.73 2023 Jul 25 A𝑅12.67 3.37 (362,
2023
-
[45]
443.13 1.51 V V 20.63 2023 Jul 26 A𝑅12.85 4.18 (779,
2023
-
[46]
70.82 1.33 V V 11.37 2023 Aug 09 A𝐵14.65 1.02 (20,
2023
-
[47]
3.47 5.29 NV NV 2023 Aug 09 A𝐼12.2 1.09 (22,
2023
-
[48]
2.23 5.29 NV NV 2023 Aug 13 C𝐵14.67 3.86 (164,
2023
-
[49]
3.88 1.82 V V 21.29 2023 Aug 13 C𝐼12.36 4.01 (171,
2023
-
[50]
2.75 1.81 V V 19.53 2023 Aug 16 D𝐵14.68 3.2 (134,
2023
-
[51]
68.75 1.93 V V 7.08 2023 Aug 16 D𝐼12.13 3.32 (584,
2023
-
[52]
95.39 1.39 V V 6.13 2023 Aug 17 D𝐵14.83 4.06 (178,
2023
-
[53]
30.05 1.79 V V 5.88 2023 Aug 17 B𝑉13.73 2.55 (99,
2023
-
[54]
11.72 2.14 V V 7.14 2023 Aug 17 B𝑅13.02 2.55 (100,
2023
-
[55]
1.28 2.14 NV V 2023 Aug 17 D𝐼12.23 4.08 (723,
2023
-
[56]
96.9 1.34 V V 5.94 2023 Aug 20 A𝐵14.62 3.05 (52,
2023
-
[57]
10.56 2.89 V V 14.71 2023 Aug 20 A𝐼12.21 3.08 (55,
2023
-
[58]
53.16 2.75 V V 8.78 2023 Aug 23 A𝐵14.1 1.71 (32,
2023
-
[59]
2.26 3.9 NV PV 2023 Aug 23 A𝐼11.74 1.6 (28,
2023
-
[60]
25.68 4.43 V PV 4.93 2023 Sep 03 A𝐵14.58 7.49 (41,
2023
-
[61]
10.14 3.26 V V 19.4 2023 Sep 03 A𝑉13.64 8.23 (48,
2023
-
[62]
8.66 3.05 V V 15.97 2023 Sep 03 A𝑅12.91 8.47 (48,
2023
-
[63]
10.26 3.05 V V 23.0 2023 Sep 03 A𝐼12.14 8.46 (38,
2023
-
[64]
6.32 3.53 V V 18.35 2023 Sep 15 B𝐵14.24 2.95 (90,
2023
-
[65]
Takey et al
80.68 2.23 V V 15.12 MNRAS000, 1–22 (2015) 22A. Takey et al. Table A1 – Variability results (continued.) Obs. Date Telescope Band Avg.𝑡 obs Power-enhanced F-test Nested ANOVA Test Band Night Amplitude YYYY-MM-DD code Mag. [h] DOF(𝜈 1,𝜈2)𝐹 enh 𝐹c DOF(𝜈1,𝜈2)𝐹 𝐹 c status status [per cent] 2023 Sep 15 B𝑉13.34 2.95 (92,
2015
-
[66]
4.66 2.23 NV V 2023 Sep 15 B𝑅12.65 2.95 (90,
2023
-
[67]
2.43 2.23 V V 15.24 2023 Sep 15 B𝐼11.82 2.93 (89,
2023
-
[68]
2.5 2.23 V V 17.61 2023 Sep 23 A𝐵15.08 3.26 (84,
2023
-
[69]
23.5 2.28 V V 19.93 2023 Sep 23 A𝐼12.52 3.62 (100,
2023
-
[70]
169.19 2.14 V V 11.13 2023 Sep 24 A𝐵15.09 3.43 (80,
2023
-
[71]
1.52 2.33 NV PV 2023 Sep 24 A𝐼12.58 3.1 (82,
2023
-
[72]
2.55 2.33 V PV 6.27 2023 Sep 25 A𝐵15.16 2.52 (62,
2023
-
[73]
0.79 2.64 NV NV 2023 Sep 25 A𝐼12.64 2.21 (59,
2023
-
[74]
3.75 2.64 NV NV 2023 Sep 27 A𝐵15.1 3.27 (80,
2023
-
[75]
0.65 2.33 NV NV 2023 Sep 27 A𝐼12.55 3.02 (80,
2023
-
[76]
4.45 2.33 NV NV 2023 Oct 06 A𝐵14.83 5.29 (134,
2023
-
[77]
67.63 1.93 V V 23.76 2023 Oct 06 A𝐼12.35 5.18 (141,
2023
-
[78]
295.62 1.91 V V 16.25 2023 Nov 01 A𝐵15.27 1.65 (41,
2023
-
[79]
3.24 3.26 NV PV 2023 Nov 01 A𝐼12.66 1.8 (44,
2023
-
[80]
28.1 3.05 V PV 11.41 2023 Nov 06 A𝐵15.63 4.45 (121,
2023
discussion (0)
Sign in with ORCID, Apple, or X to comment. Anyone can read and Pith papers without signing in.