SupplyNet: Supporting Visual Exploratory Learning in Supply Chain via Contextual Multi-Agent Simulation
Pith reviewed 2026-06-25 22:47 UTC · model grok-4.3
The pith
SupplyNet pairs a contextual graph-based LLM multi-agent framework with interactive visuals to let users explore supply chain dynamics through what-if scenarios and causal tracing.
A machine-rendered reading of the paper's core claim, the machinery that carries it, and where it could break.
Core claim
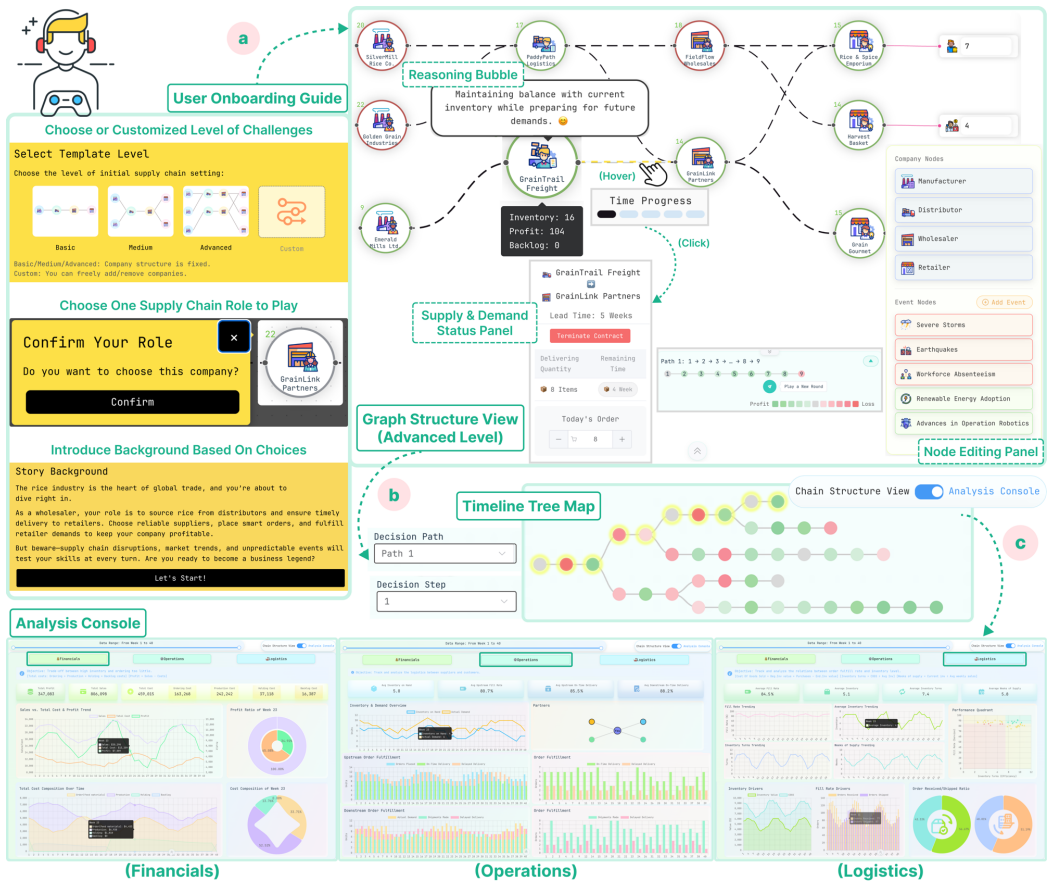
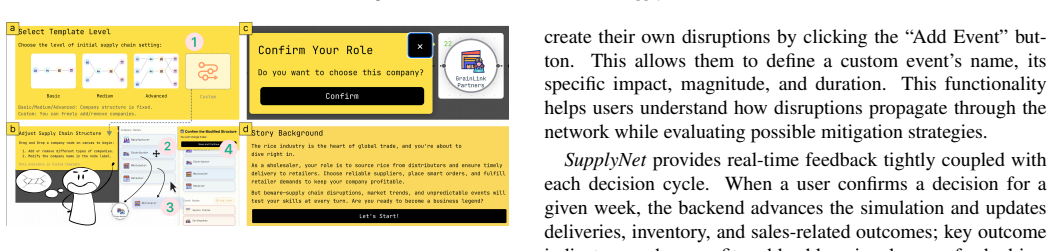
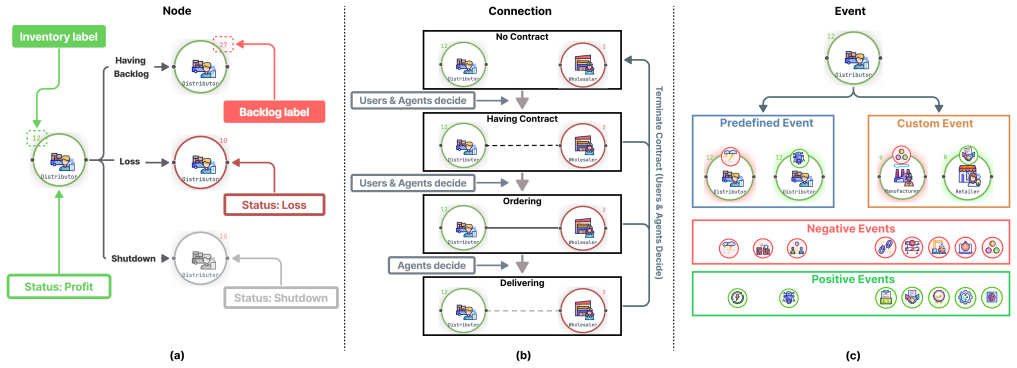
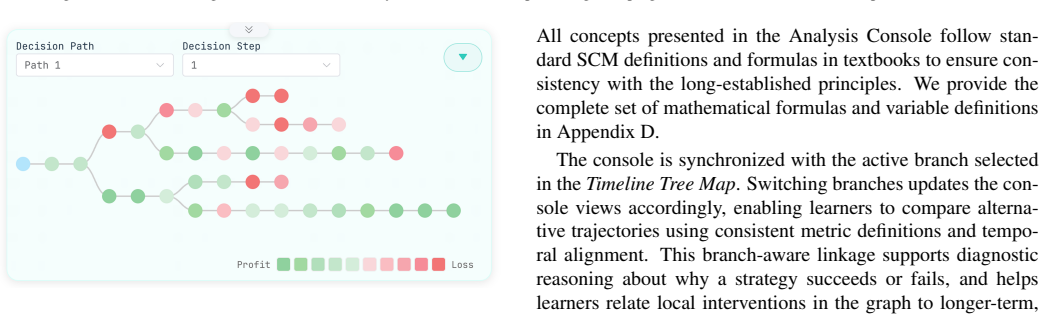
SupplyNet integrates a contextual graph-based LLM multi-agent framework that models interdependent supply chain dynamics with an interactive network view of system state, a branching timeline for what-if exploration and comparison, and a task-oriented analysis console for structured performance breakdowns, thereby turning the simulation into a manipulable decision space that supports counterfactual exploration, causal tracing, and comparative reasoning about outcomes, as a user study suggests this pairing increases engagement and supports perceived understanding of supply chain dynamics.
What carries the argument
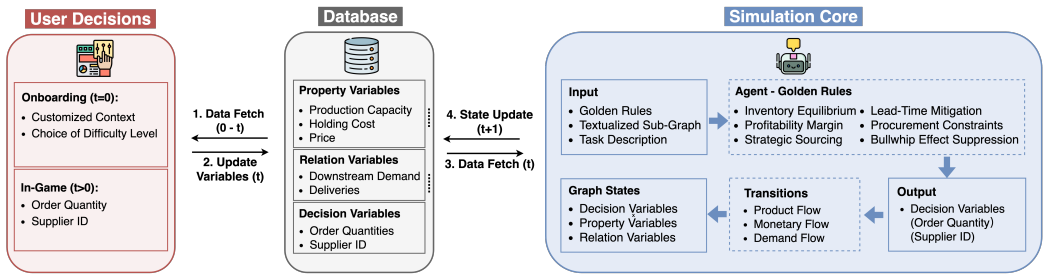
Contextual graph-based LLM multi-agent framework integrated with interactive network view, branching timeline, and task-oriented analysis console to enable manipulation and feedback in supply chain simulations.
Load-bearing premise
The contextual graph-based LLM multi-agent framework produces realistic interdependent supply chain dynamics that support valid learning outcomes.
What would settle it
A controlled test in which users trained with SupplyNet show no measurable improvement over control groups in predicting or explaining real supply chain responses to disruptions.
Figures
read the original abstract
Simulation has long supported supply chain management instruction by letting learners observe network behavior and test decision strategies. Recent progress in LLM-driven agents opens new possibilities for richer, more adaptive simulations, but many existing systems still present abstract, opaque data that overwhelms learners and discourages active exploration. We introduce \textit{SupplyNet}, a gamified visual simulation system built on a contextual graph-based LLM multi-agent framework that models interdependent supply chain dynamics and provides responsive feedback through tiered challenges. \textit{SupplyNet} turns the simulation into a manipulable decision space by integrating an interactive network view of system state, a branching timeline for "what-if" exploration and comparison, and a task-oriented analysis console for structured performance breakdowns. Together, these visual components support counterfactual exploration, causal tracing, and comparative reasoning about outcomes. A user study suggests that \textit{SupplyNet} increases engagement and supports users' perceived understanding of supply chain dynamics, highlighting the potential of pairing contextual multi-agent simulation with visualization to advance operational comprehension.
Editorial analysis
A structured set of objections, weighed in public.
Referee Report
Summary. The paper introduces SupplyNet, a gamified visual simulation system for supply chain education built on a contextual graph-based LLM multi-agent framework. The system models interdependent dynamics and integrates an interactive network view, branching timeline for what-if exploration, and task-oriented analysis console to support counterfactual reasoning and causal tracing. A user study is described as suggesting that SupplyNet increases engagement and perceived understanding of supply chain dynamics.
Significance. If the simulation produces realistic dynamics and the user study is methodologically sound, the work could advance HCI applications in operations education by showing how LLM agents combined with visualization enable active exploration beyond traditional abstract simulations. The integration of tiered challenges and comparative tools is a concrete contribution to exploratory learning interfaces. However, absent validation of the multi-agent model or study details, the significance for valid operational insight remains unevaluated.
major comments (2)
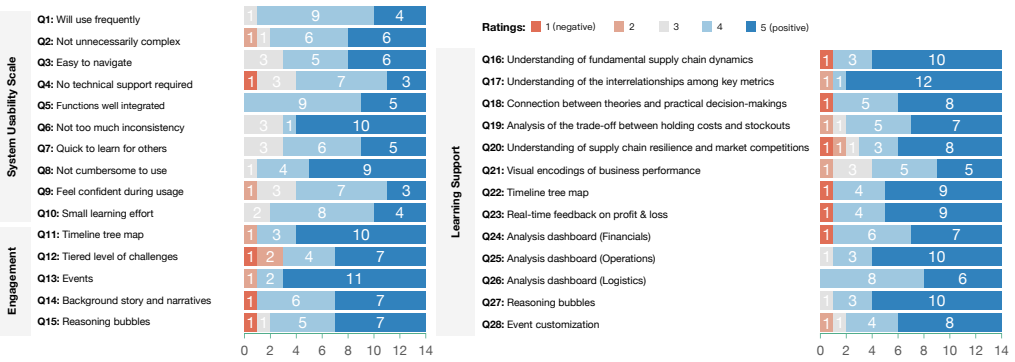
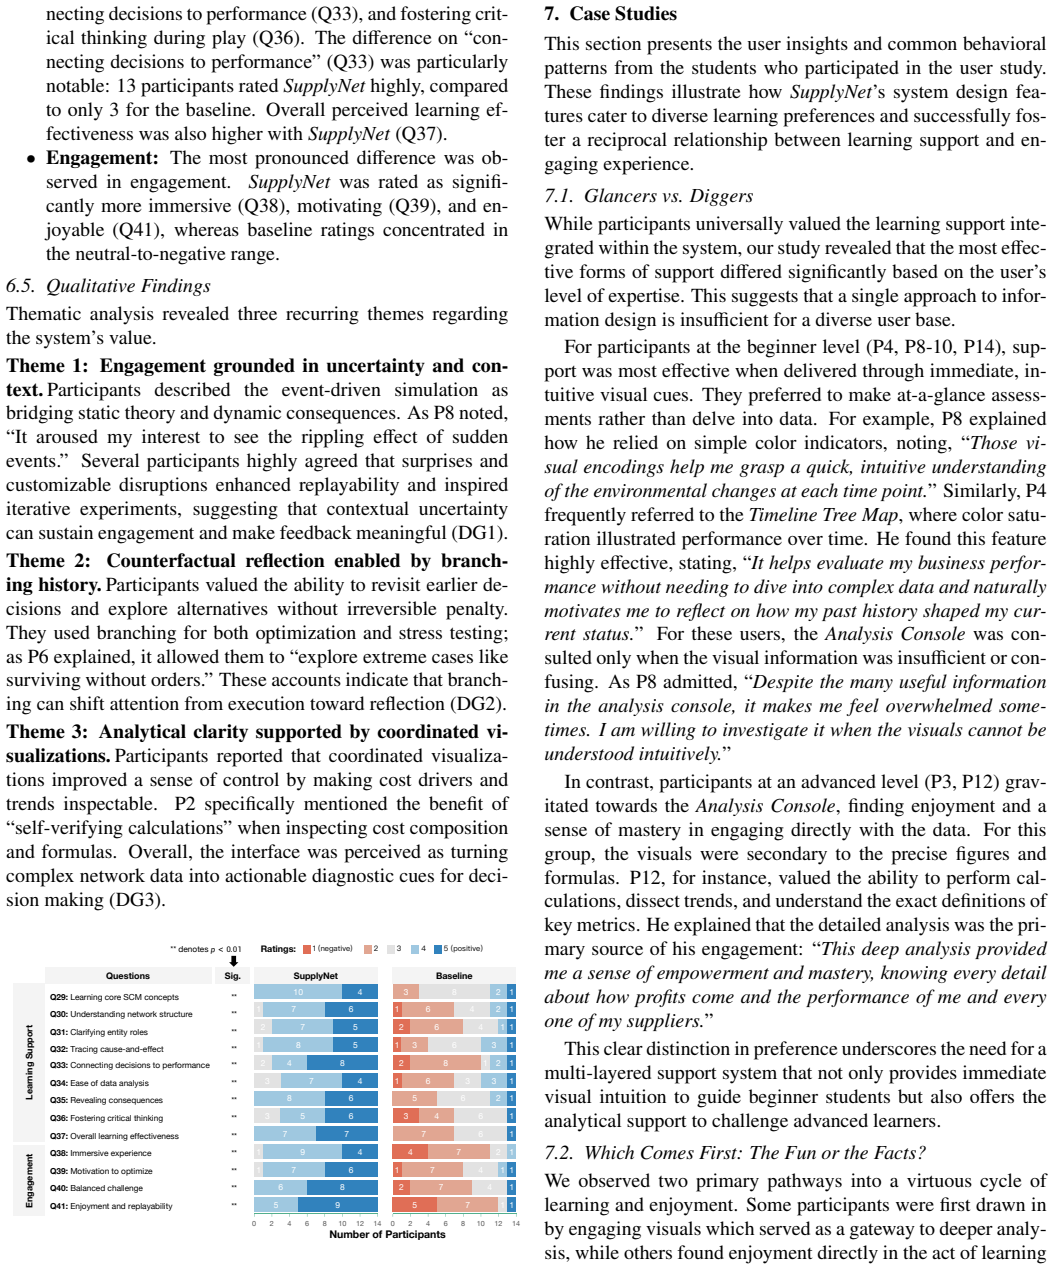
- [Abstract] Abstract: The central claim that 'a user study suggests that SupplyNet increases engagement and supports users' perceived understanding' is load-bearing for the paper's contribution, yet the abstract (and system description) provides no information on study design, participant count, measures, statistical analysis, or controls. This prevents assessment of whether reported gains reflect the system's educational value or interface novelty.
- [Abstract] Abstract and system description: The claim that the contextual graph-based LLM multi-agent framework 'models interdependent supply chain dynamics' and supports 'valid learning outcomes' rests on an unvalidated assumption. No calibration against real data (e.g., lead times, bullwhip effects), expert benchmarks, or comparison to established models such as Beer Game variants is reported, which is required to distinguish accurate operational insight from plausible but potentially unrealistic agent behaviors.
minor comments (1)
- [Abstract] The abstract uses 'suggests' for the user study outcome; if results are presented later, clarify whether they are statistically significant or merely directional.
Simulated Author's Rebuttal
We thank the referee for their constructive comments. We respond to each major comment below, indicating where revisions will be made to clarify scope and strengthen the presentation.
read point-by-point responses
-
Referee: [Abstract] Abstract: The central claim that 'a user study suggests that SupplyNet increases engagement and supports users' perceived understanding' is load-bearing for the paper's contribution, yet the abstract (and system description) provides no information on study design, participant count, measures, statistical analysis, or controls. This prevents assessment of whether reported gains reflect the system's educational value or interface novelty.
Authors: We agree that the abstract would benefit from additional context on the user study. In the revised manuscript we will expand the abstract to briefly report participant count, study design (within-subjects), primary measures (engagement and perceived understanding scales), and key statistical outcomes drawn from Section 5. The full protocol, demographics, and analysis remain in the body of the paper. revision: yes
-
Referee: [Abstract] Abstract and system description: The claim that the contextual graph-based LLM multi-agent framework 'models interdependent supply chain dynamics' and supports 'valid learning outcomes' rests on an unvalidated assumption. No calibration against real data (e.g., lead times, bullwhip effects), expert benchmarks, or comparison to established models such as Beer Game variants is reported, which is required to distinguish accurate operational insight from plausible but potentially unrealistic agent behaviors.
Authors: The manuscript frames SupplyNet as an HCI system for exploratory learning rather than a validated operations-research model. The multi-agent component supplies plausible interdependent scenarios that enable the visual what-if and causal-tracing features; the user study evaluates interface effects on engagement and perceived understanding, not operational fidelity. We will revise the abstract and introduction to state explicitly that the simulation generates educational scenarios without claiming calibration to real data or equivalence to established models such as the Beer Game. revision: partial
Circularity Check
No circularity: descriptive system paper with no derivations or fitted predictions
full rationale
The paper is a system introduction describing SupplyNet, a gamified visual simulation built on a contextual graph-based LLM multi-agent framework. It contains no equations, no mathematical derivations, no predictions of quantities, and no fitted parameters. The central claims rest on a user study description of engagement and perceived understanding rather than any self-referential logic, self-citation chains, or renamings of known results. No load-bearing step reduces to its own inputs by construction. The derivation chain is empty, making the paper self-contained against external benchmarks for the purpose of this analysis.
Axiom & Free-Parameter Ledger
Reference graph
Works this paper leans on
-
[1]
In- ternational Journal of Production Research 62, 3333–3360
Artificial intelligence in supply chain and opera- tions management: a multiple case study research. In- ternational Journal of Production Research 62, 3333–3360. doi:10.1080/00207543.2023.2232050. Chen, Z., Song, S., Shum, K., Lin, Y ., Sheng, R., Wang, W., Qu, H., 2025. Unmasking deceptive visuals: Benchmark- ing multimodal large language models on misl...
-
[2]
Gamification in science: A study of requirements in the context of reproducible research, in: Proceedings of the 2019 CHI Conference on Human Factors in Computing Sys- tems, p. 1–14. doi:10.1145/3290605.3300690. Gao, C., Lan, X., Lu, Z., Mao, J., Piao, J., Wang, H., Jin, D., Li, Y ., 2023. S3: Social-network simulation system with large language model-emp...
-
[3]
Song, S., Zhang, Y ., Lin, Y ., Qu, H., Wang, C., Li, C., 2025
doi:10.1109/TVCG.2026.3694448. Song, S., Zhang, Y ., Lin, Y ., Qu, H., Wang, C., Li, C., 2025. Gvvst: Image-driven style extraction from graph visualiza- tions for visual style transfer 31, 5975–5989. doi:10.1109/ TVCG.2024.3485701. Stadtler, H., 2014. Supply chain management: An overview. Supply Chain Management and Advanced Planning: Con- cepts, Models,...
-
[4]
Manufacturers, as the top tier of the supply chain, are assumed to have a fixed source of raw materials for production
The supplier setS m,i represents the suppliers of agentA m,i. Manufacturers, as the top tier of the supply chain, are assumed to have a fixed source of raw materials for production. Therefore, their supplier sets are denoted asS AM−1,i =∅in the simulation
-
[5]
Retailers, as the bottom tier of the supply chain, are assumed to have a fixed group of customers at the local market
Customer setD m,i includes all the customers of agentA m,i. Retailers, as the bottom tier of the supply chain, are assumed to have a fixed group of customers at the local market. Thus, their customer sets are denoted asD A0,i =Customer i in the simulation
-
[6]
,M−1},i∈ {0,
Inventory level is denoted as I={I m,i |m∈ {0, . . . ,M−1},i∈ {0, . . . ,N m}}, whereI m,i represents the quantity of materials held by agentA m,i. It follows I∼Uniform(lb I,ub I),I i ∈Z(B.1) wherelb I =20 andub I =25
-
[7]
,M−1},i∈ {0,
Production capacity is defined as C={C m,i |m∈ {0, . . . ,M−1},i∈ {0, . . . ,N m}}, whereC m,i represents the quantity of materials that can be transformed into outgoing products by agentA m,i within a single 17 period. It follows: C∼Uniform(lb C,ub C),C i ∈Z(B.2) wherelb C =20 andub C =40
-
[8]
,M−1},i∈ {0,
Profit ratePr m,i is defined as Pr={Pr m,i |m∈ {0, . . . ,M−1},i∈ {0, . . . ,N m}}, wherePr m,i represents the profit rate of agentA m,i for selling one product unit. It follows: Pr∼Uniform(lb Pr,ub Pr),P∈Z.(B.3) wherelb Pr =1 andub Pr =2
-
[9]
,M−1},i∈ {0,
Sale pricePis defined as P={P m,i |m∈ {0, . . . ,M−1},i∈ {0, . . . ,N m}}, whereP i represents the price of a unit product that agentioffers to its downstream customers. It is determined by the order cost, production cost and the profit rate as follows: P=(PC m,i +max j∈S m,i OCm i→j )·Pr m i ∀m∈0, . . . ,M−2.(B.4)
-
[10]
,M−1},i∈ {0,
Backlog costBis defined as B={b m,i |m∈ {0, . . . ,M−1},i∈ {0, . . . ,N m}}, whereb m,i denotes the cost incurred by agentA m,i for each unit of product that has not yet been fulfilled to the downstream customers for one time period. It follows: B∼Uniform(lb B,ub B),B∈Z.(B.5) wherelb B =1,ub B =3
-
[11]
,M−1},i∈ {0,
Holding costHis defined as H={h m,i |m∈ {0, . . . ,M−1},i∈ {0, . . . ,N m}}, whereh m,i denotes the cost incurred by agentA m,i for storing each unit of product in inventory for one time period. It follows: H∼Uniform(lb H,ub H),H∈Z.(B.6) wherelb H =1 andub H =3. Appendix B.2. Relational Variables The key variables associated with the interactions or relat...
-
[12]
,M−1}, i∈ {0,
Order costOCis defined as OC={OC Am,i→Am+1,j |m∈ {0, . . . ,M−1}, i∈ {0, . . . ,N m}, j∈ {0, . . . ,N m+1}}, (B.7) whereOC Am,i→Am+1,j represents the cost paid by agentA m,i to purchase each unit of feed materials from upstream agentA m+1,j . It is equal to the sale price offered by upstream supplierA m+1,j . I assume the order cost to be 0 (i.e.,OC AM−1,...
-
[13]
,M−1}, i∈ {0,
Lead time is defined as L={L Am,i→Am+1,j |m∈ {0, . . . ,M−1}, i∈ {0, . . . ,N m}, j∈ {0, . . . ,N m+1}}, (B.8) whereL Am,i→Am+1,j represents the number of periods required to deliver products from agentA m,i to agentA m+1,j .L Am,i→Am+1,j is determined by the distance between two agents as follows: Li j =⌊ q (xm,i −x m+1,j )2 +(y m,i −y m+1,j )2⌋(B.9) 18 ...
-
[14]
It can be formulated as: Rt m,i = X Am+1,j ∈S m,i min(Bt−1 m+1,j +O t m,i, Cm+1,j , It−1 m+1,j +R t−LAm+1,j →Am,i m,i ), (B.10) wherem∈ {0,
The actual order fulfillmentR t Am+1,j →Am,i is constrained jointly by the upstream supplierA m+1,j ’s production capacityCm+1,j , the inventory levelI m+1,j , the backlogB m+1,j , and the order quantityO m,t placed by the agentA m,i itself. It can be formulated as: Rt m,i = X Am+1,j ∈S m,i min(Bt−1 m+1,j +O t m,i, Cm+1,j , It−1 m+1,j +R t−LAm+1,j →Am,i m...
-
[15]
The inventory levelI t m,i is updated to account for the deliveries received from the suppliers after the lead timeL Am+1,j →Am,i and the sales during the periodtas follows: It m,i =I t−1 m,i +R t−LAm+1,j →Am,i m,i −S t m,i,(B.12) wherem∈ {0, . . . ,M−1}
-
[16]
S t m,i =R t m−1,j (B.13) wherem∈ {1,
The salesS t m,i is determined by the order quantity it can fulfilled to the downstream customers. S t m,i =R t m−1,j (B.13) wherem∈ {1, . . . ,M−1},A m−1,j ∈ Dt m,i. For retailers, their salesS t 0,i is determined by the customer demand as S t 0,i =min(B t−1 0,i, +D t i, C0,i, It−1 0,i +R t−LA1,j →A0,i 0,i ), (B.14) whereA 1,j ∈ St 0,i
-
[17]
It can be formulated as: Bt m,i =B t−1 m,i +O t m,i −S t m,i,m∈ {1,
The backlogB t m,i at periodtdepends on the previous backlog, the orderO t m,i placed by downstream customers during the current periodt, and the actual salesS t m,i. It can be formulated as: Bt m,i =B t−1 m,i +O t m,i −S t m,i,m∈ {1, . . . ,M−1},(B.15) For retailers (i.e.,m=0), the backlog depends on the customer demandD i(t) instead of downstream orders...
-
[18]
Golden Rules,
The profitP f m,i is a combination of factors. It depends on the sale at the current periodtand the price. Additionally, it depends on the order costs incurred to purchase materials from the suppliers during the same period. Furthermore, the inventory costs 19 and backlog costs also contribute to the profit calculation. Overall, it is formulated as: P ft ...
discussion (0)
Sign in with ORCID, Apple, or X to comment. Anyone can read and Pith papers without signing in.