JWST Reveals Compact Nuclear Starbursts Masquerading as AGNs in Metal-Poor Dwarfs: Where Are the Accreting Intermediate-Mass Black Holes?
Pith reviewed 2026-06-29 01:52 UTC · model grok-4.3
The pith
Compact nuclear starbursts in metal-poor dwarf galaxies produce AGN-like mid-infrared colors without any accretion onto black holes.
A machine-rendered reading of the paper's core claim, the machinery that carries it, and where it could break.
Core claim
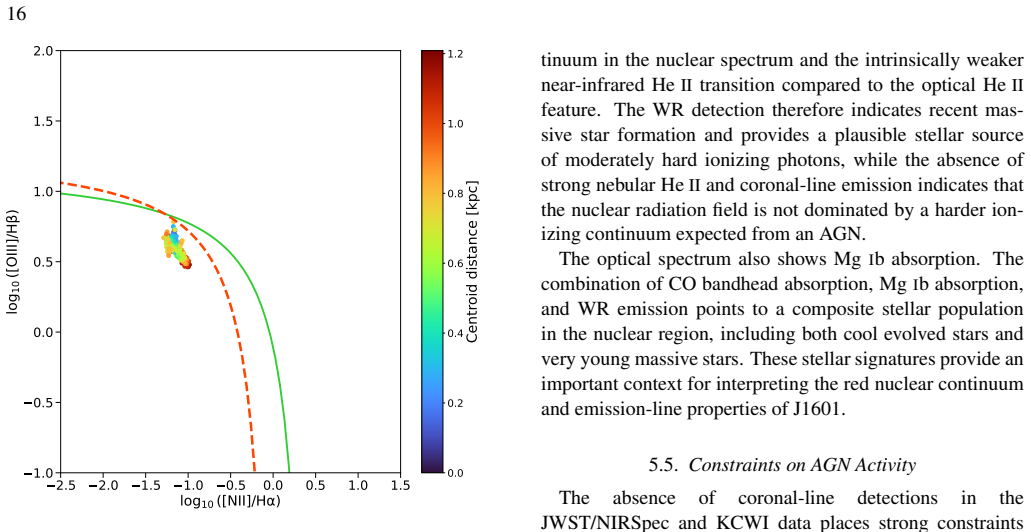
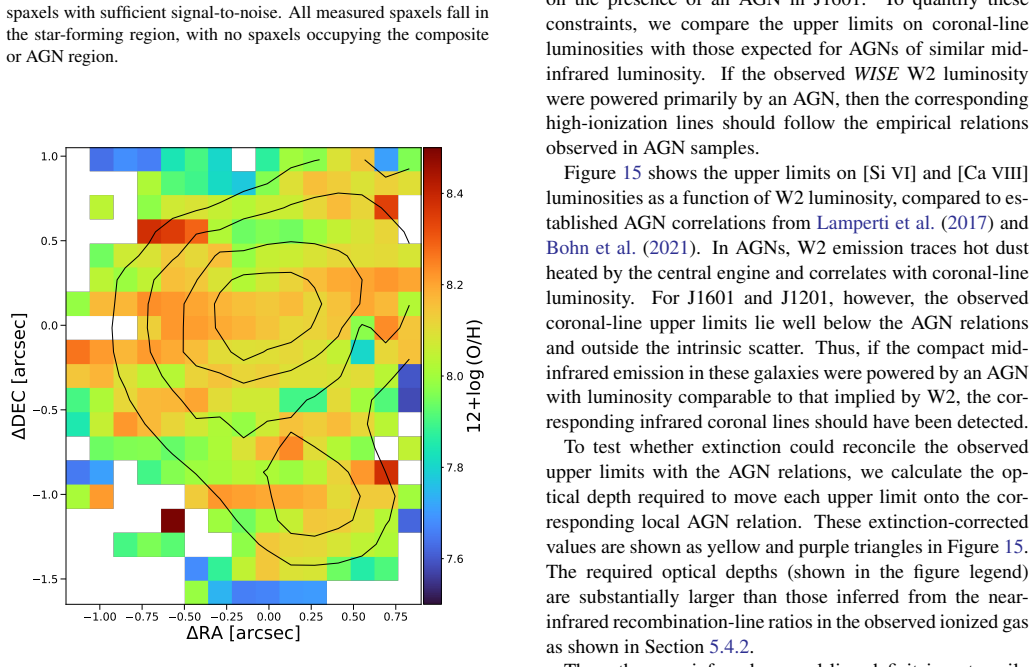
The paper establishes that the extreme mid-infrared colors in these metal-poor dwarfs originate from compact, unresolved nuclear starburst emission rather than accretion, as confirmed by the absence of typical AGN tracers and by models demonstrating a genuine deficit of hard ionizing photons beyond what metallicity can explain.
What carries the argument
JWST/NIRSpec spectroscopy combined with photoionization models that isolate the contribution of nuclear star cluster emission to the mid-infrared colors.
If this is right
- Widely used WISE color diagnostics can be contaminated by star formation in low-mass systems.
- Metal-poor dwarf galaxies with nuclear starbursts do not show conditions for efficient black hole growth.
- Such galaxies may lie below the mass or metallicity threshold where black hole seeds readily form or accrete.
- Multiwavelength follow-up beyond mid-infrared colors is required to confirm AGN activity in dwarfs.
Where Pith is reading between the lines
- Searches for intermediate-mass black holes in dwarfs may need to prioritize X-ray or variability data over infrared colors alone.
- The findings connect to broader questions of whether low-metallicity environments suppress black hole seeding mechanisms.
- Similar starburst contamination could affect AGN demographic studies at higher redshifts where dwarfs are more common.
Load-bearing premise
The lack of coronal lines, X-ray emission, and variability is taken to mean there is no accretion activity at all.
What would settle it
Detection of coronal lines or variable X-ray emission from the nuclei of similar metal-poor dwarfs selected by the same mid-infrared colors would show that accretion is present after all.
Figures
read the original abstract
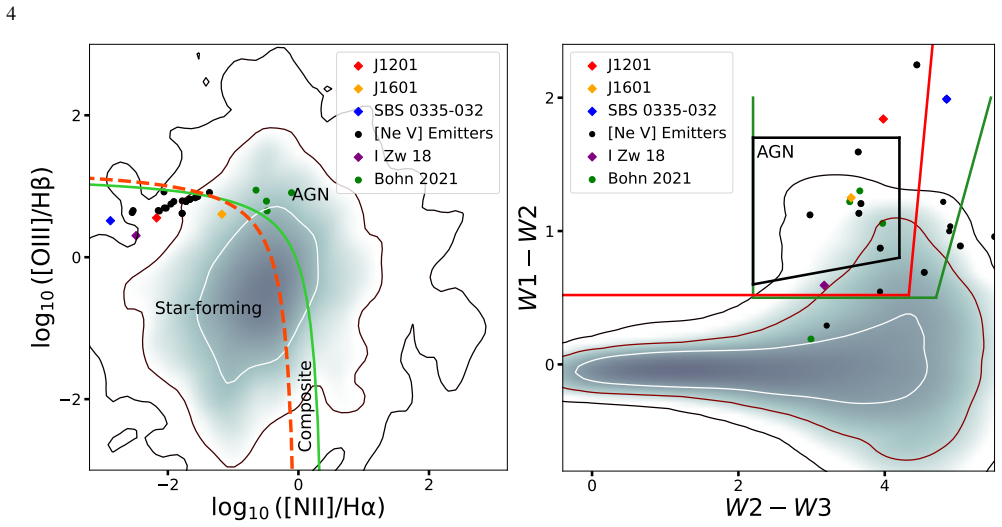
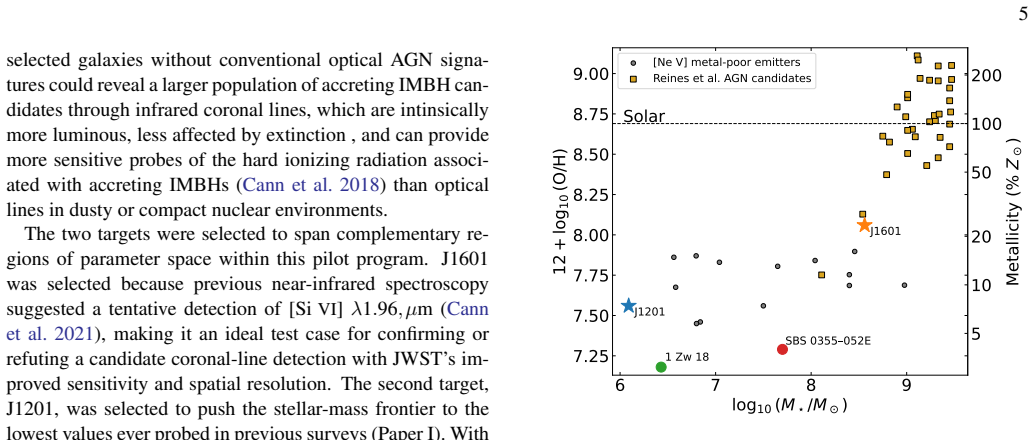
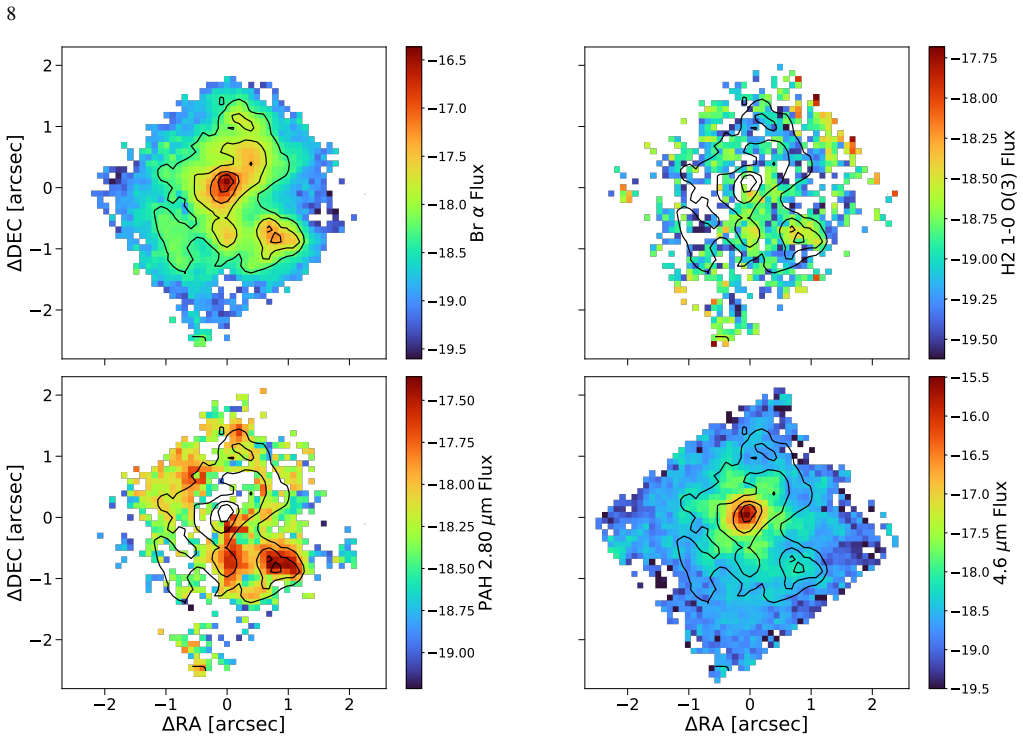
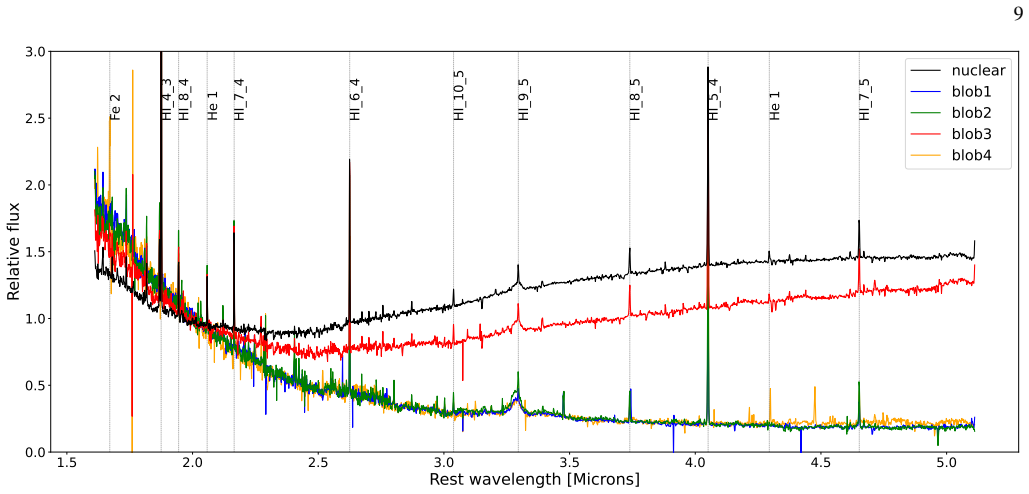
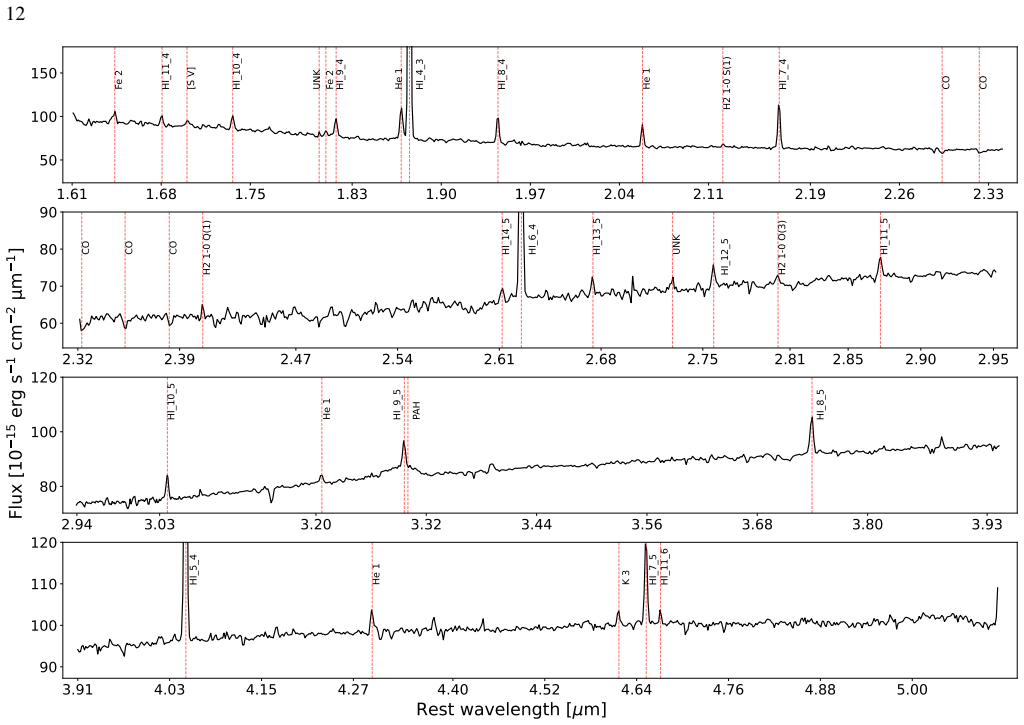
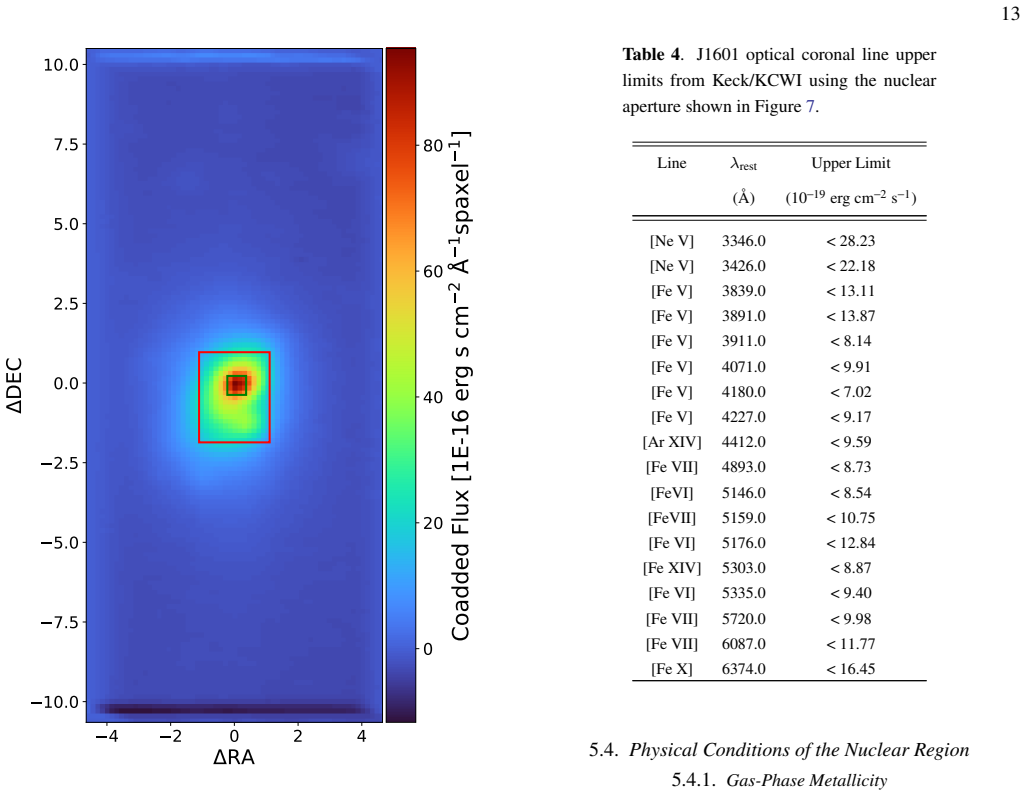
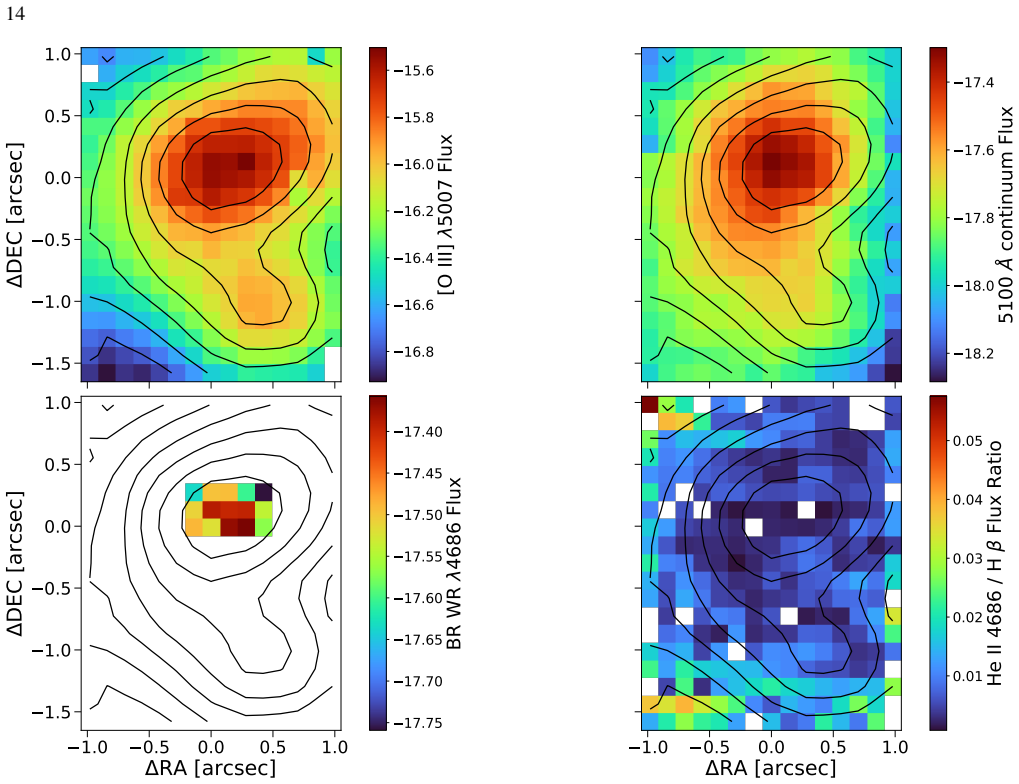
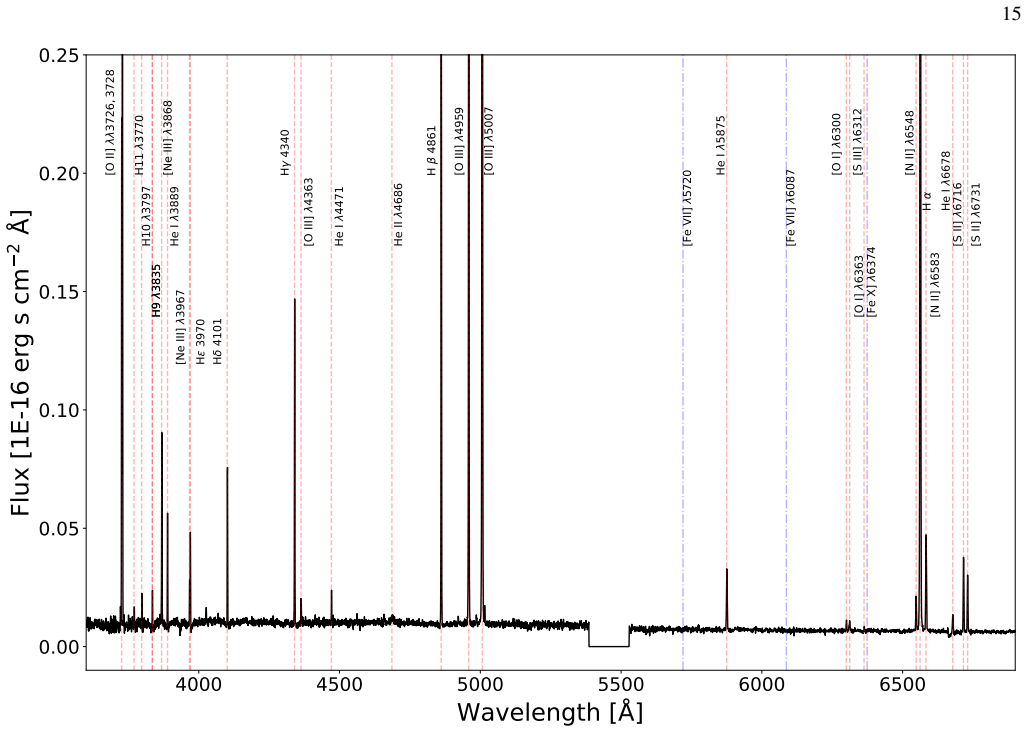
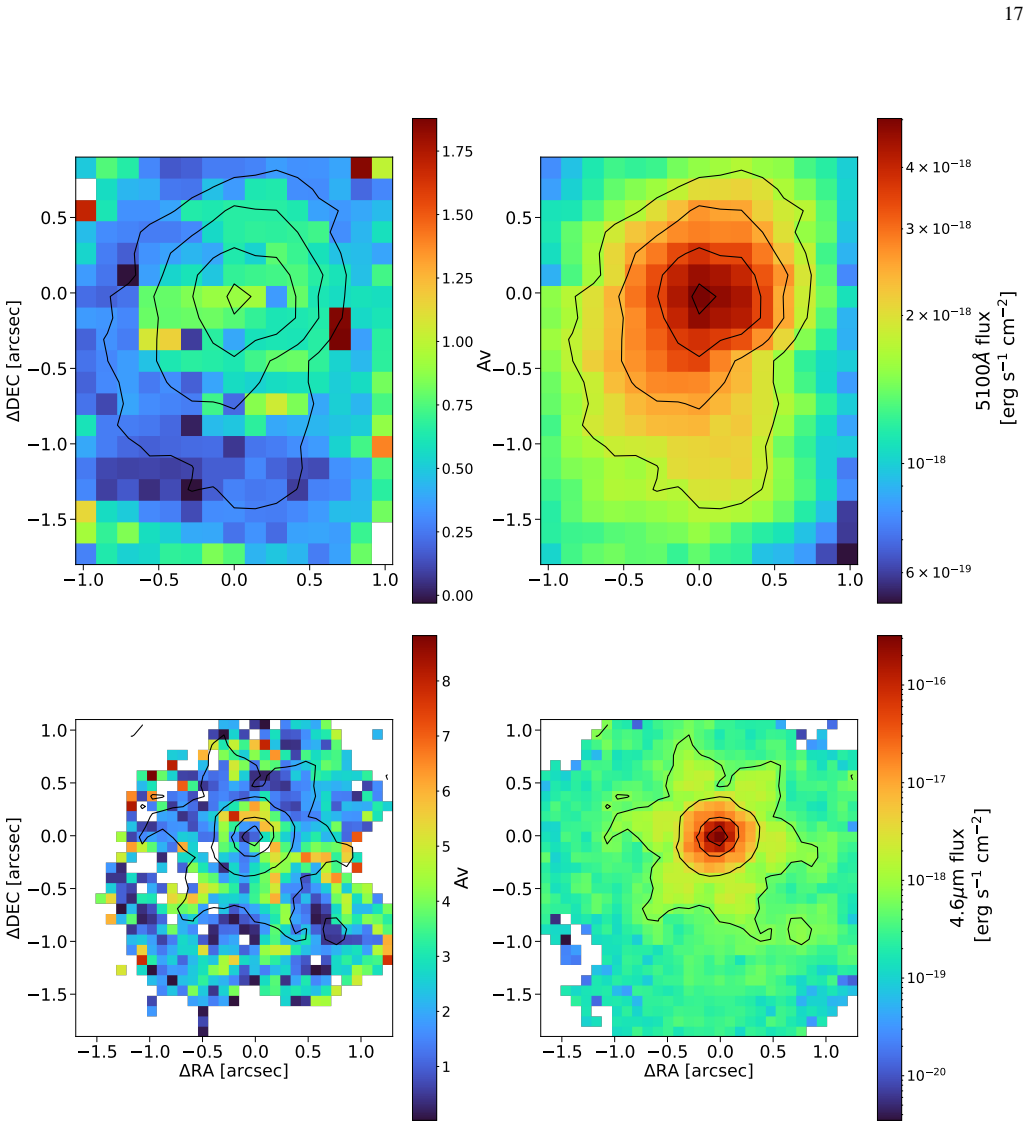
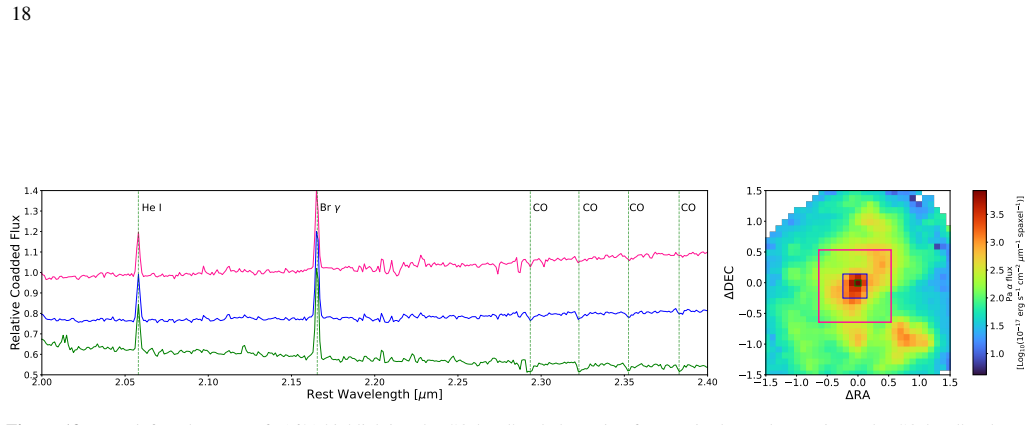
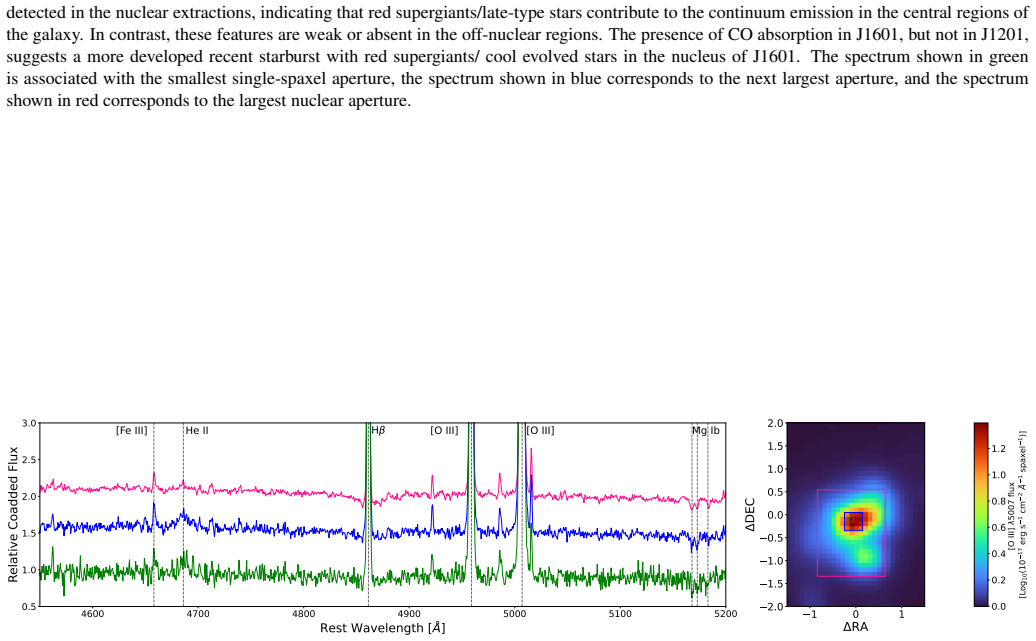
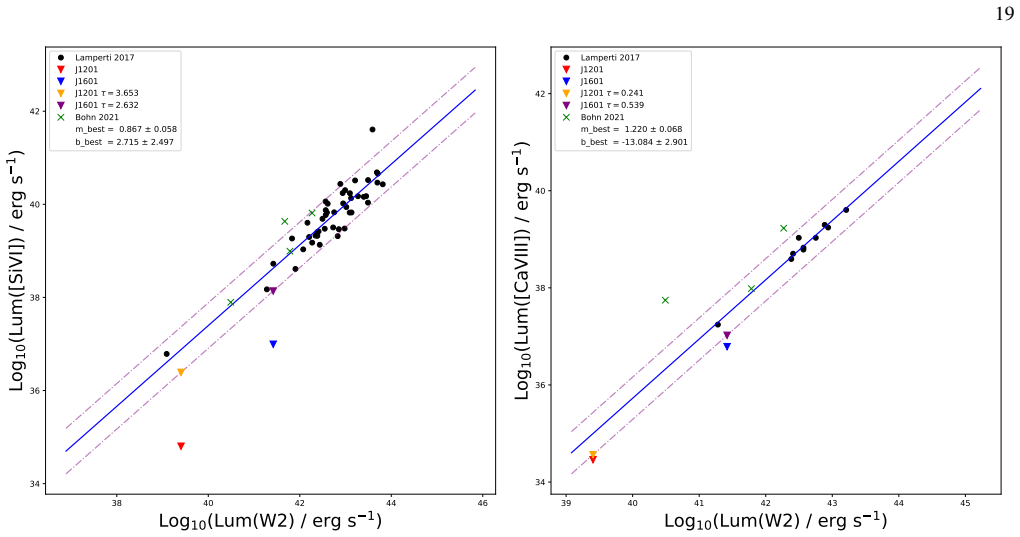
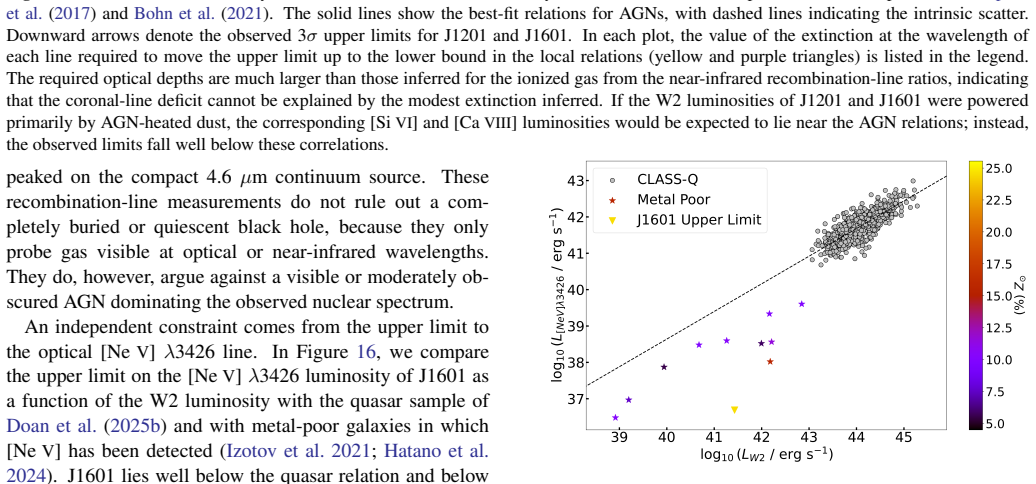
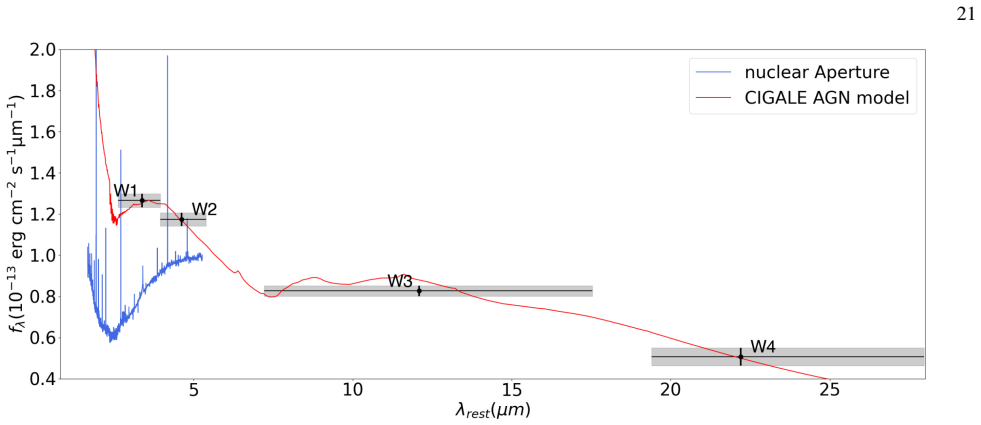
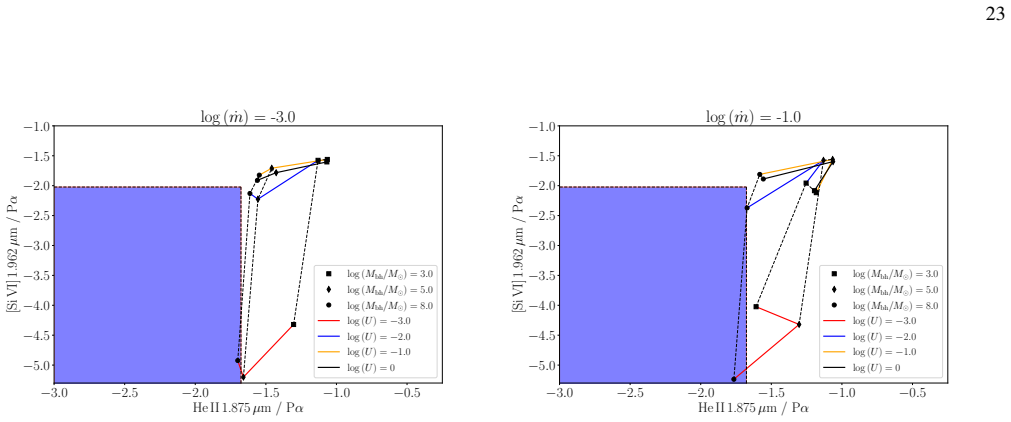
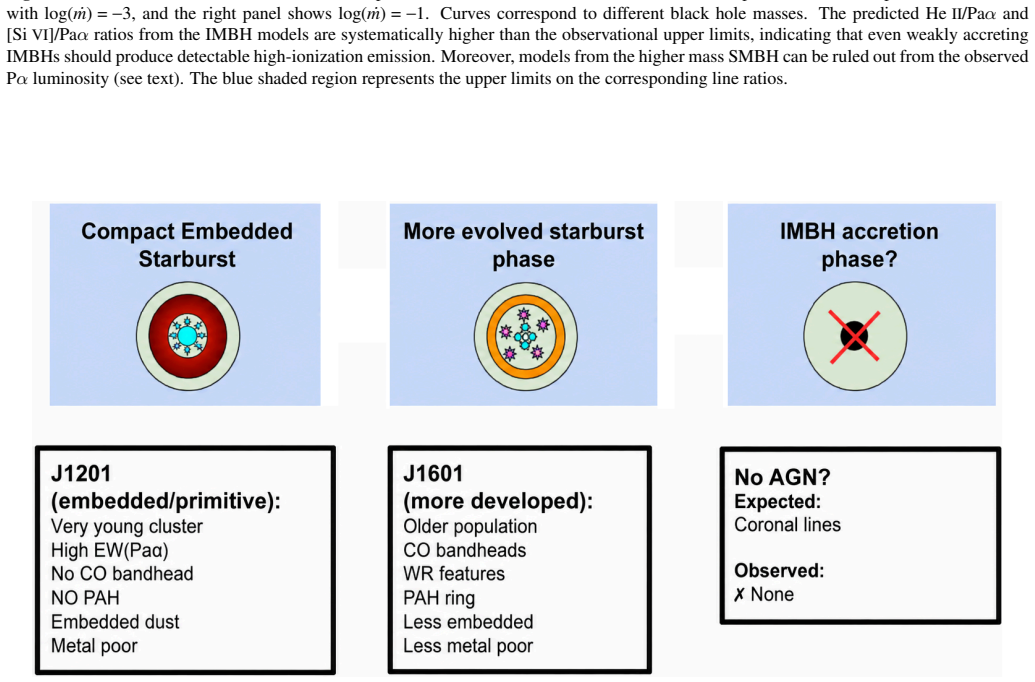
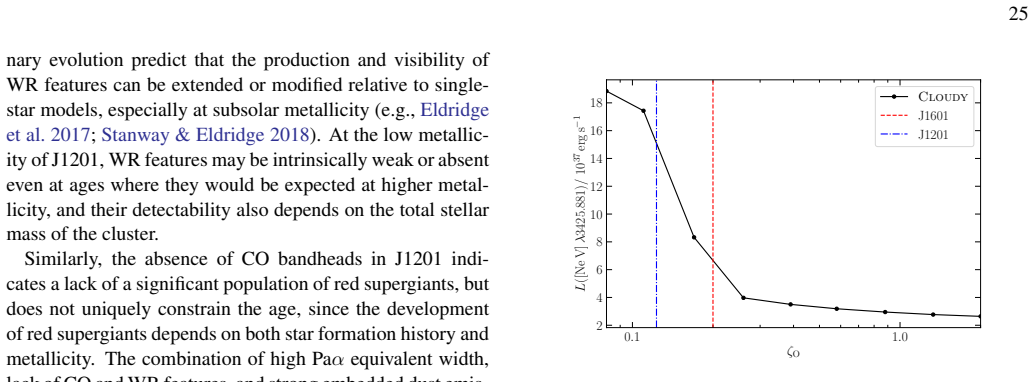
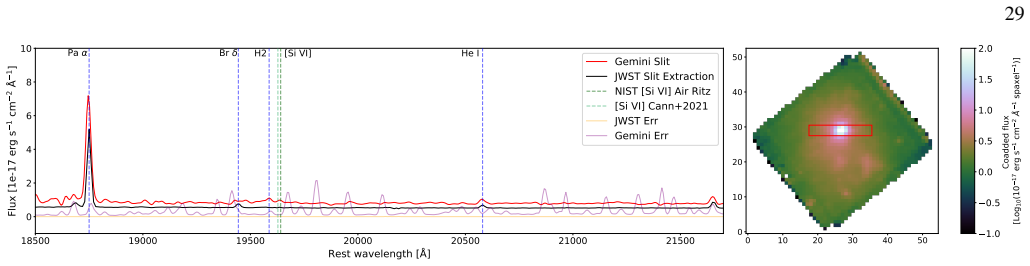
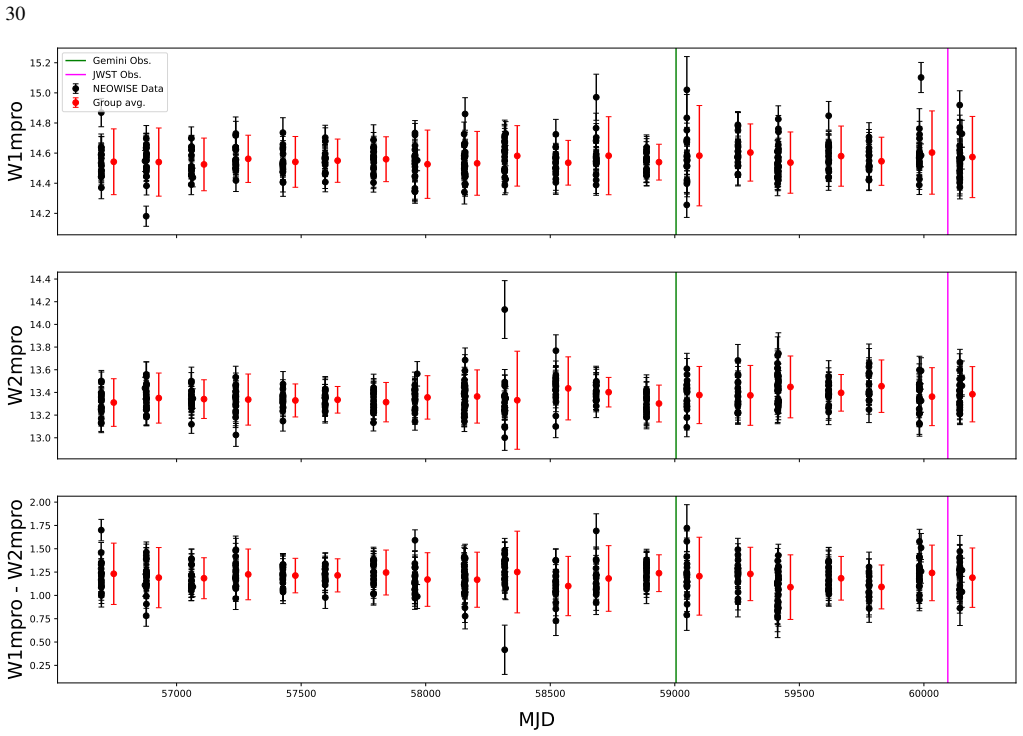
We present JWST/NIRSpec spectroscopy of the low-mass, metal-poor galaxy SDSS~J160135.95+311353.7 (J1601), selected for its extreme mid-infrared colors and compact nuclear emission, placing it within widely used WISE color diagnostics for active galactic nuclei (AGNs). Despite this selection, we find no evidence for coronal lines, X-ray emission, or variability typically associated with accretion activity. We compare J1601 to SDSS~J120122.30+021108.3 (J1201), a similar but lower-mass, more metal-poor system studied previously (Doan, 2025). Both galaxies host compact nuclear starbursts but differ in their stellar populations and dust properties: J1601 shows CO bandhead absorption indicative of red supergiants, weak nuclear Wolf--Rayet features, and a circumnuclear PAH ring, consistent with a more developed recent starburst, while J1201 is more dust-enshrouded and chemically primitive. Despite these differences, neither system shows evidence for AGN activity, indicating that the absence of accretion is not simply due to evolutionary timing. Photoionization models show that the weakness of high-ionization emission cannot be explained by low metallicity alone, implying a genuine deficit of hard ionizing photons. Crucially, the red mid-infrared colors in both systems originate from compact, unresolved nuclear emission confined to the nuclear star cluster. These results demonstrate that compact nuclear starbursts can mimic AGN-like mid-infrared colors without accretion, and that commonly used AGN diagnostics may not uniquely identify accreting black holes in metal-poor dwarf galaxies. Our findings suggest that such systems may not provide the conditions required for efficient black hole growth and/or may lie near or below the regime where black hole seeds can form.
Editorial analysis
A structured set of objections, weighed in public.
Referee Report
Summary. The manuscript presents JWST/NIRSpec spectroscopy of the metal-poor dwarf galaxy SDSS J1601 (selected for extreme WISE mid-IR colors and compact nuclear emission) and compares it to the similar system J1201. Despite AGN-like mid-IR colors, no coronal lines ([Ne V], [Fe VII]), X-ray emission, or variability are detected. Stellar features (CO bandheads, weak WR lines, circumnuclear PAH) and photoionization models are used to attribute the emission to compact nuclear starbursts rather than accretion, concluding that standard AGN diagnostics may fail to identify (or rule out) accreting IMBHs in such galaxies.
Significance. If the central claim holds, the result is significant for AGN selection in low-mass, low-metallicity systems and for constraints on IMBH growth and seed formation. The work provides concrete observational examples of starburst mimicry of mid-IR colors, supported by multi-wavelength non-detections and direct comparison of two systems with differing starburst properties; this is a strength for an observational paper.
major comments (2)
- [Abstract and photoionization modeling section] Abstract and photoionization modeling section: The models are stated to show that 'the weakness of high-ionization emission cannot be explained by low metallicity alone,' but the text does not report composite starburst+AGN grids that test whether a weak, obscured AGN (L_bol ~10^40-10^42 erg s^-1, low Eddington ratio) remains consistent with the observed upper limits on coronal lines and X-rays while still producing the unresolved nuclear mid-IR colors.
- [Section discussing non-detections and AGN exclusion] Section discussing non-detections and AGN exclusion: The claim that absence of [Ne V], [Fe VII], X-rays, and variability rules out accretion is load-bearing for the conclusion that the mid-IR colors originate purely from the starburst. In metal-poor gas, coronal-line and X-ray suppression can occur even for accreting sources; without quantitative upper-limit modeling for IMBHs (including obscuration and Eddington-ratio dependence), the non-detections do not uniquely exclude a sub-dominant AGN component.
minor comments (2)
- [Abstract] The abstract and introduction could explicitly quote the numerical upper limits on X-ray luminosity and coronal-line equivalent widths to allow readers to assess the strength of the non-detections.
- [Figures and methods] Figure captions and text describing the circumnuclear PAH ring and CO absorption should clarify the spatial resolution and aperture sizes used to isolate nuclear versus extended emission.
Simulated Author's Rebuttal
We thank the referee for their constructive comments, which correctly identify areas where our analysis could be strengthened by additional discussion of possible weak AGN contributions. We respond point by point below.
read point-by-point responses
-
Referee: [Abstract and photoionization modeling section] The models are stated to show that 'the weakness of high-ionization emission cannot be explained by low metallicity alone,' but the text does not report composite starburst+AGN grids that test whether a weak, obscured AGN (L_bol ~10^40-10^42 erg s^-1, low Eddington ratio) remains consistent with the observed upper limits on coronal lines and X-rays while still producing the unresolved nuclear mid-IR colors.
Authors: We agree that our photoionization analysis used pure starburst grids and did not include composite starburst+AGN models to test the viability of a weak, obscured AGN component. The current models demonstrate that the observed line ratios, including the absence of high-ionization lines, are reproduced by starburst photoionization at the measured metallicities without requiring an additional hard radiation field. In the revised manuscript we will add a paragraph in the modeling section explicitly noting this limitation and discussing how a low-luminosity AGN might remain consistent with the data, while reiterating that the spatially unresolved mid-IR emission is co-located with the nuclear star cluster. revision: partial
-
Referee: [Section discussing non-detections and AGN exclusion] The claim that absence of [Ne V], [Fe VII], X-rays, and variability rules out accretion is load-bearing for the conclusion that the mid-IR colors originate purely from the starburst. In metal-poor gas, coronal-line and X-ray suppression can occur even for accreting sources; without quantitative upper-limit modeling for IMBHs (including obscuration and Eddington-ratio dependence), the non-detections do not uniquely exclude a sub-dominant AGN component.
Authors: The referee is correct that the non-detections alone do not furnish quantitative upper limits on a possible sub-dominant IMBH, particularly given known suppression effects in low-metallicity gas. The manuscript language states that we find 'no evidence' for accretion rather than claiming definitive exclusion. We will revise the relevant section to include an explicit caveat on this point, reference existing IMBH accretion models that incorporate obscuration and Eddington-ratio effects, and clarify that while the multi-wavelength data and starburst modeling favor a pure nuclear starburst origin for the mid-IR colors, a weak AGN component cannot be ruled out at high confidence without further quantitative analysis. revision: yes
Circularity Check
No circularity: purely observational analysis with external comparisons
full rationale
The manuscript is an observational JWST spectroscopy study reporting non-detections of AGN signatures and comparing two galaxies. No equations, fitted parameters, or derivations are present that reduce to inputs by construction. The reference to prior work on J1201 (Doan 2025) is an external comparison of independent observations, not a self-citation chain bearing the central claim. Photoionization models are invoked only to interpret line weakness, without any self-referential fitting or renaming of results. The analysis is self-contained against external benchmarks and contains no load-bearing steps matching the enumerated circularity patterns.
Axiom & Free-Parameter Ledger
axioms (1)
- domain assumption Standard assumptions in photoionization modeling for interpreting high-ionization emission lines in low-metallicity gas
Reference graph
Works this paper leans on
-
[1]
T., Bogdán, Á., Kovács, O
Ananna, T. T., Bogdán, Á., Kovács, O. E., Natarajan, P., & Hickox, R. C. 2024, ApJL, 969, L18
2024
-
[2]
Arnaud, K. A. 1996, in Astronomical Society of the Pacific Conference Series, V ol. 101, Astronomical Data Analysis Software and Systems V , ed. G. H. Jacoby & J. Barnes, 17 Astropy Collaboration, Robitaille, T. P., Tollerud, E. J., et al. 2013, A&A, 558, A33
1996
-
[3]
C., & Dexter, J
Begelman, M. C., & Dexter, J. 2026, ApJ, 996, 48
2026
-
[4]
F., Satyapal, S., & Ellison, S
Blecha, L., Snyder, G. F., Satyapal, S., & Ellison, S. L. 2018, MNRAS, 478, 3056 Bogdán, Á., Goulding, A. D., Natarajan, P., et al. 2024, Nature Astronomy, 8, 126
2018
-
[5]
2021, ApJ, 911, 70 Böker, T., Arribas, S., Lützgendorf, N., et al
Bohn, T., Canalizo, G., Veilleux, S., & Liu, W. 2021, ApJ, 911, 70 Böker, T., Arribas, S., Lützgendorf, N., et al. 2022, A&A, 661, A82
2021
-
[6]
J., Liu, X., Chen, Y .-C., Shen, Y ., & Guo, H
Burke, C. J., Liu, X., Chen, Y .-C., Shen, Y ., & Guo, H. 2021, MNRAS, 504, 543
2021
-
[7]
2023, JWST Calibration Pipeline
Bushouse, H., Eisenhamer, J., Dencheva, N., et al. 2023, JWST Calibration Pipeline
2023
-
[8]
M., Satyapal, S., Abel, N
Cann, J. M., Satyapal, S., Abel, N. P., et al. 2019, ApJL, 870, L2 —. 2018, ApJ, 861, 142
2019
-
[9]
M., Satyapal, S., Bohn, T., et al
Cann, J. M., Satyapal, S., Bohn, T., et al. 2020, ApJ, 895, 147 2 http://www.astropy.org
2020
-
[10]
M., Satyapal, S., Rothberg, B., et al
Cann, J. M., Satyapal, S., Rothberg, B., et al. 2021, ApJL, 912, L2
2021
-
[11]
Chisholm, J., Berg, D. A., Endsley, R., et al. 2024, arXiv e-prints, arXiv:2402.18643
arXiv 2024
-
[12]
J., Olivier, G
Cleri, N. J., Olivier, G. M., Backhaus, B. E., et al. 2025, ApJ, 994, 146
2025
-
[13]
Collins, M. L. M., & Read, J. I. 2022, Nature Astronomy, 6, 647
2022
-
[14]
J., Huang, Z.-P., Yin, Q
Condon, J. J., Huang, Z.-P., Yin, Q. F., & Thuan, T. X. 1991, ApJ, 378, 65 de Graaff, A., Rix, H.-W., Naidu, R. P., et al. 2025, A&A, 701, A168
1991
-
[15]
2007, ApJ, 660, 167
Alonso-Herrero, A. 2007, ApJ, 660, 167
2007
-
[16]
J., Stanway, E
Eldridge, J. J., Stanway, E. R., Xiao, L., et al. 2017, PASA, 34, e058
2017
-
[17]
L., & Massa, D
Fitzpatrick, E. L., & Massa, D. 2009, ApJ, 699, 1209
2009
-
[18]
W., Lang, D., & Goodman, J
Foreman-Mackey, D., Hogg, D. W., Lang, D., & Goodman, J. 2013, PASP, 125, 306
2013
-
[19]
2026, arXiv e-prints, arXiv:2606.06575
Gentile, F., Giavalisco, M., Daddi, E., et al. 2026, arXiv e-prints, arXiv:2606.06575
Pith/arXiv arXiv 2026
-
[20]
D., Clayton, G
Gordon, K. D., Clayton, G. C., Decleir, M., et al. 2023, ApJ, 950, 86 32
2023
-
[21]
M., Lavaux, G., et al
Graziani, R., Courtois, H. M., Lavaux, G., et al. 2019, MNRAS, 488, 5438
2019
-
[22]
A., Heckman, T
Groves, B. A., Heckman, T. M., & Kauffmann, G. 2006, MNRAS, 371, 1559
2006
-
[23]
M., Ji, X., Chatzikos, M., Yan, R., & Ferland, G
Gunasekera, C. M., Ji, X., Chatzikos, M., Yan, R., & Ferland, G. 2022, MNRAS, 512, 2310
2022
-
[24]
M., van Hoof, P
Gunasekera, C. M., van Hoof, P. A. M., Dehghanian, M., et al. 2025, RMxAA, 61, 120
2025
-
[25]
2017, MNRAS, 468, 3935
Habouzit, M., V olonteri, M., & Dubois, Y . 2017, MNRAS, 468, 3935
2017
-
[26]
2023, ApJ, 959, 39
Harikane, Y ., Zhang, Y ., Nakajima, K., et al. 2023, ApJ, 959, 39
2023
-
[27]
2023, arXiv e-prints, arXiv:2304.03726
Hatano, S., Ouchi, M., Nakajima, K., et al. 2023, arXiv e-prints, arXiv:2304.03726
arXiv 2023
-
[28]
2024, ApJ, 966, 170
Hatano, S., Ouchi, M., Umeda, H., et al. 2024, ApJ, 966, 170
2024
-
[29]
Hawcroft, C., Law, D. R., Smith, L. J., et al. 2026, arXiv e-prints, arXiv:2606.23456
Pith/arXiv arXiv 2026
-
[30]
C., Micheva, G., Weilbacher, P
Herenz, E. C., Micheva, G., Weilbacher, P. M., et al. 2023, Research Notes of the American Astronomical Society, 7, 99
2023
-
[31]
F., Quataert, E., & Murray, N
Hopkins, P. F., Quataert, E., & Murray, N. 2012, MNRAS, 421, 3522
2012
-
[32]
G., & Storey, P
Hummer, D. G., & Storey, P. J. 1987, MNRAS, 224, 801
1987
-
[33]
K., Draine, B
Hunt, L. K., Draine, B. T., Navarro, M. G., et al. 2025, ApJ, 993, 84
2025
-
[34]
I., Stasi´nska, G., Meynet, G., Guseva, N
Izotov, Y . I., Stasi´nska, G., Meynet, G., Guseva, N. G., & Thuan, T. X. 2006, A&A, 448, 955
2006
-
[35]
I., & Thuan, T
Izotov, Y . I., & Thuan, T. X. 2008, ApJ, 687, 133
2008
-
[36]
I., Thuan, T
Izotov, Y . I., Thuan, T. X., & Guseva, N. G. 2007, ApJ, 671, 1297 —. 2021, MNRAS, 508, 2556
2007
-
[37]
I., Thuan, T
Izotov, Y . I., Thuan, T. X., & Privon, G. 2012, MNRAS, 427, 1229
2012
-
[38]
2022, A&A, 661, A80
Jakobsen, P., Ferruit, P., Alves de Oliveira, C., et al. 2022, A&A, 661, A80
2022
-
[39]
H., Cohen, M., Masci, F., et al
Jarrett, T. H., Cohen, M., Masci, F., et al. 2011, ApJ, 735, 112
2011
-
[40]
E., Dowd, T., Oey, M
Jaskot, A. E., Dowd, T., Oey, M. S., Scarlata, C., & McKinney, J. 2019, ApJ, 885, 96
2019
-
[41]
Jenkins, E. B. 2009, ApJ, 700, 1299
2009
-
[42]
2025, arXiv e-prints, arXiv:2501.13082
Ji, X., Maiolino, R., Übler, H., et al. 2025, arXiv e-prints, arXiv:2501.13082
arXiv 2025
-
[43]
2026, MNRAS, 545, staf2235
Ji, X., D’Eugenio, F., Juodžbalis, I., et al. 2026, MNRAS, 545, staf2235
2026
-
[44]
E., & Yang, H
Jiang, T., Malhotra, S., Rhoads, J. E., & Yang, H. 2019, ApJ, 872, 145
2019
-
[45]
M., Tremonti, C., et al
Kauffmann, G., Heckman, T. M., Tremonti, C., et al. 2003, MNRAS, 346, 1055
2003
-
[46]
M., Guerrero, M
Kehrig, C., Vílchez, J. M., Guerrero, M. A., et al. 2018, MNRAS, 480, 1081
2018
-
[47]
2001, ApJ, 556, 121
Trevena, J. 2001, ApJ, 556, 121
2001
-
[48]
2025, ApJ, 993, 13
Knutas, A., Adamo, A., Pedrini, A., et al. 2025, ApJ, 993, 13
2025
-
[49]
2024, arXiv e-prints, arXiv:2407.04777
Kokubo, M., & Harikane, Y . 2024, arXiv e-prints, arXiv:2407.04777
arXiv 2024
-
[50]
A., & Smith, M
Koudmani, S., Sijacki, D., Bourne, M. A., & Smith, M. C. 2019, MNRAS, 484, 2047
2019
-
[51]
M., Graziani, R., et al
Kourkchi, E., Courtois, H. M., Graziani, R., et al. 2020, AJ, 159, 67
2020
-
[52]
2018, MNRAS, 480, 1247
Kubota, A., & Done, C. 2018, MNRAS, 480, 1247
2018
-
[53]
A., Chandler, C
Lacy, M., Baum, S. A., Chandler, C. J., et al. 2020, PASP, 132, 035001
2020
-
[54]
2017, MNRAS, 467, 540
Lamperti, I., Koss, M., Trakhtenbrot, B., et al. 2017, MNRAS, 467, 540
2017
-
[55]
Laor, A., & Draine, B. T. 1993, ApJ, 402, 441
1993
-
[56]
R., Hawcroft, C., Smith, L
Law, D. R., Hawcroft, C., Smith, L. J., et al. 2024, ApJL, 976, L25
2024
-
[57]
2001, ApJ, 560, 630
Legrand, F., Tenorio-Tagle, G., Silich, S., Kunth, D., & Cerviño, M. 2001, ApJ, 560, 630
2001
-
[58]
2005, in American Institute of Physics Conference
Leitherer, C. 2005, in American Institute of Physics Conference
2005
-
[59]
2026, arXiv e-prints, arXiv:2605.21574
Lin, X., Fan, X., Cai, Z., et al. 2026, arXiv e-prints, arXiv:2605.21574
Pith/arXiv arXiv 2026
-
[60]
2025, MNRAS, 538, 1921
Maiolino, R., Risaliti, G., Signorini, M., et al. 2025, MNRAS, 538, 1921
2025
-
[61]
J., et al
Mateos, S., Alonso-Herrero, A., Carrera, F. J., et al. 2013, MNRAS, 434, 941
2013
-
[62]
P., Brammer, G., et al
Matthee, J., Naidu, R. P., Brammer, G., et al. 2024, ApJ, 963, 129
2024
-
[63]
2024, arXiv e-prints, arXiv:2412.04224
Mazzolari, G., Gilli, R., Maiolino, R., et al. 2024, arXiv e-prints, arXiv:2412.04224
arXiv 2024
-
[64]
D., Satyapal, S., Laor, A., et al
McKaig, J. D., Satyapal, S., Laor, A., et al. 2024, ApJ, 976, 130
2024
-
[65]
2019, Nature Astronomy, 3, 6
Mezcua, M. 2019, Nature Astronomy, 3, 6
2019
-
[66]
L., et al
Mingozzi, M., Garcia del Valle-Espinosa, M., James, B. L., et al. 2025, ApJ, 985, 253
2025
-
[67]
2021, ApJ, 922, 155
Salehirad, S. 2021, ApJ, 922, 155
2021
-
[68]
C., et al
Morrissey, P., Matuszewski, M., Martin, D. C., et al. 2018, ApJ, 864, 93
2018
-
[69]
J., Condon, J
Murphy, E. J., Condon, J. J., Schinnerer, E., et al. 2011, ApJ, 737, 67
2011
-
[70]
P., Matthee, J., Katz, H., et al
Naidu, R. P., Matthee, J., Katz, H., et al. 2025, arXiv e-prints, arXiv:2503.16596
Pith/arXiv arXiv 2025
-
[71]
2025, A&A, 693, A50
Napolitano, L., Castellano, M., Pentericci, L., et al. 2025, A&A, 693, A50
2025
-
[72]
Groves, B. A. 2017, MNRAS, 466, 4403 33
2017
-
[73]
2012, A&A, 539, A143
Nieva, M.-F., & Przybilla, N. 2012, A&A, 539, A143
2012
-
[74]
2026, arXiv e-prints, arXiv:2605.14233
Park, K., Torralba, A., Matthee, J., et al. 2026, arXiv e-prints, arXiv:2605.14233
Pith/arXiv arXiv 2026
-
[75]
2025, MNRAS, 537, 956
Partmann, C., Naab, T., Lahén, N., et al. 2025, MNRAS, 537, 956
2025
-
[76]
2025, ApJ, 992, 96
Pedrini, A., Adamo, A., Bik, A., et al. 2025, ApJ, 992, 96
2025
-
[77]
2025, ApJ, 982, 10 Ramos Almeida, C., & Ricci, C
Pucha, R., Juneau, S., Dey, A., et al. 2025, ApJ, 982, 10 Ramos Almeida, C., & Ricci, C. 2017, Nature Astronomy, 1, 679
2025
-
[78]
O., et al
Reefe, M., Satyapal, S., Sexton, R. O., et al. 2022, ApJ, 936, 140
2022
-
[79]
E., Greene, J
Reines, A. E., Greene, J. E., & Geha, M. 2013, ApJ, 775, 116 Rémy-Ruyer, A., Madden, S. C., Galliano, F., et al. 2014, A&A, 563, A31
2013
-
[80]
Rupke, D. S. N. 2014, IFSRED: Data Reduction for Integral Field
2014
discussion (0)
Sign in with ORCID, Apple, or X to comment. Anyone can read and Pith papers without signing in.