Debugging as Evidence-Driven Reasoning: Visualization Opportunities in Data-Intensive Programming
Pith reviewed 2026-07-01 01:13 UTC · model grok-4.3
The pith
Debugging data-intensive programs requires aligning fragmented evidence, comparing expectations to observations, and tracing state changes across components.
A machine-rendered reading of the paper's core claim, the machinery that carries it, and where it could break.
Core claim
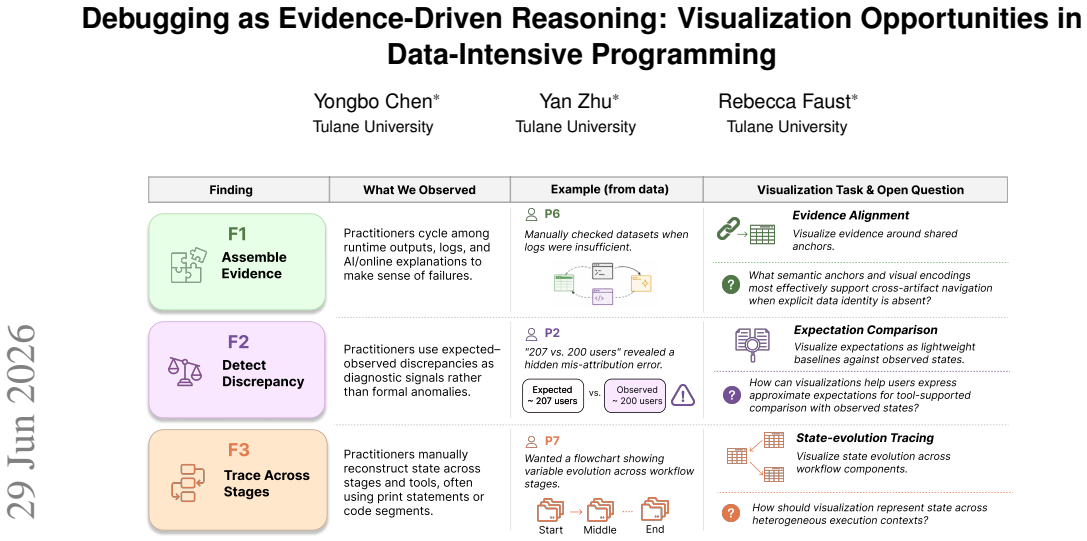
Our analysis reveals three cross-cutting challenges: assembling fragmented evidence, detecting expected-observed discrepancies, and tracing state evolution across workflow components. We distill these into three concrete requirements that visualization is well suited to address: cross-artifact evidence alignment, expectation-grounded comparison, and traceable state evolution.
What carries the argument
Three requirements for visualization in debugging distilled from thematic analysis of practitioner interviews.
If this is right
- Visualization can support cross-artifact evidence alignment to help assemble fragmented evidence.
- Expectation-grounded comparison can help detect discrepancies between expected and observed behavior.
- Traceable state evolution can help track changes across workflow components.
- This characterization provides a starting point for designing visual debuggers tailored to data-intensive programming.
Where Pith is reading between the lines
- These requirements may apply to debugging in related areas such as machine learning pipelines or scientific workflows.
- Building and testing visualization prototypes based on these requirements could validate their effectiveness in practice.
- The evidence-driven reasoning view of debugging could influence how debugging is taught or supported in other complex computing environments.
Load-bearing premise
The challenges and requirements from thematic analysis of nine interviews in diverse domains represent typical debugging practices in data-intensive programming and that visualization has particular advantages in addressing them.
What would settle it
If interviews or observations with additional practitioners reveal substantially different primary challenges, or if tools built on these requirements do not improve debugging outcomes in user studies.
Figures
read the original abstract
Visualization has been recognized as a valuable means of supporting debugging by externalizing runtime behavior that would otherwise remain hidden or scattered. However, most visual debugging research has focused on traditional software development settings, leaving the distinct challenges of data-intensive workflows largely uncharacterized. To build visual debugging support for these settings, we first need to characterize how practitioners debug in these settings and translate their challenges into concrete visualization opportunities. To this end, we conducted semi-structured interviews with nine participants from diverse data-intensive domains and analyzed the data using thematic analysis. Our analysis reveals three cross-cutting challenge: assembling fragmented evidence, detecting expected-observed discrepancies, and tracing state evolution across workflow components. We distill these challenges into three concrete requirements that current debuggers support only partially but that visualization is well suited to address: cross-artifact evidence alignment, expectation-grounded comparison, and traceable state evolution. Together, these requirements begin to characterize a design space for future visual debugging research in data-intensive programming.
Editorial analysis
A structured set of objections, weighed in public.
Referee Report
Summary. The paper reports the results of semi-structured interviews with nine practitioners from diverse data-intensive domains, analyzed via thematic analysis. It identifies three cross-cutting challenges in debugging: assembling fragmented evidence, detecting expected-observed discrepancies, and tracing state evolution across workflow components. These are distilled into three requirements for visualization: cross-artifact evidence alignment, expectation-grounded comparison, and traceable state evolution. The authors position these as beginning to characterize a design space for visual debugging in data-intensive programming, noting that current debuggers support them only partially.
Significance. If the result holds, this work provides valuable empirical insights into debugging practices in data-intensive programming, an area that has received less attention in visualization research compared to traditional software development. The translation of observed challenges into concrete visualization requirements offers a foundation for future tool design. The paper appropriately scopes its claims as exploratory, without asserting statistical representativeness or universality; thus the weakest assumption does not undermine the central contribution. The empirical basis from practitioner interviews is a strength for characterizing an under-explored domain.
major comments (1)
- [Methods] The abstract provides no details on sampling, interview protocol, coding process, inter-rater reliability, or member checking. Assuming this level of detail is also limited in the Methods section, it leaves the strength of support for the three distilled requirements moderate, as these are derived directly from the thematic analysis of the nine interviews.
minor comments (2)
- [Abstract] The abstract states 'three cross-cutting challenge' (singular) but should read 'challenges' for grammatical accuracy.
- [Introduction] The introduction could benefit from a brief definition or examples of 'data-intensive programming' to better orient readers from outside the subfield.
Simulated Author's Rebuttal
We thank the referee for the constructive feedback and positive assessment of the work's exploratory contribution. We address the major comment below.
read point-by-point responses
-
Referee: [Methods] The abstract provides no details on sampling, interview protocol, coding process, inter-rater reliability, or member checking. Assuming this level of detail is also limited in the Methods section, it leaves the strength of support for the three distilled requirements moderate, as these are derived directly from the thematic analysis of the nine interviews.
Authors: We agree that the abstract is concise and omits methodological specifics, which is common for length constraints but can be improved. The manuscript's Methods section does describe the semi-structured interviews with nine participants from diverse domains and the use of thematic analysis, but we acknowledge it could be more detailed on sampling, protocol, coding steps, and rigor measures. In revision, we will expand the Methods section to include these elements (e.g., recruitment approach, example interview questions, iterative theme development, and author consensus discussions for consistency) and briefly note the methodology in the abstract. This will strengthen transparency and support for the requirements while preserving the paper's appropriately scoped exploratory claims. revision: yes
Circularity Check
No significant circularity identified
full rationale
The paper derives its claims exclusively from thematic analysis of new semi-structured interview data collected from nine participants. No equations, fitted parameters, predictions, or self-citations appear in the derivation chain; the three challenges and three requirements are presented as direct outputs of the empirical coding process rather than reductions to prior inputs or author-defined constructs.
Axiom & Free-Parameter Ledger
Reference graph
Works this paper leans on
-
[1]
Deequ: Unit tests for data.https://github.com/ awslabs/deequ
AWS Labs. Deequ: Unit tests for data.https://github.com/ awslabs/deequ. GitHub repository, accessed April 21, 2026. 4
2026
-
[2]
Braun and V
V . Braun and V . Clarke. Using thematic analysis in psychology. Qualitative research in psychology, 3(2):77–101, 2006. doi: 10.1191/ 1478088706qp063oa 2
2006
-
[3]
S. Chattopadhyay, I. Prasad, A. Z. Henley, A. Sarma, and T. Barik. What’s wrong with computational notebooks? pain points, needs, and design opportunities. InProc. CHI, pp. 1–12, 2020. doi: 10.1145/ 3313831.3376729 1, 2
-
[4]
Eckelt, K
K. Eckelt, K. Gadhave, A. Lex, and M. Streit. Loops: Leverag- ing provenance and visualization to support exploratory data analysis in notebooks.IEEE Trans. Vis. Comput. Graph., 31(1):1213–1223,
-
[5]
doi: 10.1109/TVCG.2024.3456186 2, 4
-
[6]
Faust, K
R. Faust, K. Isaacs, W. Z. Bernstein, M. Sharp, and C. Scheideg- ger. Anteater: Interactive visualization of program execution values in context, 2024. 1, 2, 4
2024
-
[7]
Gleicher, D
M. Gleicher, D. Albers, R. Walker, I. Jusufi, C. D. Hansen, and J. C. Roberts. Visual comparison for information visualiza- tion.Information Visualization, 10(4):289–309, 2011. doi: 10.1177/ 1473871611416549 4
2011
-
[8]
Great expectations.https:// greatexpectations.io/
Great Expectations. Great expectations.https:// greatexpectations.io/. Official project website, accessed April 21, 2026. 4
2026
-
[9]
Grigoreanu, M
V . Grigoreanu, M. Burnett, S. Wiedenbeck, J. Cao, K. Rector, and I. Kwan. End-user debugging strategies: A sensemaking perspective. ACM Trans. Comput.-Hum. Interact., 19(1), art. no. 5, 28 pages, 5
-
[10]
doi: 10.1145/2147783.2147788 2
-
[11]
S. Haroon, C. Brown, and M. A. Gulzar. Desql: Interactive debugging of sql in data-intensive scalable computing.Proc. ACM Softw. Eng., 1(FSE), art. no. 35, 22 pages, July 2024. doi: 10.1145/3643761 2
-
[12]
D. Hayatpur, D. Wigdor, and H. Xia. Crosscode: Multi-level visual- ization of program execution. InProc. CHI, CHI ’23, art. no. 593, 13 pages. ACM, New York, NY , USA, 2023. doi: 10.1145/3544548. 3581390 2
-
[13]
J. Kehrer and H. Hauser. Visualization and visual analysis of multi- faceted scientific data: A survey.IEEE Trans. Vis. Comput. Graph., 19(3):495–513, 2012. doi: 10.1109/tvcg.2012.110 4
-
[14]
M. B. Kery, M. Radensky, M. Arya, B. E. John, and B. A. Myers. The story in the notebook: Exploratory data science using a literate programming tool. InProc. CHI, CHI ’18, pp. 1–11. ACM, New York, NY , USA, 2018. doi: 10.1145/3173574.3173748 2
-
[15]
M. B. Kery, D. Ren, F. Hohman, D. Moritz, K. Wongsuphasawat, and K. Patel. Mage: Fluid moves between code and graphical work in computational notebooks. InProc. ACM UIST, pp. 140–151, 2020. doi: 10.1145/3379337.3415842 2
- [16]
-
[17]
A. J. Ko, B. A. Myers, M. J. Coblenz, and H. H. Aung. An ex- ploratory study of how developers seek, relate, and collect relevant information during software maintenance tasks.IEEE Trans. Softw. Eng, 32(12):971–987, 2006. doi: 10.1109/tse.2006.116 2
-
[18]
T. D. LaToza and B. A. Myers. Developers ask reachability questions. InProc. ACM/IEEE ICSE, pp. 185–194, 2010. doi: 10.1145/1806799 .1806829 1, 2
-
[19]
L. Layman, M. Diep, M. Nagappan, J. Singer, R. Deline, and G. Veno- lia. Debugging revisited: Toward understanding the debugging needs of contemporary software developers. InACM/IEEE international symposium on empirical software engineering and measurement, pp. 383–392. IEEE, 2013. doi: 10.1109/esem.2013.43 2
-
[20]
Y . Lin, L. Yang, H. Li, H. Qu, and D. Moritz. Interlink: Linking text with code and output in computational notebooks. InProc. CHI, pp. 1–15, 2025. doi: 10.1145/3706598.3714104 4
- [21]
-
[22]
O. Moseler, M. Wolz, and S. Diehl. Visual breakpoint debugging for sum and product formulae. InWorking Conference on Software Visualization (VISSOFT), pp. 133–137. IEEE, 2020. doi: 10.1109/ vissoft51673.2020.00019 4
-
[23]
Perscheid, B
M. Perscheid, B. Siegmund, M. Taeumel, and R. Hirschfeld. Study- ing the advancement in debugging practice of professional software developers.Software Quality Journal, 25(1):83–110, 2017. doi: 10. 1007/s11219-015-9294-2 2
2017
-
[24]
Pirolli and S
P. Pirolli and S. Card. The sensemaking process and leverage points for analyst technology as identified through cognitive task analysis. InProc. international conference on intelligence analysis, pp. 2–4. McLean, V A, USA, 2005. 2
2005
-
[25]
Ramasamy, C
D. Ramasamy, C. Sarasua, A. Bacchelli, and A. Bernstein. Visualising data science workflows to support third-party notebook comprehen- sion: an empirical study.Empirical Software Engineering, 28(3):58,
-
[26]
doi: 10.1007/s10664-023-10289-9 1, 2
-
[27]
J. C. Roberts. State of the art: Coordinated & multiple views in ex- ploratory visualization. InInternational Conference on Coordinated and Multiple Views in Exploratory Visualization, pp. 61–71, 2007. doi: 10.1109/CMV.2007.20 4
-
[28]
Salda ˜na.The coding manual for qualitative researchers
J. Salda ˜na.The coding manual for qualitative researchers. Sage Pub- lications, Inc, Los Angeles, 2nd ed ed., 2013. 2
2013
-
[29]
S. Schelter, D. Lange, P. Schmidt, M. Ce ¸likel, F. Biessmann, and A. Grafberger. Automating large-scale data quality verification.Proc. VLDB Endowment, 11(12):1781–1794, 2018. doi: 10.14778/3229863 .3229867 4
-
[30]
R. Schulz, F. Beck, J. W. C. Felipez, and A. Bergel. Visually explor- ing object mutation. InIEEE Conference on Software Visualization (VISSOFT), pp. 21–25. IEEE, 2016. doi: 10.1109/vissoft.2016.21 4
-
[31]
C. Scully-Allison, I. Lumsden, K. Williams, J. Bartels, M. Taufer, S. Brink et al. Design concerns for integrated scripting and interactive visualization in notebook environments.IEEE Trans. Vis. Comput. Graph., 30(9):6572–6585, 2024. doi: 10.1109/tvcg.2024.3354561 2
-
[32]
J. Sillito, G. C. Murphy, and K. De V older. Asking and answering questions during a programming change task.IEEE Trans. Softw. Eng, 34(4):434–451, 2008. doi: 10.1109/tse.2008.26 1, 2
-
[33]
H. Stitz, S. Luger, M. Streit, and N. Gehlenborg. Avocado: Visualiza- tion of workflow–derived data provenance for reproducible biomedi- cal research. InComputer Graphics Forum, pp. 481–490. Wiley On- line Library, 2016. doi: 10.1111/cgf.12924 2, 4
-
[34]
A. Y . Wang, W. Epperson, R. A. DeLine, and S. M. Drucker. Diff in the loop: Supporting data comparison in exploratory data analysis. InProc. CHI, CHI ’22, art. no. 97, 10 pages. ACM, New York, NY , USA, 2022. doi: 10.1145/3491102.3502123 2
- [35]
-
[36]
M. Weiser. Program slicing.IEEE Trans. Softw. Eng, SE-10(4):352– 357, 1984. doi: 10.1109/tse.1984.5010248 4
-
[37]
Y . Wu, J. M. Hellerstein, and A. Satyanarayan. B2: Bridging code and interactive visualization in computational notebooks. InProc. ACM UIST, UIST ’20, pp. 152–165. ACM, New York, NY , USA, 2020. doi: 10.1145/3379337.3415851 2, 4
-
[38]
K. Xiong, S. Fu, G. Ding, Z. Luo, R. Yu, W. Chen et al. Visualizing the scripts of data wrangling with somnus.IEEE Trans. Vis. Comput. Graph., 29(6):2950–2964, 6 2023. doi: 10.1109/tvcg.2022.3144975 2
discussion (0)
Sign in with ORCID, Apple, or X to comment. Anyone can read and Pith papers without signing in.